
Table of Contents
- a. Key Points
- b. Demand
- c. Profits & Margins
- d. Balance Sheet
- e. Guidance & Valuation
- f. Call & Release
- g. Take
a. Key Points
- Wonderfully durable financial performance.
- Positive commentary on ad demand headwinds from the trade war.
- Remains #1 in streaming.
- Cloud remains supply constrained.
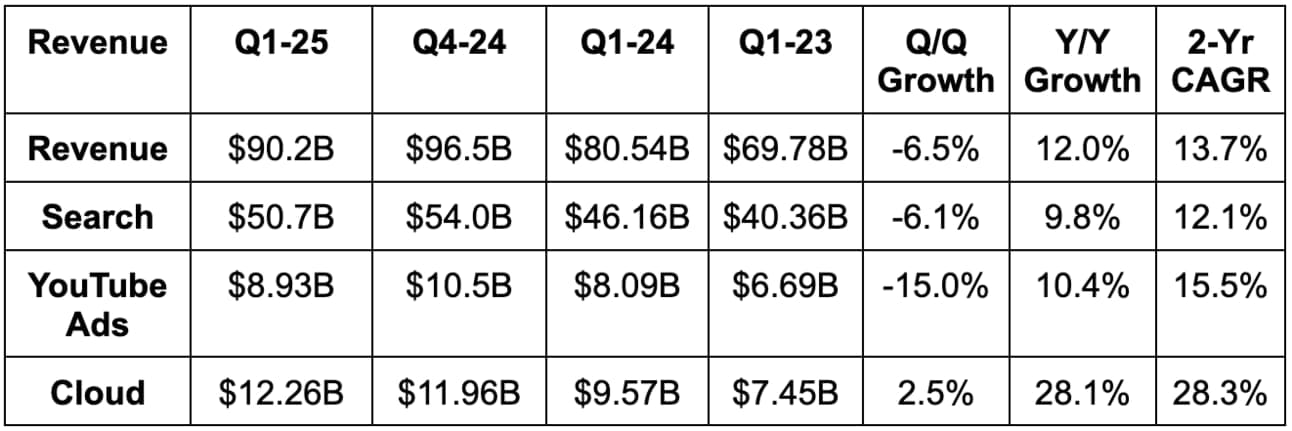
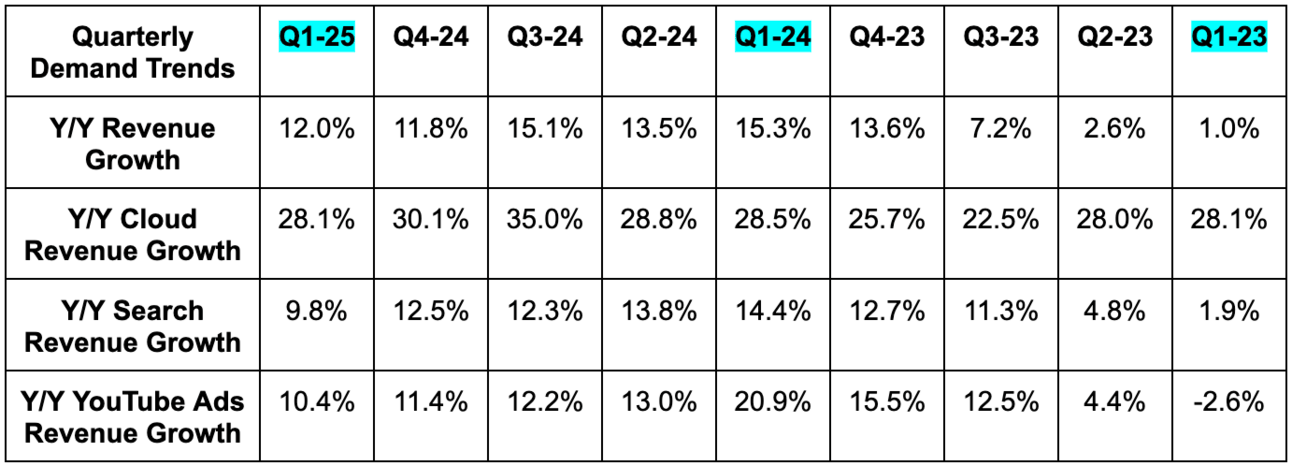
b. Demand
- Beat revenue estimates by 1.2%.
- Search revenue beat estimates by 0.8%.
- Cloud revenue beat estimate by 0.7%.
- YouTube slightly beat revenue estimates.
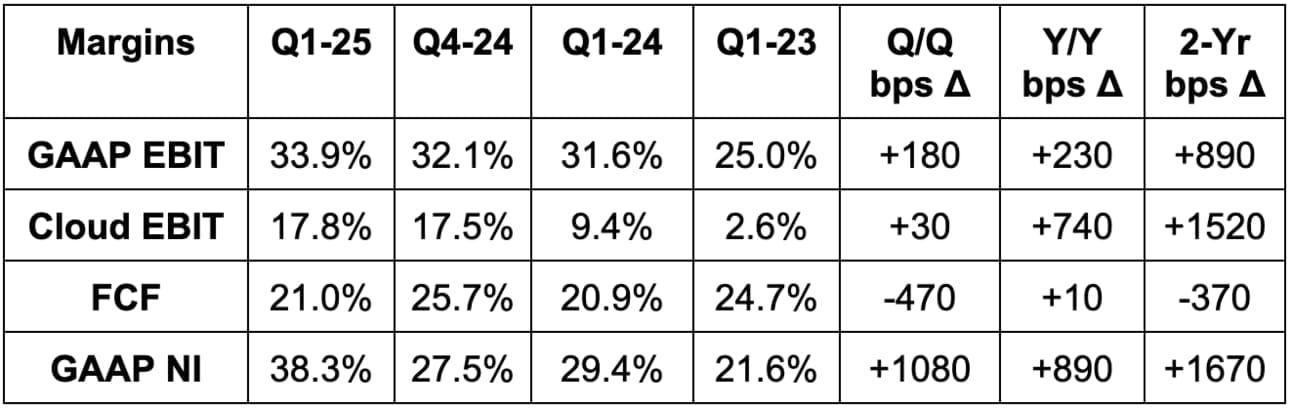
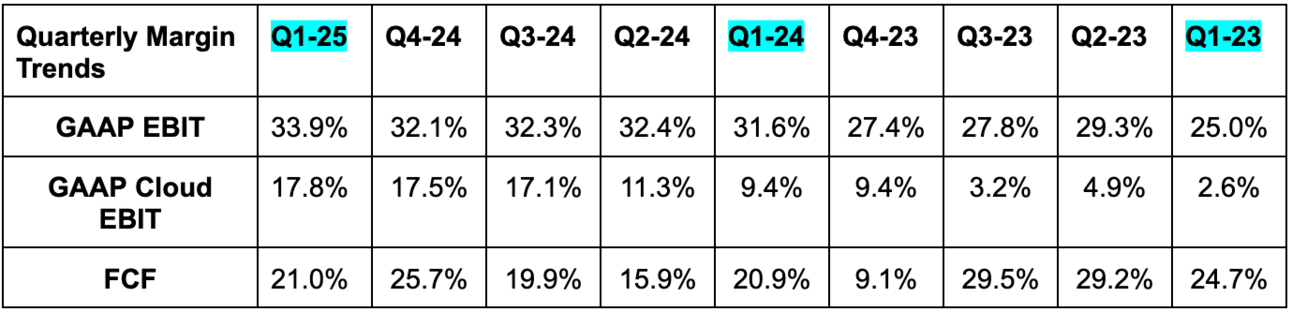
c. Profits & Margins
- Beat EBIT estimate by 6.4%.
- EBIT rose by 20% Y/Y; OpEx rose by 9% Y/Y; R&D rose by 14% Y/Y – led by ramping depreciation expenses via all of the 2023 and 2024 CapEx growth.
- G&A rose by 17% Y/Y, with higher legal expenses materially adding to the cost line.
- Beat $2.01 EPS estimates by $0.80 or by $0.18 excluding equity gains. Mark-to-market equity gains added $0.62 to this quarter’s EPS. Excluding this help, EPS grew by 16% Y/Y.
- This is why I like when firms offer non-GAAP EPS alongside GAAP.
- Beat free cash flow (FCF) estimates by 1%.
d. Balance Sheet
- $95B in cash & equivalents; $51B in non-marketable securities.
- $10.9B in debt.
- 1.9% Y/Y share dilution. Announced a new $70B buyback program (3.5% of the market cap).
- Spent $17.2B in CapEx for the quarter.
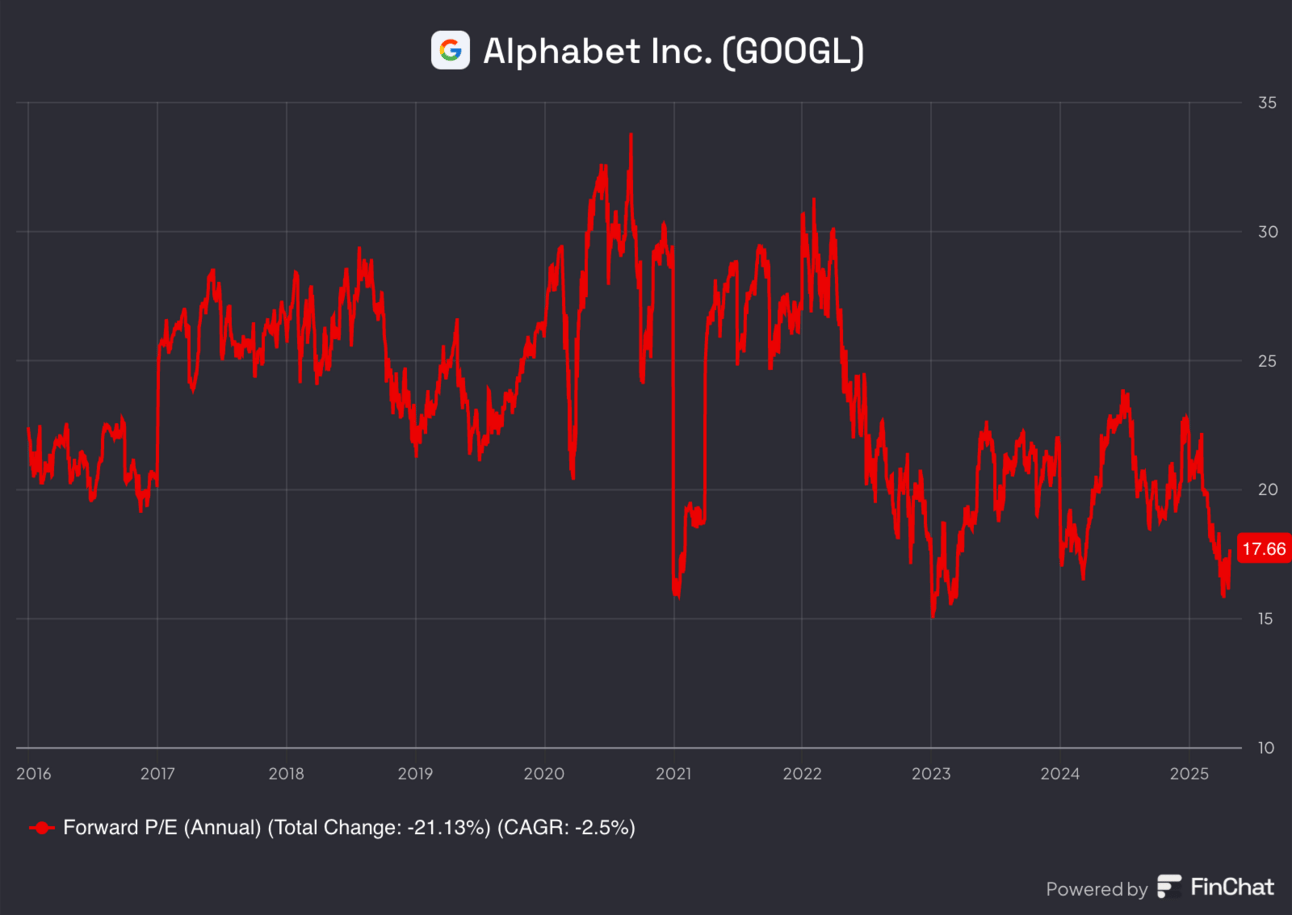
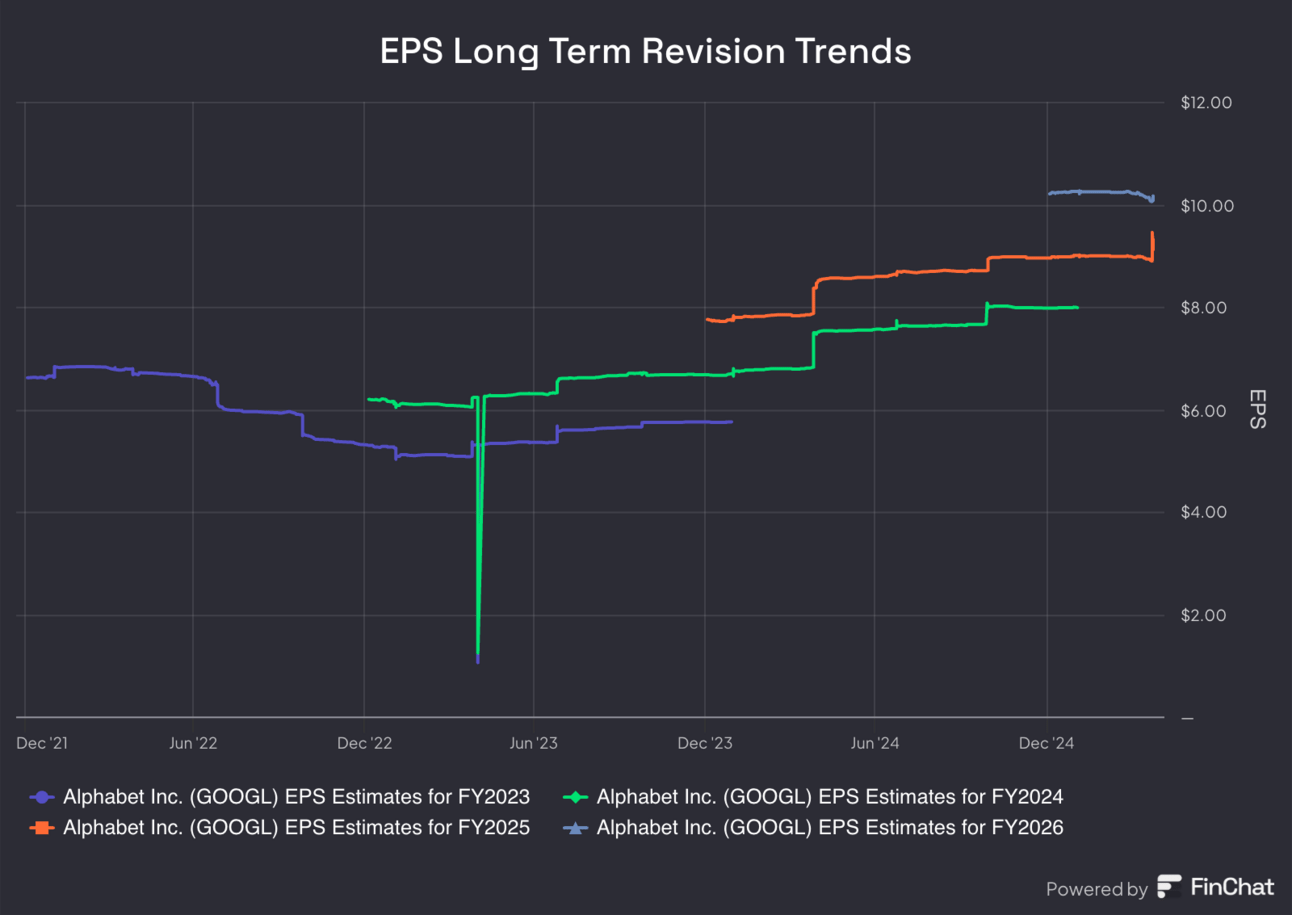
e. Guidance & Valuation
Alphabet reiterated its $75B CapEx guidance for the year. It continued to guide to accelerating depreciation expenses due to all of this CapEx growth. EPS is expected to grow by 16% this year and by 9% next year. EBIT is expected to compound at a 13% clip for the next two years.
f. Call & Release
Full-Stack AI: