

Table of Contents
a. Key Points
- Total active customer levels resumed growth.
- Ongoing challenges from the November 2025 data breach.
- Taiwan segment progress remains encouraging.
- Signs of core business normalization are there.
b. Demand
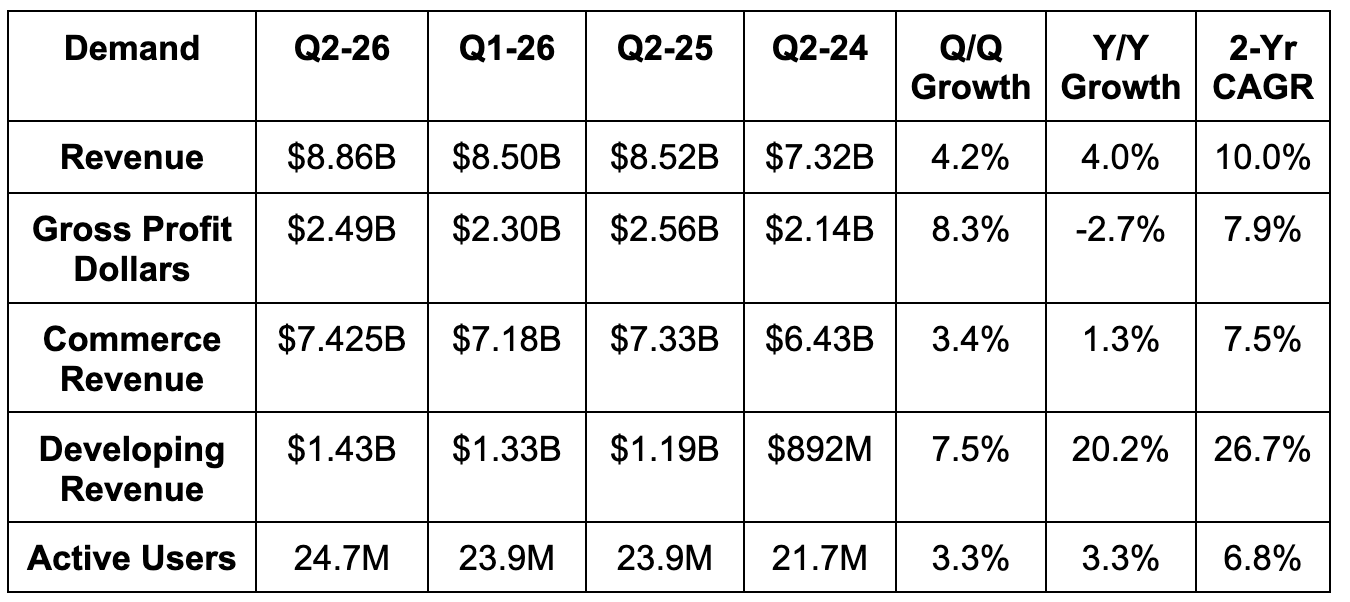
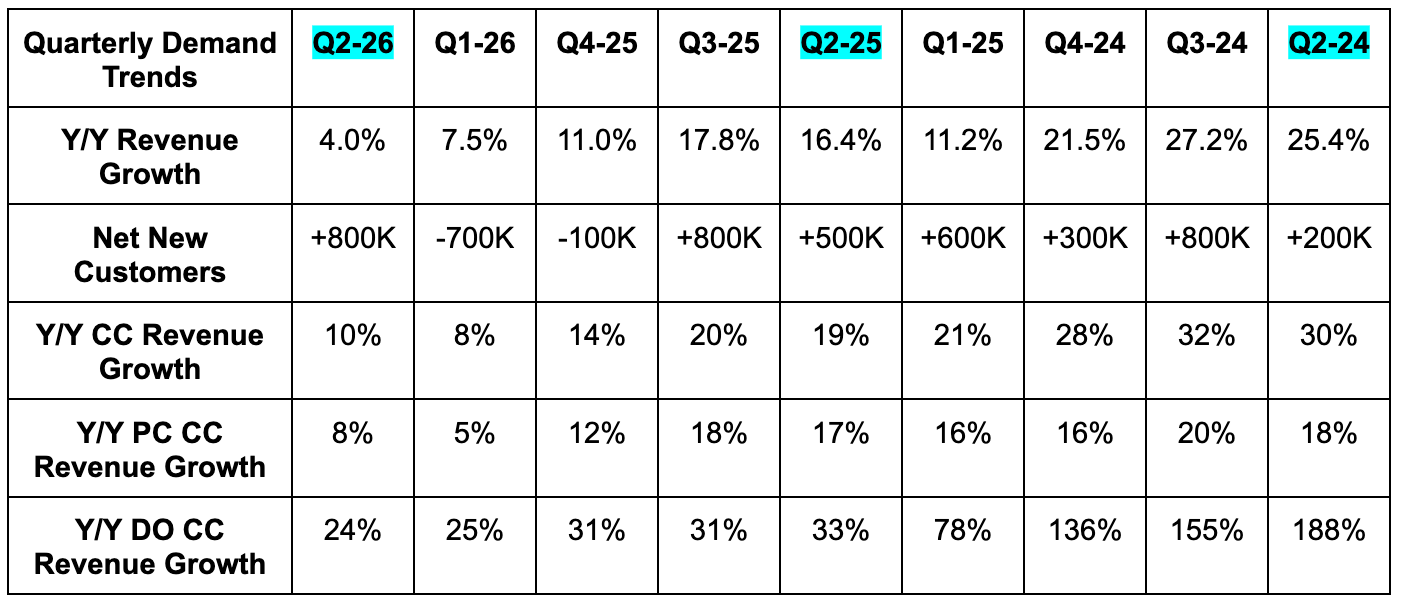
- Missed revenue estimate by 0.5%. Focus on constant currency (CC) growth, especially with ongoing Korean won weakness. Coupang met 10% CC growth estimate & beat 9.5% CC growth guidance.
- Beat active customer estimate by 3%. Good to see Coupang register a snap back in net new customers as people return following the data breach. Customer count set new highs once more.
- No impact from the mid-quarter fire in Q2 or in the Q3 guide. They’ve been able to route the orders to other fulfillment centers.
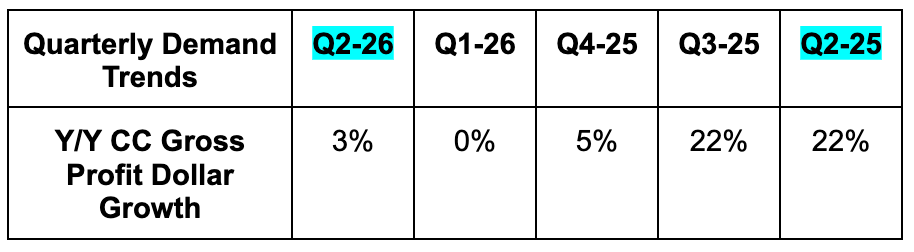
As a reminder, gross profit dollar growth is a better gauge of demand for this company than revenue. It’s rapidly shifting to a 3rd-party model where it houses merchant assortment and handles their logistics for them. 3rd-party sales entail commissions that deliver less revenue than if Coupang sold the product directly. That’s a growth drag, but these commissions are virtually all gross profit. That makes gross profit growth a better metric for measuring marketplace demand at this point.
c. Profits & Margins
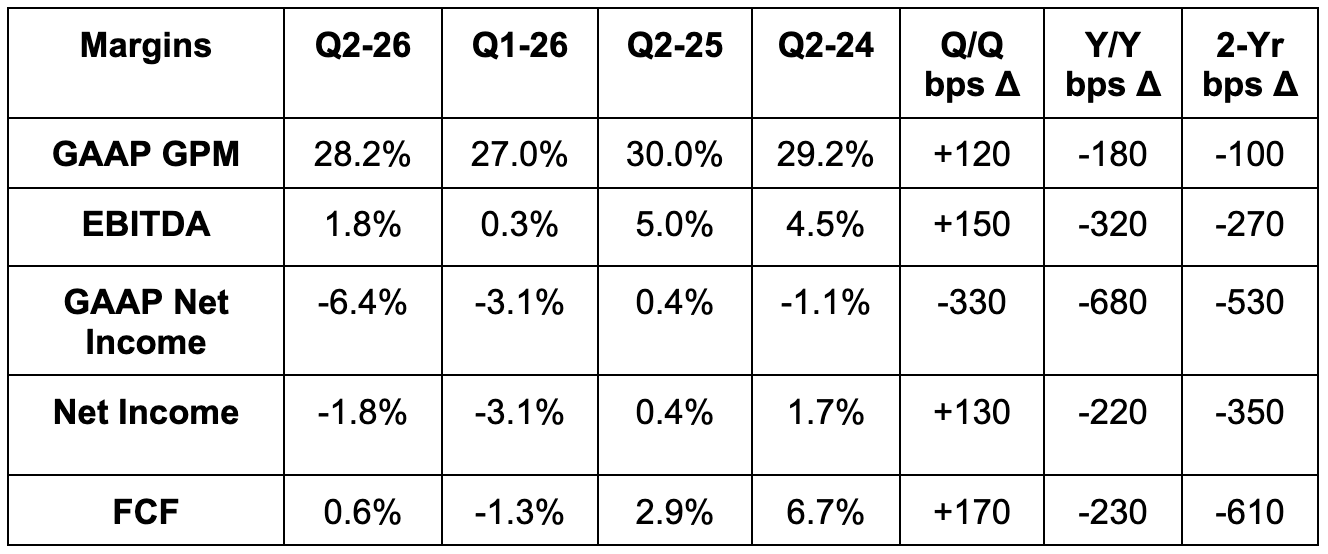
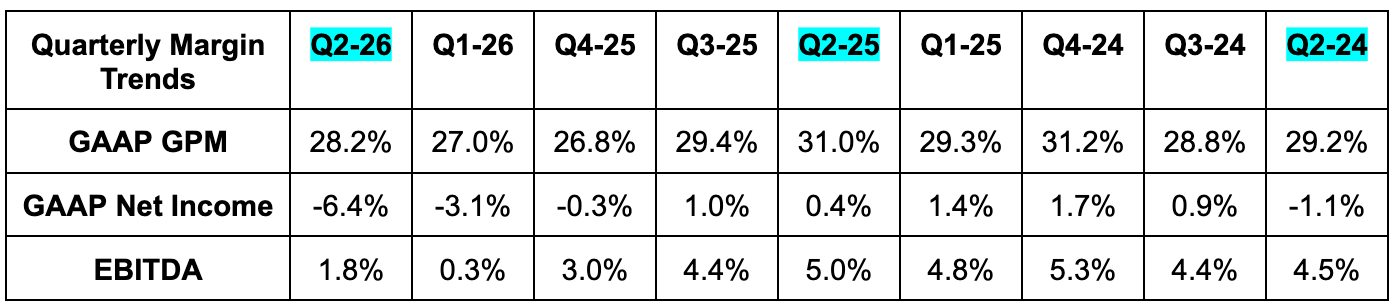
- Missed 28.4% GPM estimate by 20 basis points (bps; 1 basis point = 0.01%).
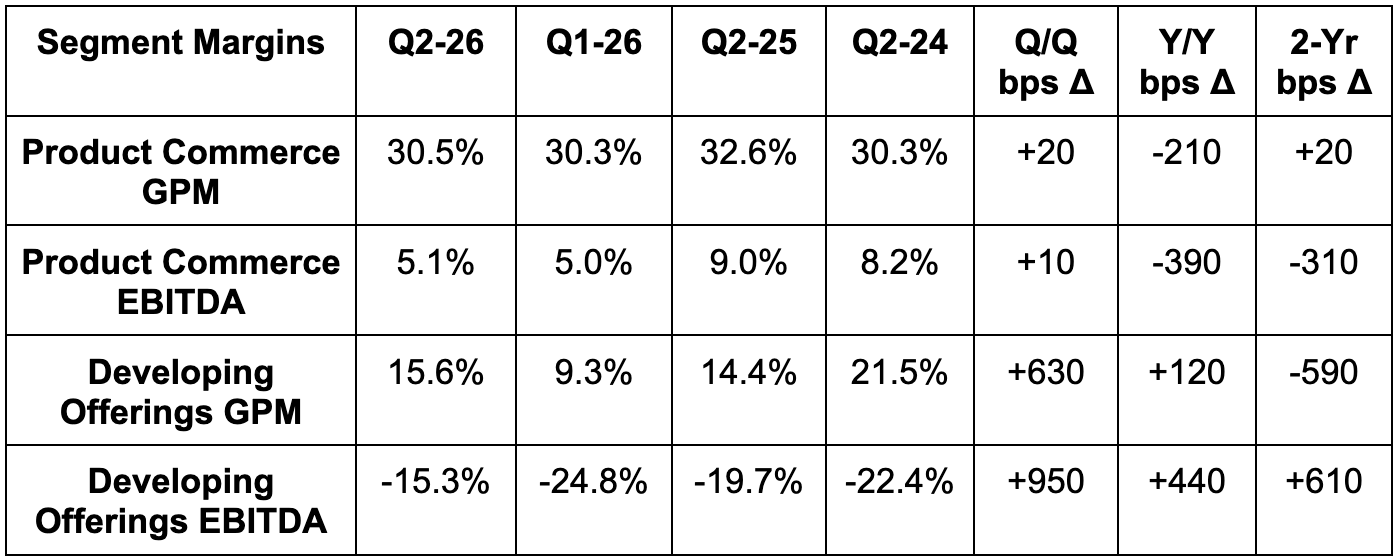
- Product Commerce (PC) is driving the GPM (and other margin) contraction. This is all tied to the ongoing impact from the November 2025 data breach.
- Developing Offerings (DO) margin expansion “demonstrates a path to sustainable economics” in leadership’s eyes.
- Beat $7M EBITDA estimate by $156M & beat EBITDA margin guidance.
- Beat -$0.27 EPS estimate by $0.18.
- Missed -$0.27 GAAP EPS estimate by $0.02.
- GAAP results included a $410M fine from the Korean government in connection with the aforementioned data breach. Non-GAAP results exclude this, representing the difference between Q2 2026 GAAP net income margin and net income margin seen below.
d. Balance Sheet
- $6.1B cash & equivalents.
- $2.6B debt.
- Diluted share count -3% Y/Y.