
Table of Contents
- 1. Earnings Round-Up — Lemonade, Robinhood & Coinb …
- 2. Meta Platforms (META) — Earnings Review
- 3. Microsoft (MSFT) – Earnings Review
1. Earnings Round-Up — Lemonade, Robinhood & Coinbase
Meta and Microsoft commanded most of my attention tonight and those are the two full reviews in this article. Still, I know there’s a lot of interest in these three companies, so I wanted to include very brief snapshots of each report tonight. While my reviews function as complete, detailed dives into reports, these snapshots offer 30,000 ft. views.
For Lemonade, I will include more detailed coverage, quantitative data and my views on the report in Saturday’s article. I don’t follow the other two names closely, but I also plan to cover Robinhood’s call in more detail Saturday if time permits. HOOD has implications for other names that I do focus on.
a. Lemonade (LMND)
Results:
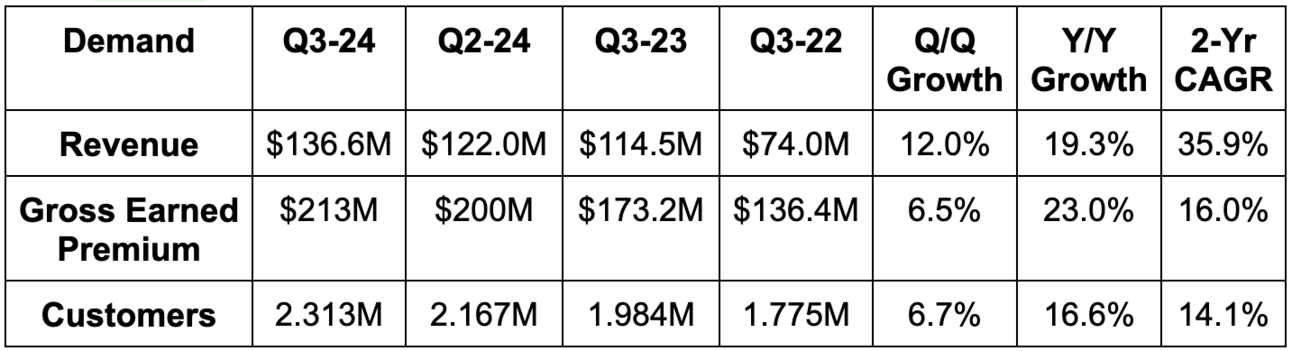
- Beat gross earned premium (GEP) guidance by 1.9%.
- Beat in force premium (IFP) guidance by 1.4%
- Beat revenue estimates by 8% & beat guidance by 9.3%.
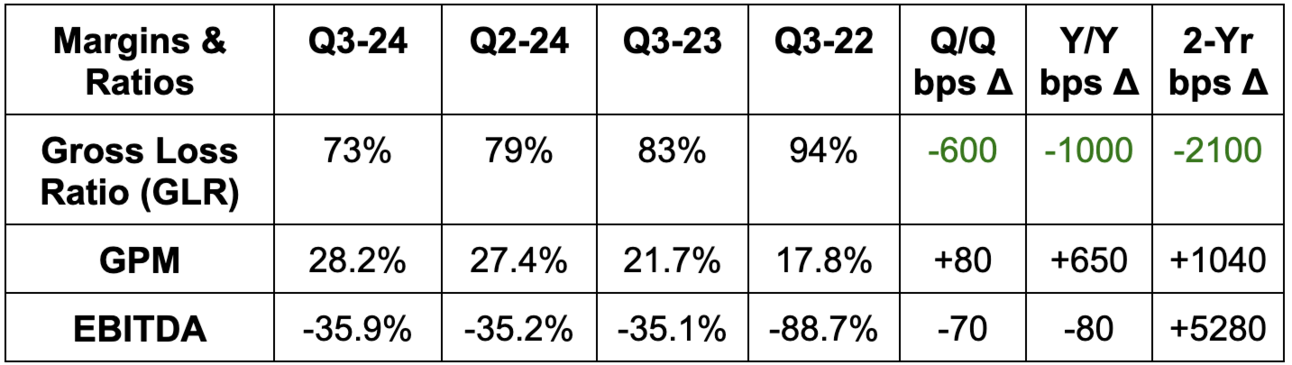
- Beat -$56M EBITDA estimates by $7M & beat guidance by $8M.
Guidance & Valuation:
- Q4 revenue guidance met estimates.
- Q4 EBITDA guidance missed -$21M estimates by $6M.
- Considering the historically bad hurricane that swept through the state recently, this was actually better than I expected.
- Raised annual revenue & GEP guides due to large Q3 beats.
Lemonade expects to be EBITDA positive in 2026. Wildly speculative investment. High risk/high potential reward.
Balance Sheet:
- $979M in cash & equivalents.
- No debt.
- Turned operating cash flow positive this quarter. Reiterated path to positive FCF.
- Liquidity will remain a strength following expected hurricane-related losses.
b. Coinbase (COIN)
Results:
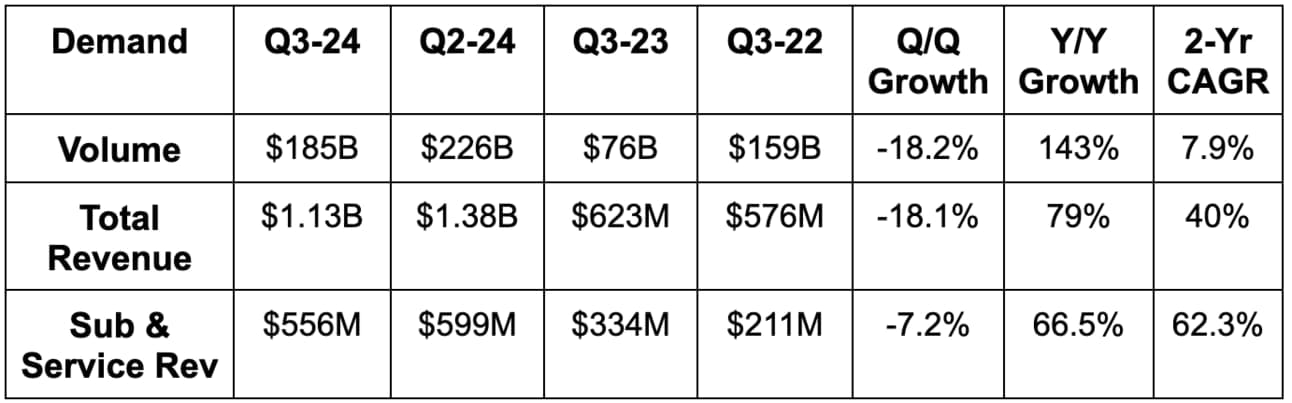
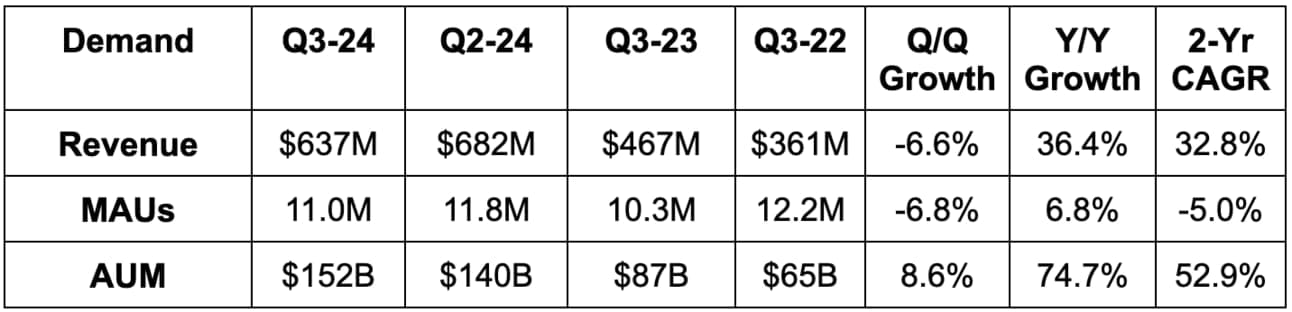
- Missed revenue estimates by 9.6%; missed subscription revenue guidance by 1.6%.
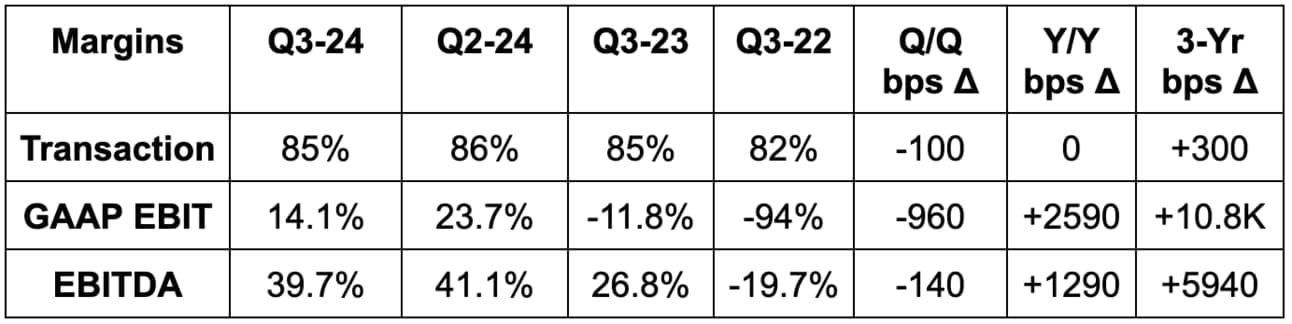
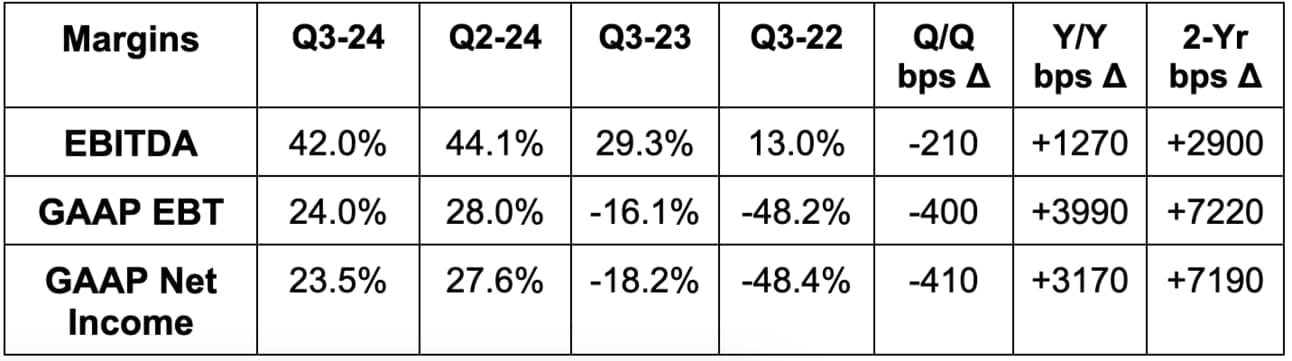
- Beat EBITDA estimates by 2%.
- Beat GAAP EBIT estimates by 13.8%.
- Missed $0.68 GAAP EPS estimates by $0.40.
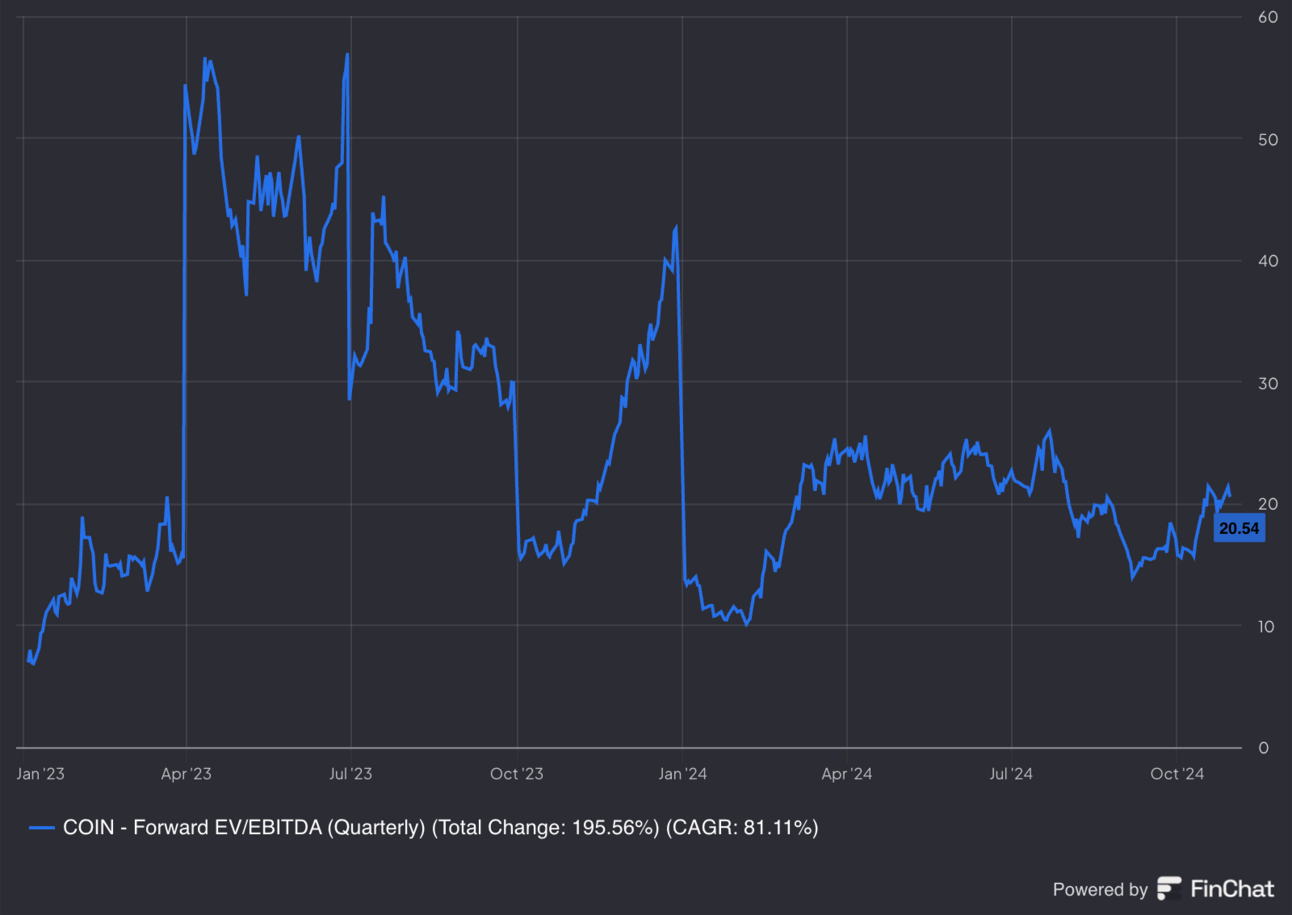
Guidance & Valuation:
- $542.5 million in subscription and support revenue.
Balance Sheet:
- $7.7B in cash & equivalents.
- $4.2B in total debt.
- Basic share count rose 5% Y/Y.
- Diluted share count rose 13% Y/Y.
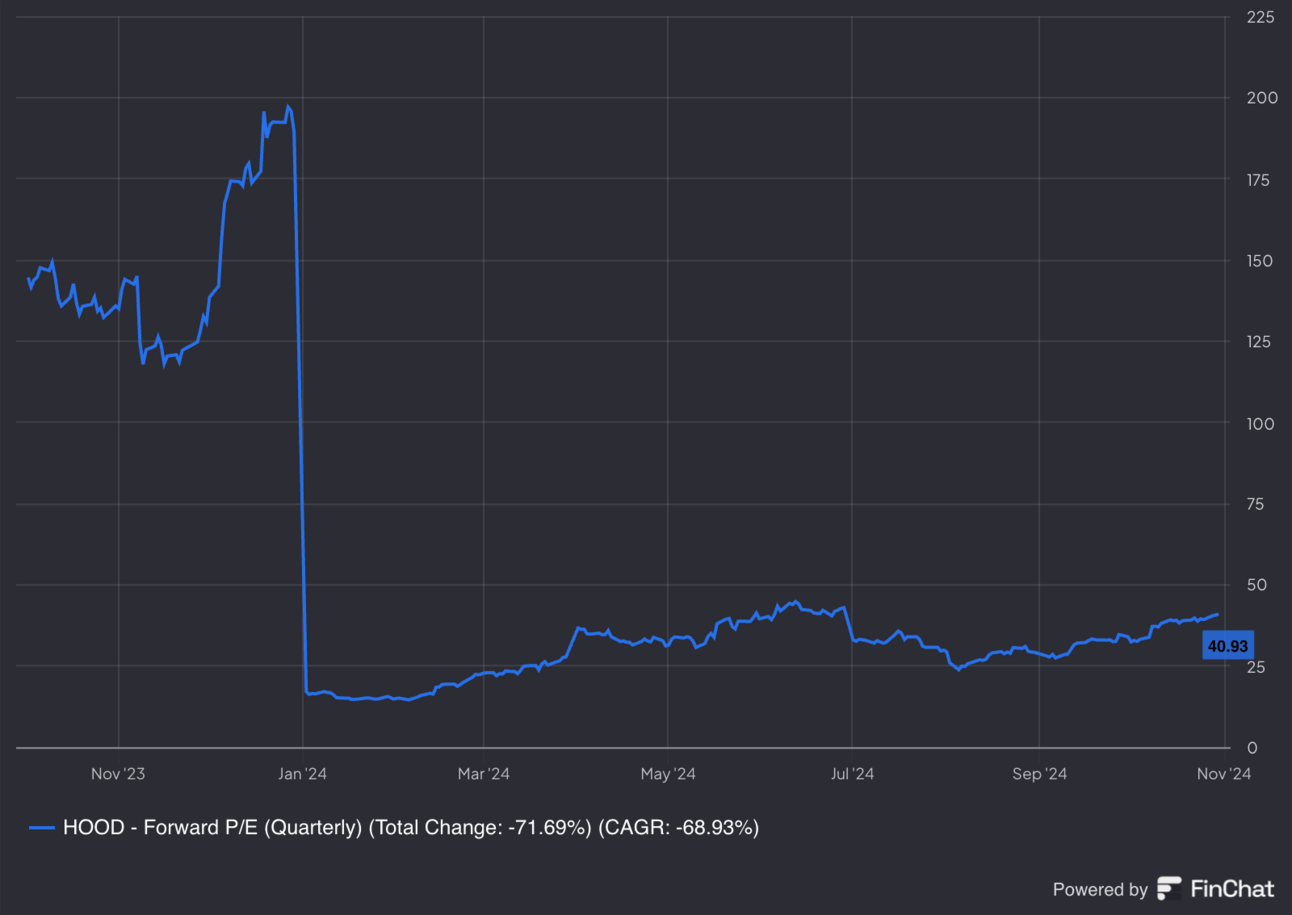
c. Robinhood (HOOD)
Results:
- Missed revenue estimates by 3.5%. All buckets besides “other” missed.
- Missed EBITDA estimates by 3.1%.
- Slightly missed $0.18 GAAP EPS estimates by $0.01.
- Met net funded accounts estimate.
- Slightly beat assets under custody estimates.
- Robinhood Gold subscribers rose 65% Y/Y vs. 61% Y/Y last quarter.
Valuation:
EPS is expected to double this year and fall by 3% next year.
Balance Sheet:
- $4.6B in cash & equivalents.
- No debt.
- Diluted share count rose 1% Y/Y; basic share count fell 1.2% Y/Y.
- $39B in trailing 12-month net deposits vs. $33B Q/Q & $24B 2 quarters ago.
2. Meta Platforms (META) — Earnings Review
Recent Content to Read:
- AMD, Alphabet and Visa Earnings Coverage.
- SoFi & PayPal Earnings Coverage.
- Tesla & Service Now Earnings Coverage.
- Netflix and Taiwan Semi Earnings Coverage.
- SoFi Deep Dive.
- Nu Deep Dive.
- Zscaler Investment Case (shorter deep dive).
- Starbucks Investment Case.
- Cava and SweetGreen Deep Dives.
Amazon & Apple coming tomorrow. Dozens more reports coming this season.
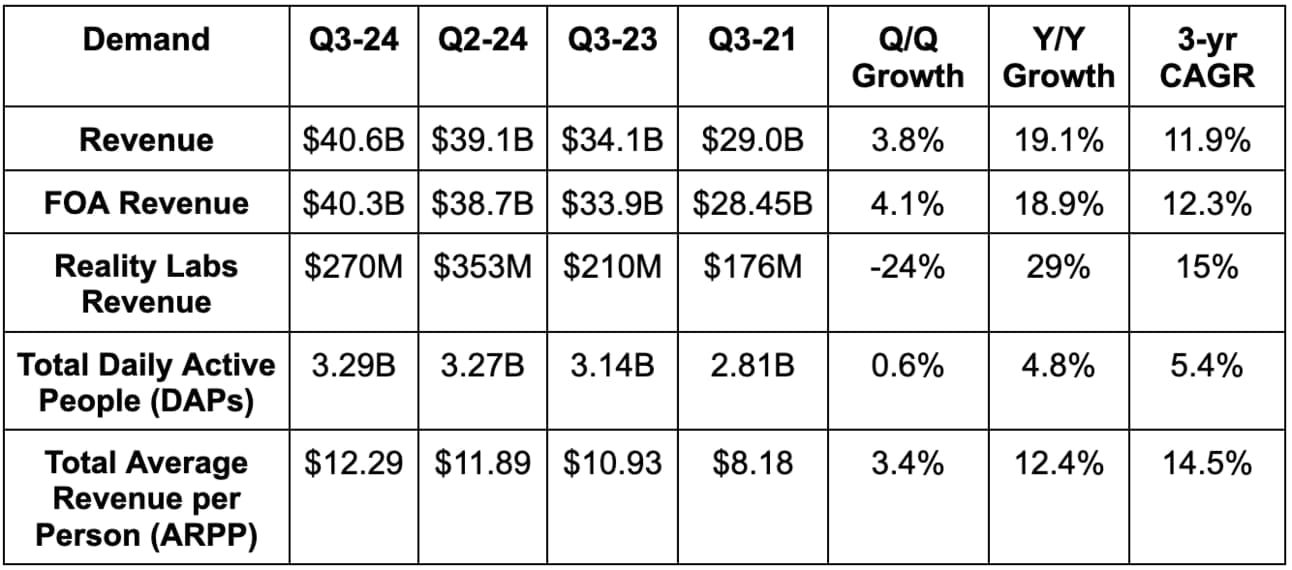
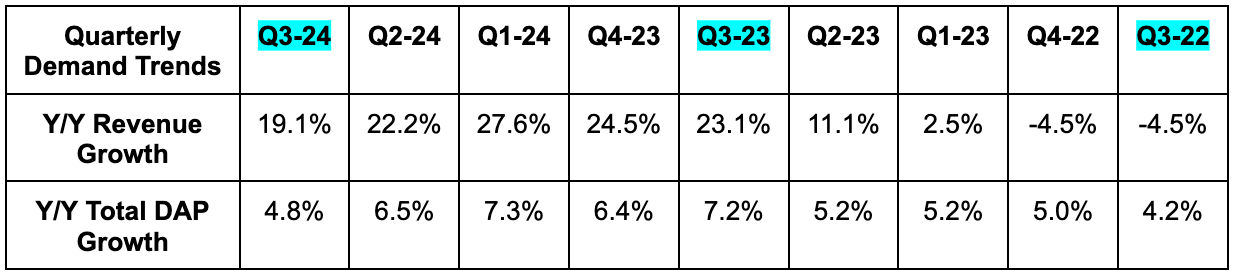
a. Demand
- Beat revenue estimates by 0.7% & beat guidance by 2.1%.
- Beat family of app (FOA) revenue estimates by 1.0%; missed $312 million Reality Labs revenue estimates by $42 million.
- Price per ad impression rose 11% Y/Y. This was the best result in over two years as it monetizes Reels more effectively. Total impressions rose 11% Y/Y.
- Beat Total Daily Active People (DAP) estimates by 1.2%.
- By advertiser geography, ad revenue rose by:
- 21% Y/Y in the USA & Europe
- 17% Y/Y in Rest of World.
- 15% in Asia Pacific. It is lapping strong Shein and Temu seller demand from last year just like Alphabet is.
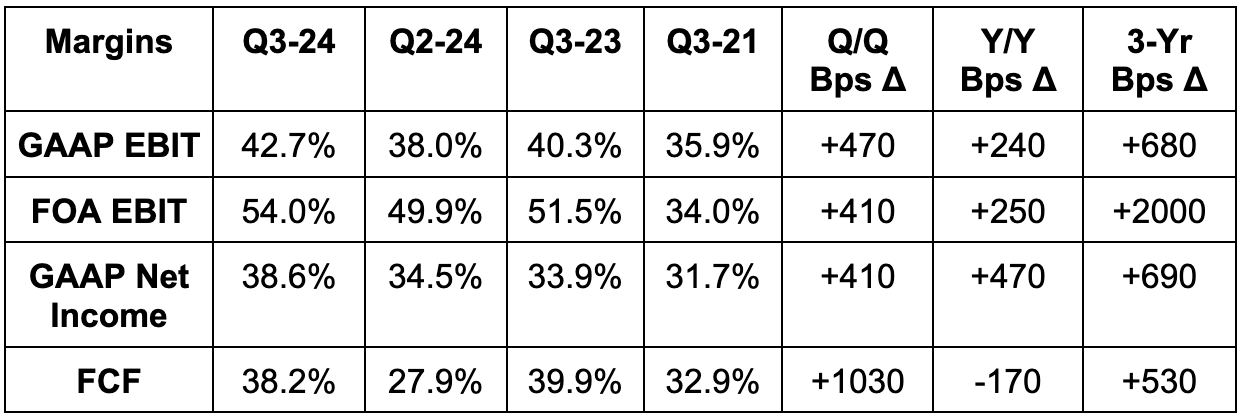
b. Profits & Margins
- Beat EBIT estimates by 7.1%; both segments beat EBIT expectations.
- Operating expenses (OpEx) rose by 14% Y/Y.
- R&D rose 21% Y/Y due to 9% Y/Y headcount growth and higher infrastructure costs.
- Sales & marketing & G&A both fell Y/Y due to lower restructuring and legal fees.
- Cost of revenue rose by 19% Y/Y to support continued GenAI infrastructure investments (it’s not just higher CapEx from this).
- Beat $5.25 EPS estimates by $0.78.
- Beat $11.5B free cash flow (FCF) estimates by $4B.
- Spent $9.2 billion on capital expenditures (CapEx) vs. $11.0 billion expected. This was related to some servers from a 3rd party arriving late. That pushed some CapEx from Q3 to Q4. This is why I love to focus on annualized FCF. It’s lumpy on a quarterly basis.
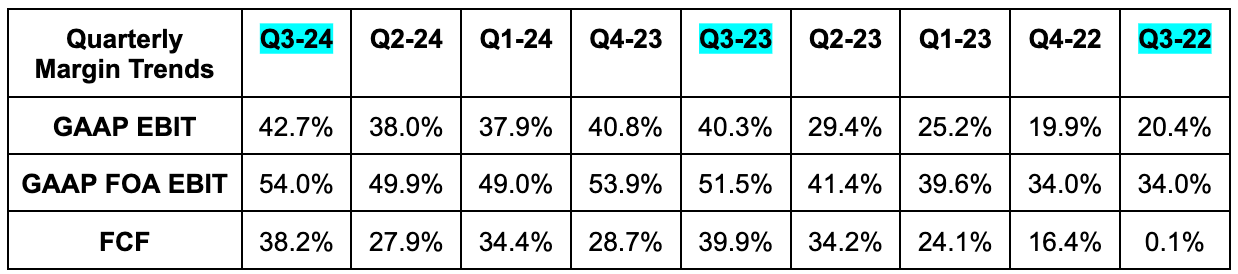
- The 54.0% FOA EBIT margin beat 52.3% margin estimates.
c. Balance Sheet
- $70.9B in cash & equivalents.
- $28.8B in debt. New $10.5 billion debt offering.
- Share count fell 1.6% Y/Y.
d. Guidance & Valuation
Q4 revenue guidance beat expectations by 0.6%. For the year, it slightly lowered its annual OpEx guidance, while slightly raising its CapEx guidance by a modest 1%. It continues to expect CapEx and associated depreciation growth in 2025 vs. 2024. It’s still working on a finalized 2025 CapEx budget. As a reminder, it has great flexibility to allocate these investments to different areas if need be. The dollars will not go to waste.