
As always, we encourage you to share this piece far and wide.
1. Demand
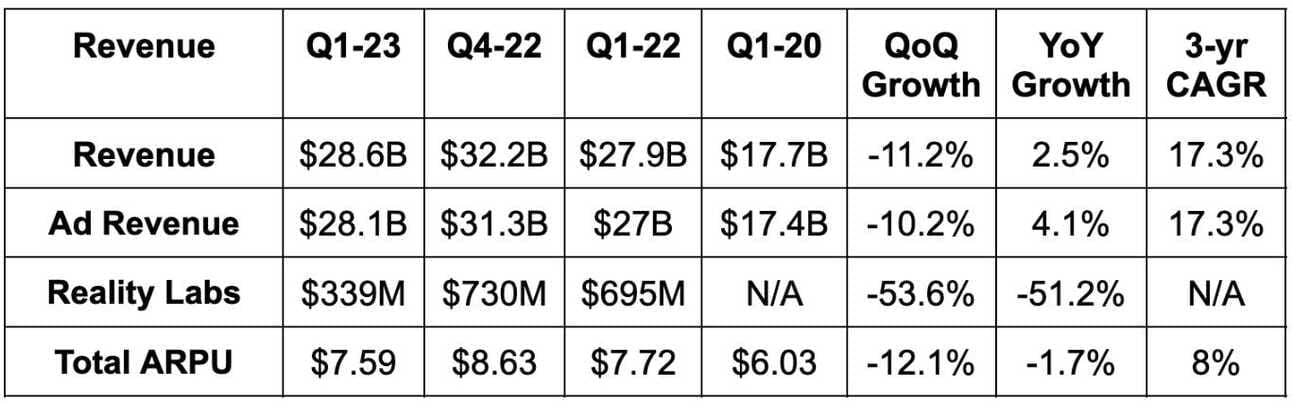
- Beat revenue estimates by 3.2% and beat its revenue guide by 4.8%.
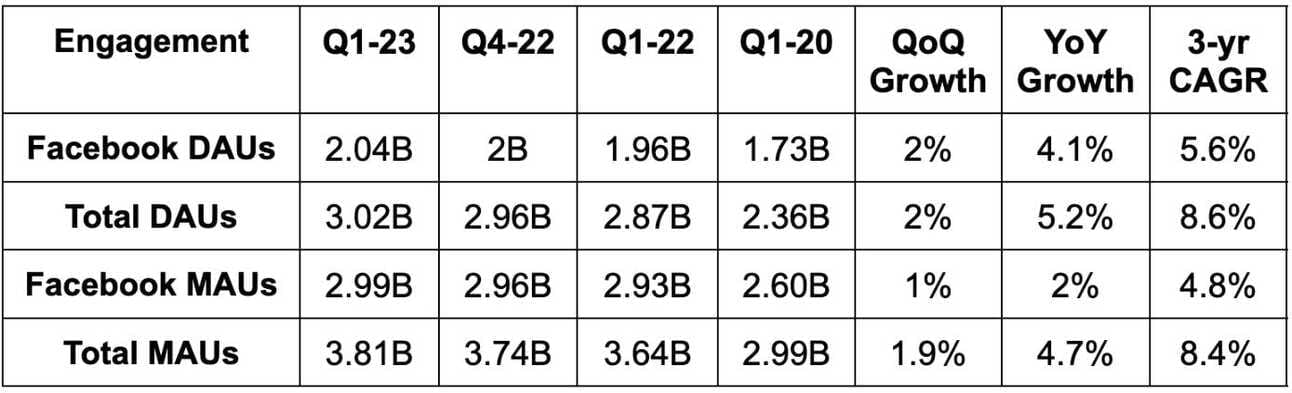
- Beat total daily active user (DAU) estimates by 1.7% and beat the other 3 engagement metrics by a similar margin.
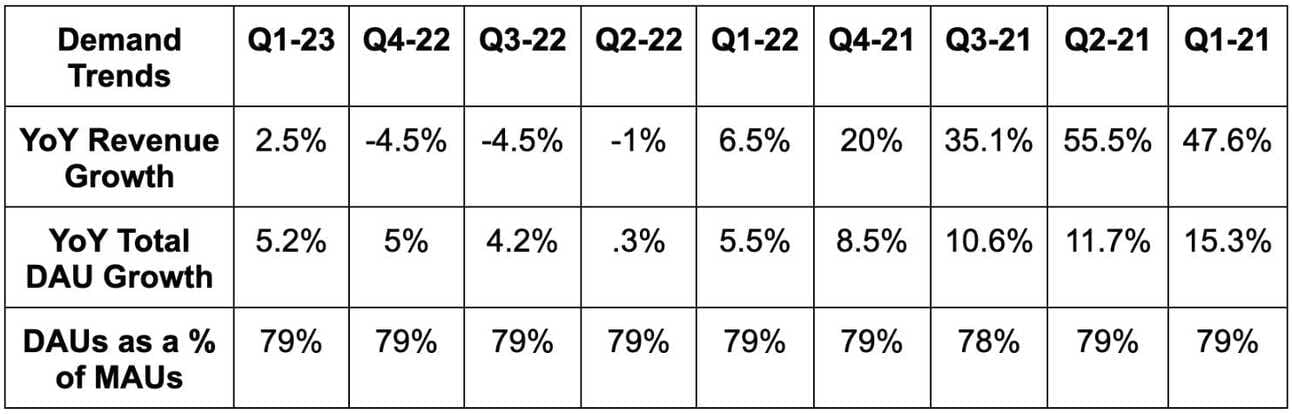
- Impressions grew by 26% YoY vs. expectations of 14% YoY growth. Price per impression fell by 17% YoY vs. expectations of it falling by 14% YoY.
More Demand Context:
- Foreign Exchange (FX) was a 300 bps growth headwind for Meta this quarter. It was expected to be just a 200 bps headwind. The company materially beat revenue expectations regardless of this.
- The 17.3% 3-year revenue CAGR compares to 15.1% last Q and 16.2% 2 Qs ago.
- Pricing pressures were partially due to macro-related ad weakness but also due to rapid impression growth in lower ARPU regions.
2. Margins
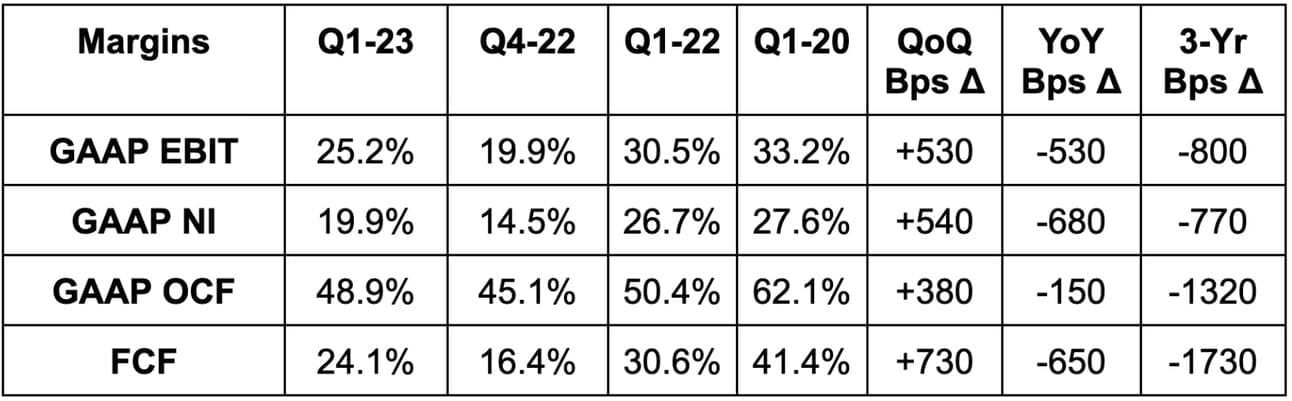
- Beat EBIT estimates by 11.2%.
- Family of Apps (FOA) EBIT margin of 39.6% beat 38.4% estimates by 120 bps.
- Beat $1.97 EPS estimates by $0.23. Without restructuring charges which will not be present in the YoY comparable period for 2024, EPS beat estimates by $0.67.
- Beat free cash flow (FCF) estimates by a whopping 77%.
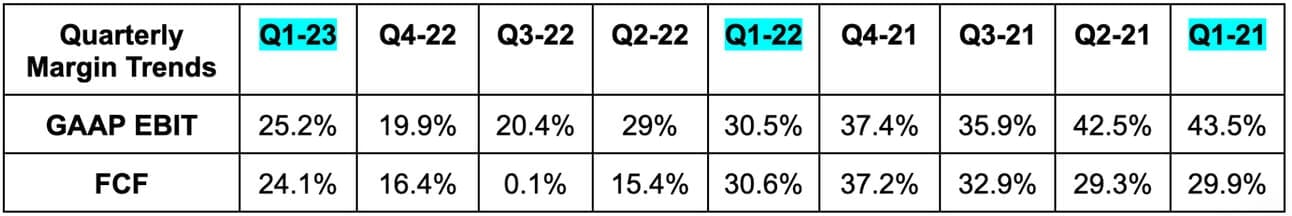
More Margin Context:
Profit metrics include $1.14 billion in restructuring charges taken from layoffs and real estate footprint cuts. Without this charge, EBIT margin would have been 29.2% and net income margin would have been 23.9%. Year of efficiency. And again, EPS would have beaten by $0.67 with earnings of $2.64.