“As the U.S. economy and dining rooms began to reopen, restaurant digital sales proved durable.” — Founder/CEO Noah Glass
a. Demand
Olo guided to $33.9-$34.4 million in quarterly revenue. Analysts expected $34 million. It posted $35.9 million thus beating the high point of its internal guide by 4.4% and analyst expectations by 5.6%.
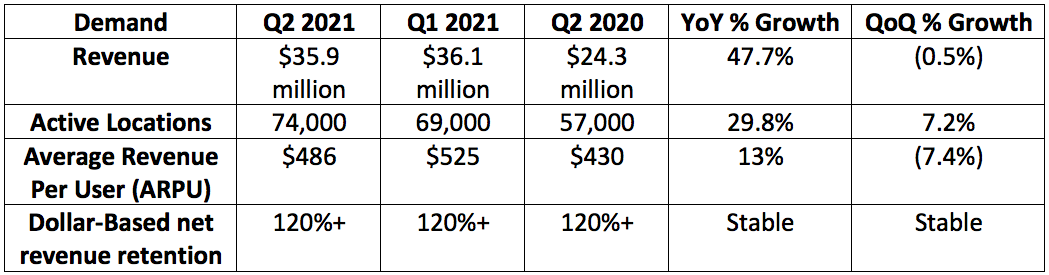
The 9,000 active locations Olo has already added for 2021 is what analysts were expecting for the entire year. As a result, it revised that guidance higher to now adding active locations in the “mid-teen thousands” range. This is a result of deployments happening more quickly than expected and strength in bookings replacing those deployments in the pipeline. This bookings metric represents a great forward-looking gauge of demand.
Olo had been expecting a larger decrease in sequential revenues due to re-opening and the wearing off of stimulus benefits. The sequential decrease in transaction volume was solely driven by these two variables.
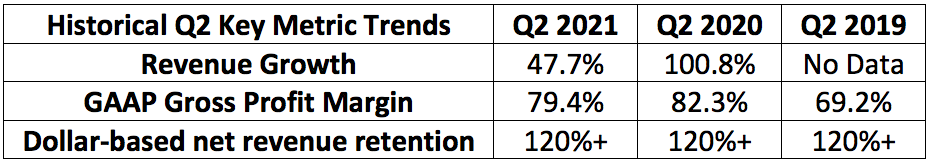
Platform revenue — Olo’s highest margin and most recurring revenue segment by far — grew 53% year over year driven by both more brands and more volume per location.
“Fluctuations in ARPU can be expected as the number of modules a brand initially deploys varies. This quarter we experienced a great number of initial single-module deployments. These deployments represent a great opportunity to land and expand with our new customers. On a full year basis, we anticipate continued momentum in ARPU as growth in multi-product usage increases. ” — CFO Peter Benevides
b. Profitability
The company previously guided to $2.3-$2.7 million in operating income. It posted $5.9 million thus beatings the high point of its internal guide by 118%.
Analysts expected Olo to earn $0.01 per share during the quarter. It posted earnings of $0.03 per share thus beating expectations by $0.02.
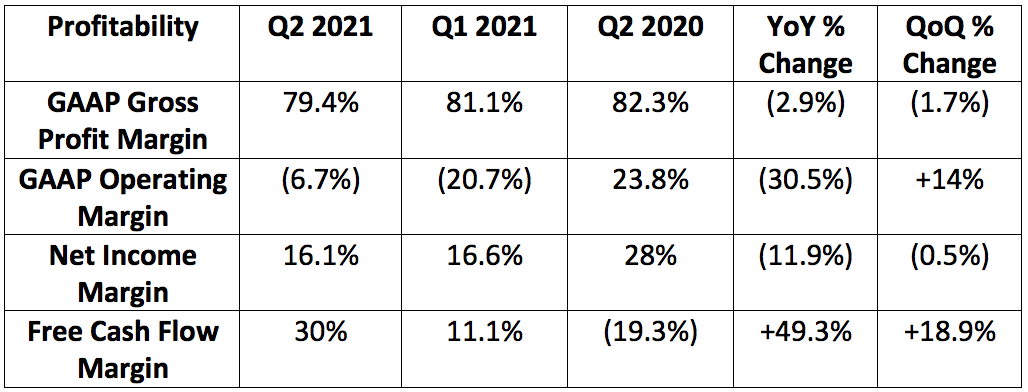
The small sequential and year over year declines in gross margin were driven by an increase in head count and to support rapid growth in locations added to the platform.
The company plans to increase marketing spend as a percent of revenue in the shorter term to support growth. It was 9% of sales this quarter vs. 7% in the comparable year over year period. Similarly, general and administrative (g&a) expenses rose from 17% to 25% of total revenues year over year due to headcount and public company costs. This cost line will decline as a percent of total revenue going forward.
R&d spend continues to dominate the company’s cost structure. This item accounted for 32% of total revenue in the quarter vs. 30% in the year over year period. This will continue to rise in the short term pointing to Olo seeing plenty of opportunity for future product innovation and enhancement.
Olo has $575.2 million in cash on the balance sheet with virtually 0 debt.
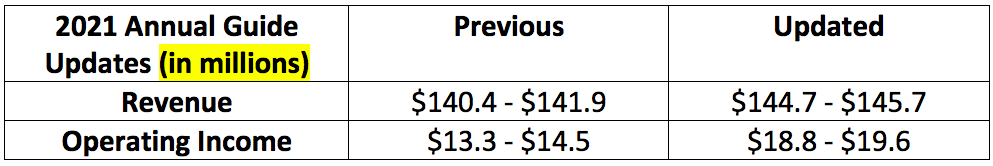
c. Guidance Updates
3rd quarter guidance is as follows:
- $36-$36.5 million in revenue
- Analysts were expecting $34.6 million
- $3.4-$3.8 million in operating income