
Table of Contents
In case you missed it:
- Sea Limited Earnings Review.
- The Trade Desk Earnings Review.
- Lemonade & Duolingo Earnings Reviews.
- Palantir & Hims Earnings Reviews.
- Cava Earnings Review.
- DraftKings Earnings Review.
- Uber Earnings Review.
- Shopify & Coupang Earnings Reviews.
- Meta Earnings Review.
- Alphabet Earnings Review.
- Apple, ServiceNow & Starbucks Earnings Reviews.
- Amazon & Mercado Libre Earnings Reviews.
- PayPal Earnings Review.
- Tesla Earnings Review.
- SoFi Earnings Review.
- Netflix Earnings Review.
- Taiwan Semi Earnings Review.
- Portfolio & performance updates.
a. On Holdings 101
ONON is a premium athletic shoe and clothing company quickly gaining ground against incumbents. They have several popular running shoe products, with 8 of them contributing at least 5% of overall revenue. This is not a one-trick pony. In terms of sports, they’re popular for runners and in tennis, with expansion into more activities going well. The founders are still involved.
Their focus includes operational excellence to find more cost efficiencies, while using that added margin to fund elite product design and innovation – like LightSpray. As a reminder, LightSpray is On's new automated manufacturing technique. It uses robotic arms to (as the name indicates) spray a light material right onto the sole of the shoe to form a single-piece, laceless model. Impressively, this takes a robot 3 minutes per pair and is comparatively quite cheap. Methodical, consistent innovation like this helps with more OpEx efficiencies, which creates room for more investment and drives more profitable growth. That's the formula here.
b. Key Points
- Macro is not holding this company back.
- Asia-Pacific (APAC) demand was the standout.
- Some temporary margin help amplified structural tailwinds.
- Initial 2026 commentary was encouraging.
c. Demand
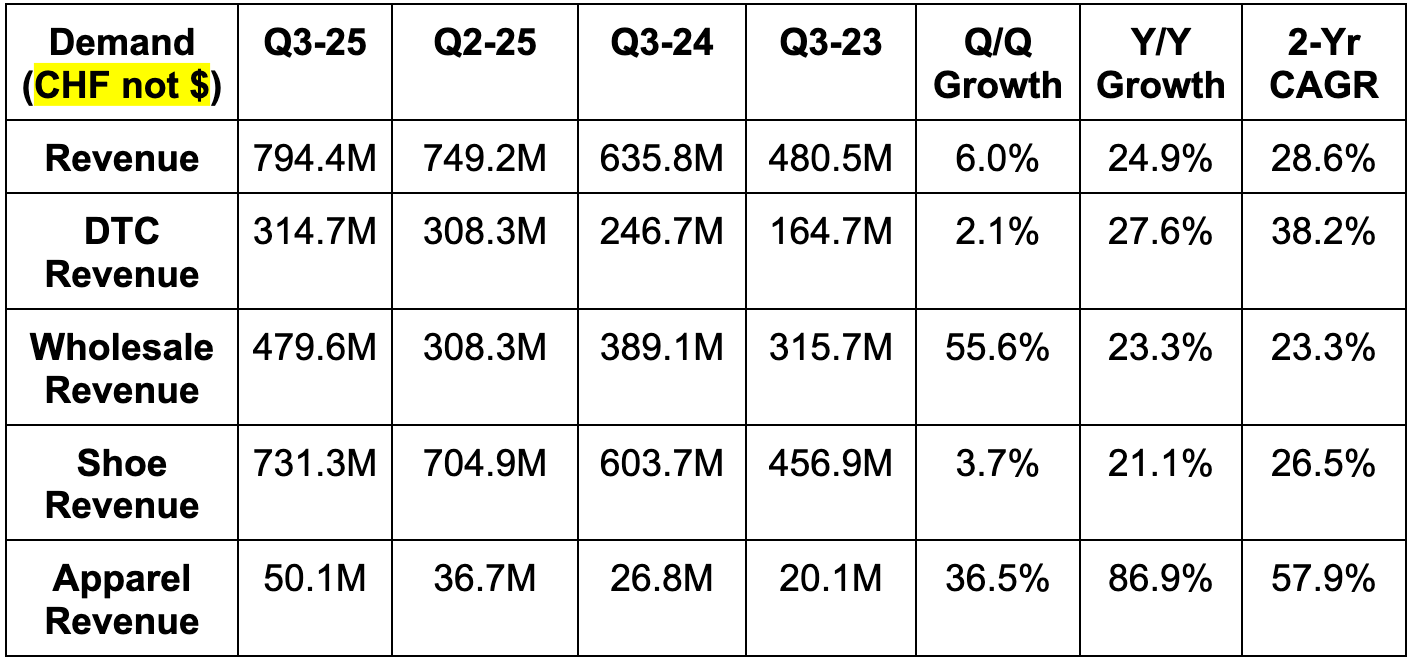
- Beat revenue estimates by 4%.
- Wholesale revenue beat estimates by 4.4%.
- Direct-to-consumer (DTC) revenue beat estimates by 3.3%.
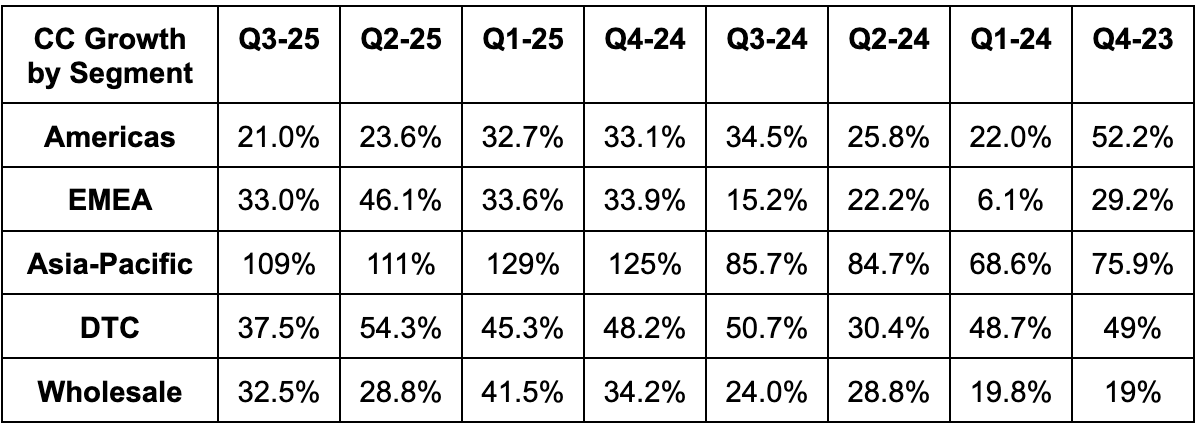
- APAC revenue was 16% ahead of expectations. EMEA revenue was 6% ahead and the Americas missed estimates by 1.5%.
- Apparel revenue beat $39M estimates by $11M, or 27%. Shoes revenue beat $720M estimates by 1.6%.
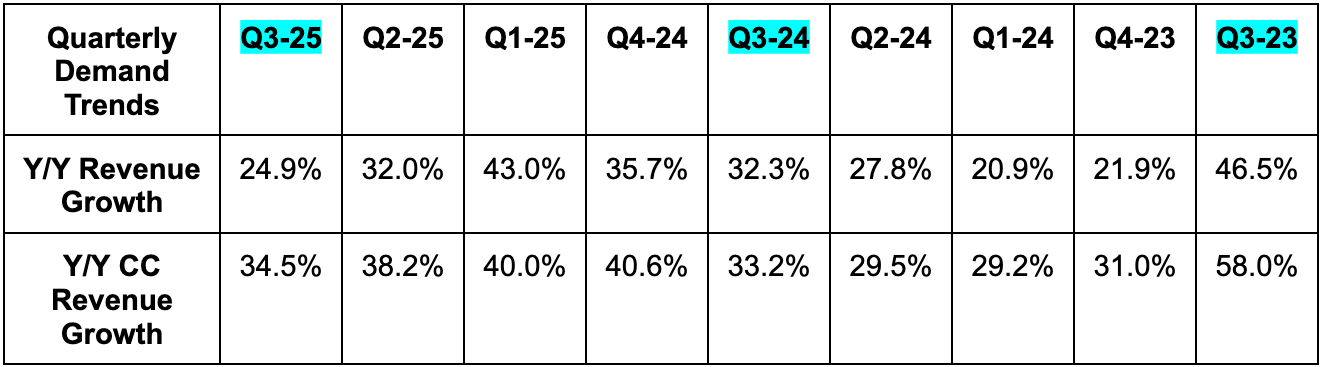
- Beat 28.5% constant currency (CC) growth estimates with 34.5% growth.
The sources of the 16% APAC beat were numerous, as this geography was the standout. Japan (their most mature market) is growing very nicely, while newer APAC markets are enjoying 100%+ Y/Y growth. For more context, holiday events in China delivered “incredible momentum” and exceeded internal targets.
Generally speaking, there was no dramatically over-indexing source of demand outperformance. Results exceeded internal expectations across every channel, geography and product category.
d. Profits
I realize "IFRS GPM" sounds odd, but for GAAP accounting companies, I call it "GAAP GPM" and "GPM" when it's adjusted. I wanted to keep formatting consistent for this IFRS-based company.
- Beat 60.6% IFRS GPM estimates by 310 basis points (bps; 1 basis point = 0.01%).
- Beat EBITDA estimates by 26.4%.
- Sales, general and administrative (SG&A) was 47.1% of sales vs. 46% Y/Y. They’re boosting marketing and store expansion while funding those incremental expenses without Y/Y margin contraction thanks to GPM gains.
- On’s investments in next-gen manufacturing capabilities and increasing usage of popular AI tools are already yielding some SG&A relief.
- Beat IFRS EBIT estimates by 39%.
- Beat $0.27 EPS estimate by $0.16. This is irrelevant, as it’s heavily, heavily tied to foreign exchange (FX) gains or losses. For context, the FX impact was -$6M vs. -$140M Q/Q & -$43M Y/Y. That helped comps a lot. Focus on the other metrics, which also look great.
- Year-to-date (YTD) operating cash flow (OCF) is down 28% Y/Y. This is related to 2025 FX headwinds. Excluding that, YTD OCF would be up 30% Y/Y. There has also been a $55M YTD comp headwind from adding inventory to support demand. If we also excluded this, OCF would be up 48% Y/Y.
- Q3 2025 CapEx was 2.6% of revenue vs. 3% Y/Y.
More Margin Context:
Lots to unpack for margins this quarter. Durable Q3 GPM tailwinds included:
- DTC mix-shift.
- Outperforming and fully priced sales.
- Growing economies of scale.
- Supply chain bargaining power.
- Investments in operating efficiency (like better distribution practices) bearing fruit.
Those are all sustainable positives. On the other hand, there were 3 temporary items that amplified the leverage in the chart below:
Hey Nerds! Earnings season discounts end this week. Upgrade to read the rest of this article, 40+ more reviews every season, my portfolio/performance and so much more.