1. Demand
Reference Note on exchange rate utilized: 1 Russian Ruble = $0.014
Ozon was expected to generate approximately $459 million in quarterly revenue. Quarterly revenue came in at $504 million beating these expectations by 9.8%.
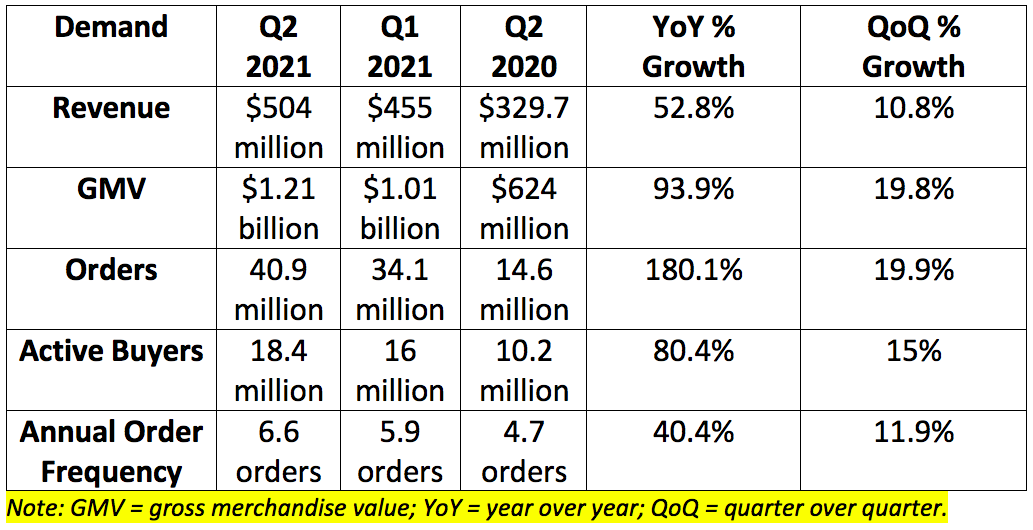
It’s important to note this quarter is comparing results to peak pandemic pain when Ozon’s business got a large demand boost. Despite this, it still produced rapid growth in all metrics.
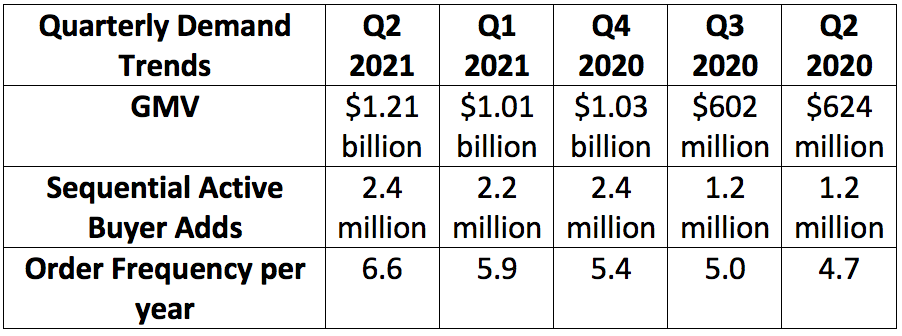
The accelerating order frequency amid an end to pandemic lockdowns is largely due to last mile logistics expansion and improvement.
Ozon’s seller footprint more than tripled year over year to pass 50,000. Roughly 1/3 of these sellers are already using Ozon’s tools for advertisers. Its marketplace now offers 27 million SKUs vs. 19 million sequentially.
2. Profitability
Note that Ozon calculates margins using GMV as the denominator rather than using revenue like most do. I calculated margins using revenue as the denominator, not GMV as this is closer to typical accounting standards.
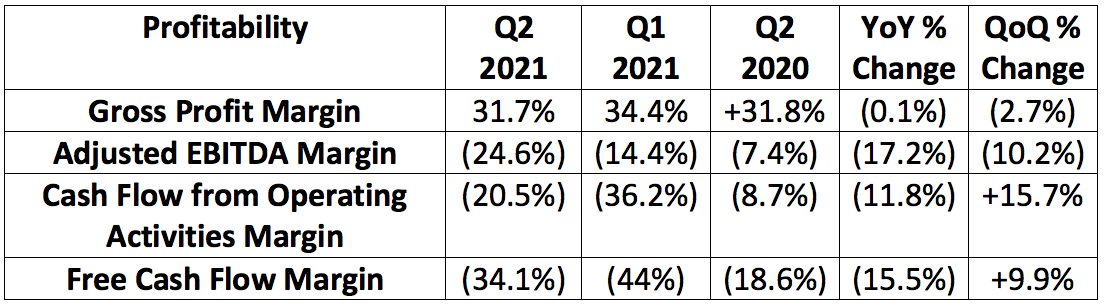
Falling EBITDA margin is mainly due to normalizing growth spend vs. the pandemic period. Still, marketing and general and administrative spend only saw modest increases as a percentage of total GMV year over year. The company will prioritize market share, growth and scale over short term profit margins.
The falling GPM was solely driven by Ozon lowering its seller commission to drive market share in the quarter (this worked better than planned). It does not expect to lower this commission any more going forward. The company anticipates that gross profit margin will move higher in the coming quarters as investments in growth come to fruition.
Competition is not driving the margin erosion. It is solely powered by the accelerating spend on growth and a lowered take-rate.
3. Guidance Updates
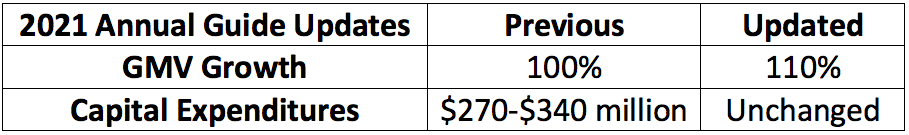
Ozon’s GMV growth guide was 90% as of the beginning of the year and despite the back-to-back raises it has maintained its capital expenditure outlook of between $270-$340 million. This is operating leverage in action.