

News of the Week (January 23 - 27)
News of the Week (January 23 - 27)
The Trade Desk; Meta Platforms; Shopify; Airbnb; SoFi; PayPal; Olo; Match Group; Market Earnings -- Microsoft, Tesla, Visa, ServiceNow & More; Macro; My Activity

Today’s piece is powered by Savvy Trader:

Welcome to the 436 new readers who have joined us this week. We’re delighted to have you all as subscribers and determined to provide as much value & objectivity as possible. This piece was too long to send via email in its entirety.
1. The Trade Desk (TTD) -- Google
This week, the DoJ and 8 states filed antitrust legislation against Google. The Trade Desk Founder/CEO Jeff Green -- in tandem with the filing -- released a fiery op-ed. I’ll cover the highlights of both here, their overlapping message and how The Trade Desk stands to potentially gain.
The DoJ complaints center on Google using its monopoly power to unfairly treat competition for its own ad-tech dominance. It specifically argues that Google is blocking fair ad placement auctions by “manipulating mechanics” to prevent fair and open supply side and ad-exchange opposition. It even accuses Google of forcing ad buyers to use its software by preventing an open bidding process.
I think it’s clear that Google is allowed to do too much in this space to be expected to behave fairly:
It controls the publisher impression selling process, controls the ad buying process AND controls the matching of these buyers and sellers. This creates an inherent conflict of interest where it’s incentivized to sell its own placements to buyers through its own exchange to juice unit economics of its advertising branch. It’s effectively preventing full access to publisher options and unfairly routing demand through its own software. This fosters an inefficiency that hurts a publisher’s ability to compete for ad demand and also leads to buyers paying more than they would in a fair market.
In Green’s words:
“Today, for a substantial percentage of online advertising impressions, Google controls the decisioning, the routing, the audit trail, the bid, and the ask -- seemingly playing the role as judge, jury, bailiff, prosecutor, defense attorney, and warden in many of the ad transactions they claim to be finding justice within… In many cases Google is even buying from Google on behalf of its brands.” –- TTD Founder/CEO Jeff Green
The Trade Desk -- as the largest open internet buy side ad tech company -- would stand to gain mightily from Google being reigned in. Its business model avoids conflicts of interest by working solely for the largest ad buyers in the world. It does not directly serve the supply side (although does allow publishers to plug directly into its platform via Open Path). This bias-less approach means its sole objective is to buy the highest value ads for its brands which means these brands know they’re being matched not with the best possible option for The Trade Desk… but the best option period.
If programmatic advertising is allowed to openly compete for business, what would that mean for The Trade Desk? Two things: First, it would provide the company many more publisher options to match demand with supply. Secondly, it would allow The Trade Desk to bolster the return on ad spend (ROAS) metrics it provides for its clients by eliminating Google’s ability to overcharge for impressions. Industry leading ROAS is the sole reason that The Trade Desk has consistently fetched a 20% take rate for the last decade -- this would help preserve or even bolster it.
This is not to say that The Trade desk needs any legislative help. It doesn’t… at all. Its execution, growth, margin expansion & market share gains have all been elite without the assistance, but a Google practices reset would still be good news.
As with all legislative news, any action resulting from the complaints is far from certain. But again, The Trade Desk will be just fine regardless. This is either good news or a nothing burger.
2. Meta Platforms (META) -- Data, TikTok & an Interview
While it seemed like bad news headline after headline was unavoidable for Meta in 2022, the reverse has been true thus far in 2023. Funny how that works.
First, on TikTok. Per research out of Citibank and Bank of America, Instagram has been taking time spent share from TikTok since August 2022. Specifically, the percentage of time spent on Instagram as a percentage of TikTok has risen from 77% then to 87% now. YoY engagement growth for both Facebook and Instagram have both also been sharply accelerating for the better part of the last 12 months, while TikTok’s has slowed to rates BELOW both Instagram and legacy Facebook. User growth for TikTok in December even turned slightly negative YoY. Meta is starting to win this battle for screen time and eyeballs as Reels ramps and its AI-based discovery investments gain popularity with audiences.
Further bolstering its position v. TikTok, , Senator Josh Hawley introduced a bill to ban the app across the nation. It’s unlikely that this specific bill would pass, but American regulation is clearly racing towards TikTok prohibition as several states have already banned it for public sector devices.
I’ve said it before and I’ll say it again: Now is Meta’s time to reassert its dominance. We’ve lapped the impact of Apple’s privacy changes. That YoY comp headwind slowed from 8% in early 2022 to 2.5% Q4 2022 and will turn into a growth tailwind in 2023 (per Meta’s Chief Marketing Officer Alex Schultz). Foreign exchange will soon revert back to a tailwind, green shoots on precisely identifying behavior patterns without Apple’s help to target ads are popping up, signs of competitive traction vs. TikTok are abundant, Reels monetization is maturing and WhatsApp monetization is ramping. All of these tailwinds are perfectly synchronizing to power what I think will be an aggressive comeback for Meta the company (and the stock). All eyes turn to its earnings report next week where I expect the tone to be much more optimistic than it has been in the past. We’ll see.
Miscellaneous:
Expanded its relationship with the NBA to create 50 new VR basketball games.
Meta is paying BuzzFeed to send content creators to the Family of Apps.
Savvy Trader is the only place where readers can view my current, complete holdings. It allows me to seamlessly re-create my portfolio, alert subscribers of transactions with real-time SMS and email notifications, include context-rich comments explaining why each transaction took place AND track my performance vs. benchmarks. Simply put: It elevates my transparency in a way that’s wildly convenient for me and you. What’s not to like?
Interested in building your own portfolio? You can do so for free here. Creators can charge a fee for subscriber access or offer it for free like I do. This is objectively a value-creating product, and I’m sure you’ll agree.
There’s a reason why my up-to-date portfolio is only visible through this link.

3. Shopify (SHOP) -- Price Hikes & Leadership
a) Price Hikes
Shopify substantially raised the price of its Basic, Shopify & Advanced subscription plans. Specifically:
Basic was hiked 34% to $39 per month.
Shopify was hiked 33% to $105 per month.
Advanced was hiked 33% to $399 per month.
If you listen carefully to Shopify leadership (& I never miss an interview or report), you will notice a theme of leadership calling its subscriptions “the best deal in commerce.” It frequently talks up “significant pricing power” and this is the first concrete sign we’ve gotten in a while of that pricing power being concrete.
Where does this pricing power come from? Two things. First is vendor consolidation. Shopify allows all important segments of operations to be run through 1 dashboard rather than several with manual, glitchy integrations stitching them together. Sidestepping these disparate integrations inherently fosters lower total cost of owning and maintaining a tech platform. Rather than forcing these hardcoded, cumbersome and time consuming integrations, Shopify uses its suite of light-weight, lightning fast APIs to power near-endless use cases & customization within its ecosystem. It augments this efficiency-building cohesion with automation tools to make merchants even more efficient and profitable.
This boost to business segment interoperability offers another interesting perk: When Shopify has data on customers and marketing tools in one place, or has merchant banking data to feed its credit issuance, it can do things like sharpen audience targeting or loan underwriting to make merchants more successful. These are just two examples of unique utility that trailblazes the evident pricing power we’re now seeing.
Finally, Shopify’s 10%+ share of U.S. e-commerce uniquely presents marketplace-like economies of scale via demand aggregation. Shopify uses this scale to pass on savings to merchants in areas from shipping, advertising, working capital access, interchange fees and more. And unlike other marketplaces, it offers these perks while letting merchants keep full control of their brand and data. Try doing that on Amazon
To gain a sense of the magnitude of these cost savings, , consider the following case studies:
Bombas saved 1% of revenue on platform costs with immediate return on investment (ROI) by switching from Magento to Shopify.
NYDJ lowered its total cost of ownership by 65% by migrating from the Salesforce Commerce Cloud to Shopify.
Doe Beauty saved $360,000 (2.5% of revenue) by switching from a custom build to Shopify
Staples saved 50%+ in platform costs by going with Shopify for its online store over the commerce clouds at Salesforce, Oracle and SAP.
Olly switched from a custom build to Shopify to save 1% of revenue ($60,000) in platform costs.
Duradry re-platformed from WooCommerce to enjoy a 30% increase in marketing efficiency.
Bike & Outdoor Company switched from a custom build to Shopify to lower monthly platform costs by 60%.
Skin Nerd switched from WordPress to Shopify to save $45,000 in annual app & developer fees.
Laird re-platformed from BigCommerce to Shopify to enjoy $60,000 in annual savings.
These are just a few examples. While these dollar amounts may not sound significant, the savings certainly move the needle for smaller merchants and dwarf the size of the Shopify fee increase. When you’re paying $5,000 per year or less for Shopify’s non-Plus plans, this tangible value equates to ROI metrics that are truly elite.
The hikes provide Shopify with a compelling choice: It can simply let the high margin subscription revenue flow down to the bottom line to bolster profitability. It could also use the funds to allocate to big projects it’s working on like Shopify Fulfillment Network.
And as a nice complement to this piece of news, Deutsche Bank upgraded Shopify this past week due to an accelerating pace of big brand migration and more market share gains. It called out many of the factors I discussed in last week’s issue. Maybe their analysts read my newsletter.
b) Leadership
After just 15 months in his role, CTO Allan Leinwand is leaving Shopify due to “personal reasons.” This marks continued C-suite churn for the company which is not devastating but also not a good sign.
4. Airbnb (ABNB) -- Cautious Note
Gordon Haskett downgraded Airbnb this week. I don’t care about the downgrade, but I do care about the reasoning. The firm sees 2023 and 2024 demand estimates as being “overly aggressive” and thinks they could fall unless trends in listings and occupancy rates improve from here. Selfishly -- considering this is a new position for me -- I would welcome a bit of stock price weakness that would accompany a modest demand guide as opening the door for building out my position.
5. SoFi (SOFI) -- Earnings Expectations
While some fintech stocks in my portfolio such as Upstart will likely continue to struggle until macro brightens more, SoFi should be just fine. Its customer cohort is quite affluent and consumer bank comps like Bank of America (which caters to a similar demographic) delivered stable results and a strong outlook. That bodes well for SoFi.
So? I expect more of the same rapid growth and margin expansion that we’ve gotten used to since this firm went public. Its top of funnel should be robust with its lofty APYs, its loan book health should be resilient based on high credit quality, its access to funds should be strong with the bank charter in hand and capital market funding supply durable, and Galileo’s/Technisys’s structural growth tailwinds should continue to blow.
Yes, the Student Loan Moratorium extension will be a 2023 headwind. But still, we’ve already been told by leadership to expect 35%+ growth with significant operating leverage regardless of if the moratorium lasts through the end of the year. Furthermore, it already overcame this headwind for the last 2+ years while the segment was a much more important contributor to results than it is today. What will the stock do post earnings? No clue. But I’m optimistic about yet another beat and raise for this company. I will cover the entire report on Monday.
6. PayPal (PYPL) -- Germany & Big Banks
a) Germany
Germany’s Cartel regulators filed claims against PayPal Europe to stop its alleged unfair limits on competition. The complaints center on rules preventing merchants from selling their products less expensively if its customers use a different payment provider. This news simply means an investigation will take place. Most of these investigations result in lengthy timelines and all bark, no bite. We shall see if this is any different. I will not be concerned about this unless it becomes much more advanced than it is today.
b) Big Banks
The banks behind peer-to-peer payment provider Zelle are now working on a digital wallet to compete with PayPal, Apple, Google, Block and others in the space. To be frank, I see tech giants and Cash App as a pressing risks for PayPal. Slick and function-rich technology is really not the strong suit of legacy banks. See Goldman Sachs’s Marcus as a recent example.
7. Olo (OLO) -- Large Brand
Olo landed Captain D’s and its 556 locations as its newest brand client. Importantly, the large chain is starting with four modules which is more than double an average client. Among the four purchased products is Olo’s newest module -- Olo Pay -- which quadruples its take rate per order. This budding product has consistently been part of new client wins. Not only is this more evidence that Olo Pay is gaining momentum with large brands… and not only will also be a decent boost to results… but it also shows that Olo is continuing to win in the Quick Service Restaurant (QSR) category which presents its largest market opportunity in the industry. Really good news.
8. Match Group (MTCH) -- Leadership Changes
New CEO Bernard Kim announced several Match Group leadership changes this past week:
Current CFO & COO Gary Swidler will be the new President & CFO of Match.
Will Wu is the new CTO (new role for Match).
He was the VP of Product at Snap where he “spearheaded Discover and Chat” before taking this position.
He will focus on “incubating, launching and scaling new features and technologies.”
Malgosia Green will move from CEO of Plenty of Fish to CEO of Match Asia (new role) where “she will oversee Pairs, Hyperconnect & Asia go to market.”
Hesam Hosseini will move from CEO of “Match and Affinity Brands” to the new CEO of “Evergreen and Emerging Brands” (new role).
Hinge Founder/CEO will now report directly to Kim. No role change.
Kim is still the CEO of Tinder as he continues to look for his replacement there.
Kim was a harsh critic of Match’s execution when he took over control of the company last year. Hopefully this team will execute more to his liking to foster the kind of success he delivered while running Zynga. His track record for building wildly successful app-based businesses is strong.
9. Around the Market -- Earnings Season
a) Microsoft (MSFT) -- FY Q2 2023 Earnings Snapshot
This Quarter’s Results vs. Expectations:
Missed revenue estimates by 1% & missed its guide by 0.4%.
Productivity & Business beat guidance by 1.2%.
Intelligent cloud beat guidance by 0.5%.
Personal computing (PC) missed guidance by 3.4%.
Beat non-GAAP EBIT estimates by 2% (GAAP missed by 3.8%).
Beat non-GAAP EPS estimates of $2.31 by $0.01.
Key Context
Azure grew 31% (38% FX neural vs. guide of 37% FX neutral) vs. 46% YoY (42% FX neutral).
Cloud Gross Margin expanded 200 basis points (bps; 1 bps = 0.01%) YoY as energy costs fell and its accounting structure was tweaked.
Its recently announced round of layoffs hit income statement margins during the quarter.
Headcount grew 19% YoY but that’s mainly via M&A as QoQ growth was < 1%.
Cash flow was hit as expected by a $2.4B cash tax payment (the result of a law change).
Balance Sheet Data:
Returned $9.7B to shareholders vs. $9.7B QoQ & $10.9B YoY.
Nearly $100B in cash, equivalents & investments & $44B in long term debt.
Next Quarter Guidance:
$51 billion revenue guide for next quarter missed estimates by 3.2%.
Also guided to Azure growth in the low 30% range.
$20.5 billion EBIT guide for next quarter missed estimates by 4.6%.
Notes from the Call:
CEO Satya Nadella told us that “organizations are exercising caution & optimizing cloud usage given macro uncertainty” and so Microsoft is “aligning cost structure with growth." He mentioned budding AI use cases as keys for making companies more efficient during these hectic times. Specifically, he pointed to ChatGPT’s rapid growth (where Microsoft just invested more to become the exclusive cloud provider) and how 200+ clients including KPMG are using the integrated solution.
PC demand was by far the most notable macro-related headwind. We are still comparing vs. the end of a large demand pull-forward and personal computing hardware is more cyclical than the rest of its operations. This was the source of the slightly underwhelming results & guide.
Some macro headwinds seem to be easing with foreign exchange headwinds set to slow from 500 basis points this quarter to 300 basis points next.
Product traction highlights:
Teams videoconferencing passed 280 million monthly active users & continues to take share.
80% of enterprise 365 customers now use 5+ applications.
Security customers using 4+ modules rose 40% YoY.
LinkedIn passed 900 million members.
Gaming passed 120 million monthly active users.
Apparently Bing “continues to take U.S. share.”
b) Tesla (TSLA) -- Q4 Earnings Snapshot
This Quarter’s Results vs. Expectations:
Beat $24.1B revenue estimates by 0.8%.
Missed $4.22B GAAP EBIT estimates by 7.6%.
Just beat EPS & GAAP EPS estimates.
Missed FCF estimates by 54% (inventory more than doubled YoY).
Missed 28.4% auto gross margin estimates by 250bps.
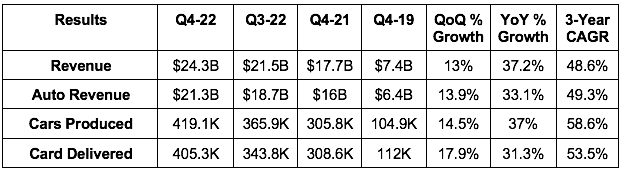
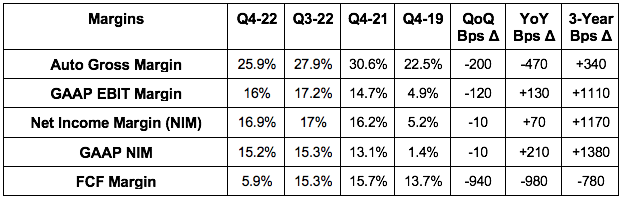
Key Context
The 48.6% 3 year growth CAGR compares to 50.5% last Q & 38.7% 2 Qs ago.
Inventory more than doubled YoY & grew 24% QoQ to outpace demand growth.
Full Self Driving (FSD) has been rolled out to all 400,000 North American Customers who have purchased it.
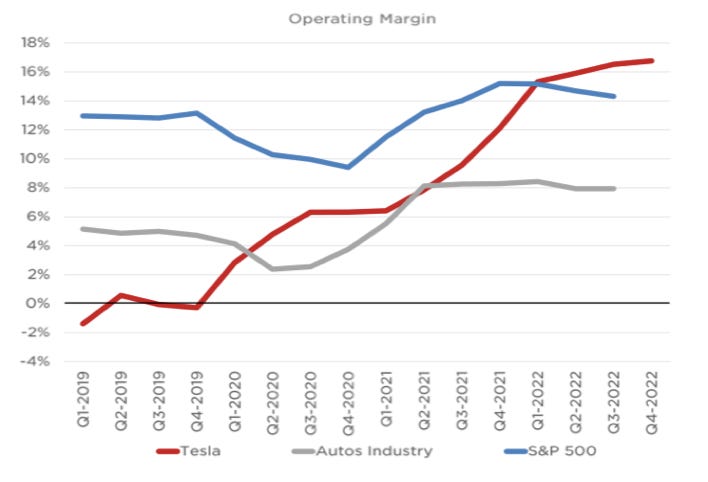
Tesla delivered 1.3 million cars in 2022 at a 17% operating margin.
Energy storage deployments rose 152% YoY with production still “in excess of supply.” Solar deployments rose 18% YoY.
Tesla’s insurance business is now at a $300 million annual premium run rate growing 20% QoQ.
Balance sheet
$22B in cash & equivalents.
$3 billion in debt ($1.5 billion is current).
Forward Commentary
Tesla reiterated its long term goal of a 50% delivery CAGR. I have to say, as an innocent bystander, that’s wildly impressive (unprecedented, really) at this scale.
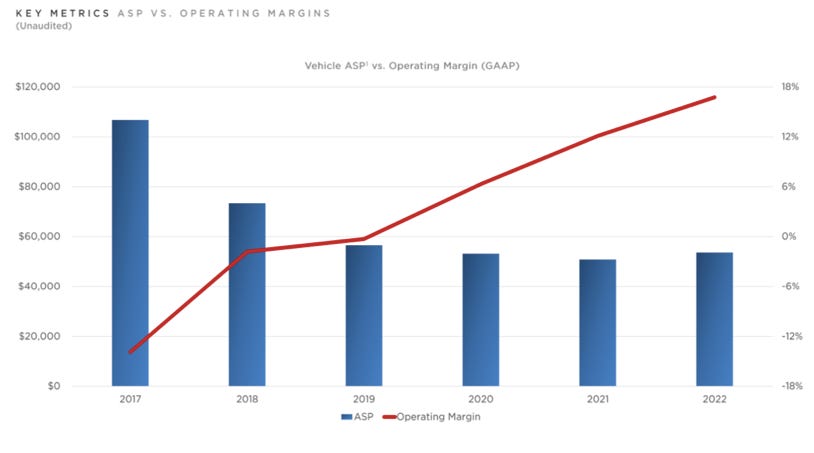
Tesla expects average selling price in 2023 to eclipse $47,000 with auto gross margin above 20% excluding leases & credits.
Cybertruck on schedule for 2023 production in the Texas giga-factory.
Its next batch of vehicle models is now “under development” with details coming at its March Investor Day.
Call Highlights
Musk -- in his typically charismatic way -- kicked off the call with a passage to assuage investor concerns about future demand:
“The most common question is on demand. I want to put that concern to rest. In January we had our strongest orders YTD ever. We are seeing orders at 2X the rate of production. Demand will be good despite any automotive market contraction."
The other pressing question was on the margin profile of these sales considering previous announcements of 20% price cuts across its newer models. Leadership told us to expect its best-in-class auto operating margin to continue in 2023 regardless of near term headwinds. The glass half full view is that price cuts were to secure EV credits and “because many people that want a Tesla can’t afford one.” The glass half empty view is that demand is lagging and this is a result of inventory glut. With “demand well ahead of production” that does not seem to be the case.
“As we thought about price changes a couple weeks ago, we looked at what the credit benefit to Tesla would be to make sure customers get the tax benefit.” -- CFO Zach Kirkhorn
Apparently (and somewhat surprisingly), 2023 is off to a better start than any year in Tesla’s history. As a result, Musk alluded to Tesla actually hiking prices on the Model Y for 2023; it also plans to raise battery cell production. With inventory more than doubling YoY, Tesla needs demand to remain robust… so far so good. Leadership sees this strong demand persisting despite expected auto industry pain in 2023.
Furthermore, Tesla’s average selling price has been falling for years while its operating margin has raced higher. The company has been able to more than offset added affordability with production efficiencies & automation:
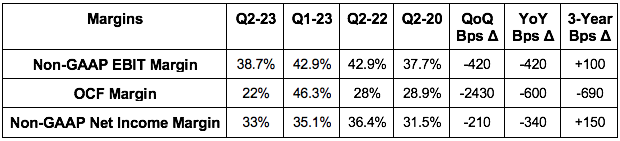
c) ServiceNow (NOW) -- Q4 Earnings Snapshot
This Quarter’s results vs. Expectations:
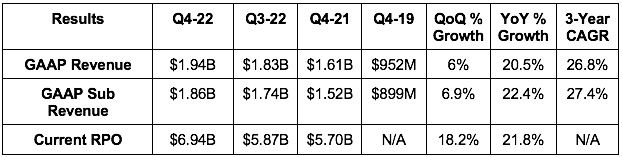
Met revenue estimates; beat its subscription revenue guide by 1%.
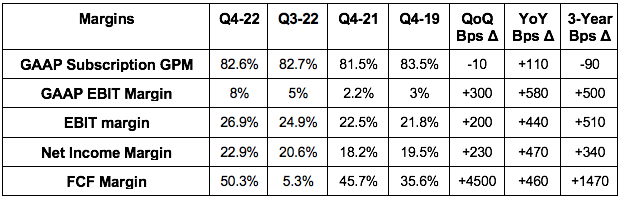
Beat EBIT estimates by 7.7% & beat its margin guide by 90 bps.
Beat its Current Remaining Performance Obligation (cRPO) guide by 1.3%.
Roughly doubled GAAP EPS estimates & beat EPS estimates of $2.02 by $0.27
Key Context
Foreign exchange shaved 550 basis points from revenue growth.
Net new annual contract value “outperformed company expectations” based on 30% net expansion with existing clients & also new logo strength.
The 26.8% 3-year revenue CAGR compares to 27.4% last Q & 28% 2 Qs ago.
Balance Sheet Data
$4.3B in cash, equivalents & short-term investments.
$1.5B in long-term debt.
Stock comp was 18% of revenue vs. 18.8% YoY.
Forward Guidance:
Q1 2023:
Guided to subscription revenue of $2 billion for 25% YoY constant currency growth. Analysts were expecting about 20% total revenue growth. Including a 300 basis point FX hit, ServiceNow’s subscription revenue growth guide (which is the vast majority of revenue) is slightly better than expected.
Its EBIT margin guide of 24% was in line with implied expectations.
2023:
Subscription revenue of $8.47 billion for 22.5% YoY constant currency growth. Analysts expected 23.5% total revenue growth including the foreign exchange hit. So this was slightly underwhelming vs. estimates.
A subscription gross margin of 84% which implies modest expansion vs. 2022.
An EBIT margin of 26% vs. 26% in 2022 & in line with analyst estimates.
A 30% FCF margin vs. about 29% in 2022.
About 1% diluted share count growth. Not bad.
Call Highlights
Chairman & CEO Bill McDermott treated his part of the call as a victory lap. He highlighted consistent “secular tailwinds of digitization that aren’t going anywhere.” CFO Gina Mastantuono added:
“Heading into 2023, we have prudently factored in the evolving macro crosswinds into our guidance. Overall, the demand environment remains healthy, deals are getting done, the market opportunity is growing, the ecosystem is expanding, our renewal and net expansion rates ended the year strong, our pipeline is robust.”
Mastantuono told us that these strong results for Q4 2022 were despite fewer early renewals which gives ServiceNow more low hanging fruit for up-selling in 2023.
In other news, ServiceNow & Zoom deepened their integrations, ServiceNow is embarking on a multi-year transformation of its partner program to “create new opportunities & incentives to collaborate with ServiceNow, and CJ Desai is the new President & COO of the company.
d) Mastercard (MA) -- Q4 Earnings Snapshot
This Quarter’s Results vs. Expectations:
Beat revenue estimates by 0.5%.
Beat EBIT estimates by 1.3%.
Beat $2.57 GAAP EPS estimates & $2.57 EPS estimates by $0.05 & $0.08 respectively.
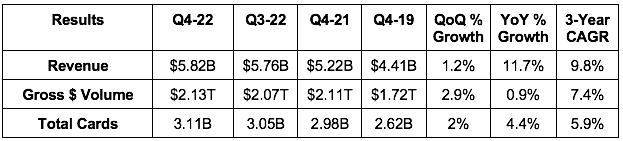
Key Context:
Foreign exchange reduced growth rates by 500 basis points.
Cross-border volume grew 31% YoY as international trade returns.
Its 9.8% 3-year revenue CAGR compares to 8.8% last quarter & 10.2% 2 Qs ago.
Quarter to date, processing volume growth accelerated from 8% in Q4 to 12% now. Cross border growth accelerated from 38% to 46%.
Balance Sheet Data
Returned $2.9 billion to shareholders vs. $2.1 billion last quarter.
$11.6B left on its buyback program.
$10.4 billion in cash, equivalents & investments & $13.8 billion in total debt ($274M is current).
2023 Guide
Guided to roughly 12%-13% revenue growth for 2023 -- in line with expectations.
FX is set to turn into a 100 basis point TAILWIND in 2023 as major currencies strengthen vs. the U.S. Dollar. This is great news for countless firms.
It also guided to roughly 9% OpEx growth implying modest margin expansion which was also roughly in line with expectations.
Call Highlights
CEO Michael Miebach used his time to talk up the “resilience of consumer spending” despite persistent macro challenges. He expects this resilience to continue as post-pandemic spending patterns have normalized. A consumer bellwether like this one expressing optimism on 2023 consumer health is good news for markets as a whole.
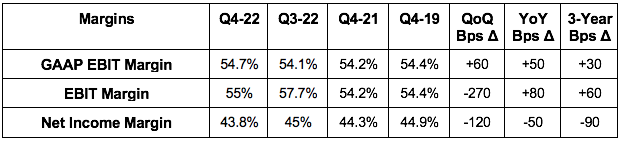
e) Visa (V) -- Fiscal Q1 2023 Earnings Snapshot:
This Quarter’s Results vs. Expectations:
Beat sales estimates by 3.1% (all segments beat minus data processing).
Beat non-GAAP EPS estimates of $2.01 by $0.17.
Beat non-GAAP EBIT estimates by 3.6% (EBIT margin was a 40bps beat).
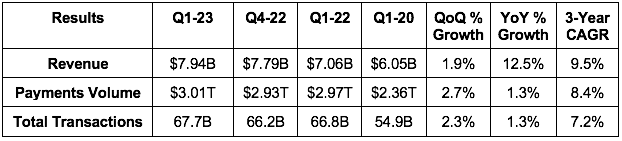
Key Context:
9.5% 3-year revenue CAGR compares to 8.3% last Q & 7.6% 2 Qs ago.
FX reduced revenue growth by around 300 basis points.
Volumes & processed transactions were “stable” while cross-border (with a larger take rate) “continued to recover.”
Balance Sheet Data:
Returned $4B to shareholders vs. $2.9B last Q & $4.9B YoY.
Has $18.9B in cash & equivalents; $20.5B in debt.
Forward Commentary:
For next quarter, Visa guided to “mid-teens” constant dollar revenue growth with a 200 basis point FX headwind & a 500 basis point Russia headwind. This implies roughly 8-9% YoY growth which is in line with estimates to perhaps slightly better. It also guided to slowing OpEx growth.
Call Highlights:
The tone of the call was strikingly similar to Mastercard’s. The company continues to assume no recession in 2023 amid “remarkably stable business trends.” Spend levels are running well above (40% above) pre-pandemic levels with that trend continuing on into this quarter. It has plans in place should the economy worsen further, but the base case is a healthy 2023 economy and consumer. Hello soft landing?
2 More interesting notes:
E-commerce spend is “well above the pre-pandemic trend line” even with the return of physical shopping.
Goods spending has weakened but services spending is picking up all of that slack & then some.
f) Verizon (VZ) Q4 2022 -- Q4 Earnings Snapshot
This Quarter’s Results vs. Expectations:
Beat analyst revenue estimates by 0.6%.
Missed analyst EBIT estimates by 3.5%.
Sharply beat EPS estimates with special tax benefits but met $1.19 EPS estimates without this help.
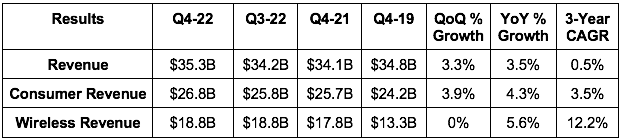
Key Context
Net income margin was boosted by special tax benefits & was 14.5% without any help here.
Total retail postpaid churn was 1.14% vs. 1.17% QoQ & 1.01% YoY.
This was impacted by Verizon decommissioning its 3G network during the quarter. This disconnected about 1 million consumers automatically.
Added 416,000 net broadband additions vs. 377,000 QoQ & 106,000 YoY.
This was its best net add result in 10 years thanks mainly to fixed wireless demand.
Verizon’s free cash flow generation fell from $19.3 billion in 2021 to $14.1 billion in 2022.
Balance Sheet Data
$2.61 billion in cash & equivalents with another $1.5 billion in net receivables.
$140.7 billion in long term debt with $10 billion of it being current.
Unsecured debt to EBITDA ratio is stable QoQ & YoY at 2.7X.
Verizon has raised its dividend for 16 straight years. The dividend grew 3.8% in 2022.
2023 Guide vs. Expectations:
Met $47.8 billion analyst adjusted EBITDA estimates.
Missed $5.00 analyst EPS estimates by $0.30 -- Verizon called this guide appropriately conservative on the call.
Guided to 3.5% YoY wireless service revenue growth.
Call Highlights:
Macro uncertainty remains “elevated” and demand for its service remains “strong.” This is not a cyclical business.
Positioned to “accelerate growth on a go-forward basis.”
Customer payment delinquency patterns remain “at or better than pre-pandemic levels.”
f) Intuitive Surgical (ISRG) -- Q4 2022 Earnings Snapshot:
This Quarter’s Results vs. Expectations
Met revenue estimates.
Missed EBIT estimates by 6.6%.
Missed EPS estimates of $1.25 by $0.02.
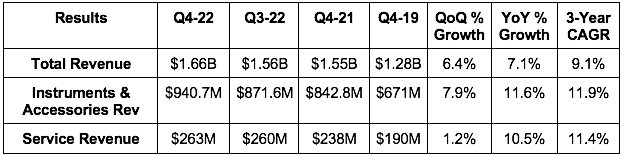
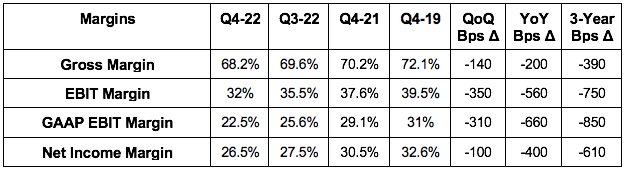
Key Context
Foreign exchange hit revenue growth by 290 basis points -- it was 10% YoY FX neutral.
Total recurring revenue rose 6.5% QoQ & 13% YoY.
It placed 369 Da Vinci Surgical systems vs. 305 systems QoQ & 385 YoY.
The YoY fall was blamed on “cautious capital spending” amid poor macro during the call. System utilization set an all time high to show how utility-rich the hardware is.
Year over Year Da Vinci installed base growth fell slightly from 13% last quarter to 12% this quarter.
Its install base is now 7,544.
Da Vinci procedure growth slowed from 20% YoY last Q to 18% YoY this quarter as more Covid-19 spikes in China slowed its growth in that region.
Effective tax rate was 14.7% vs. 19.4% QoQ & 15.7% YoY. This aided net income a bit.
Balance Sheet Data
Has $6.74 billion in cash, equivalents & investments vs. $8.6 billion YoY because:
It invested about $500 million in property plant & equipment.
Inventory rose 52% YoY to greatly outpace demand growth. Not ideal, but not awful as long as the trend doesn’t persist for several quarters.
There’s no debt on the balance sheet.
Bought back $1 billion in stock for Q4 vs. $1 billion last quarter; share count fell 1% in 2022.
2023 Guidance
12%-16% 2023 procedure growth with 9%-13% OpEx growth.
CapEx to rise from $530 million in 2022 to $900 million in 2023 as it builds out capacity in Bulgaria, Mexico & China.
Gross margin to fall from 69.2% in 2022 to 68.5% in 2023 due to “higher infrastructure investments & supply chain costs as well as mix shift to the newer Ion platform.”
g) Boeing (BA) -- Q4 2022 Earnings Snapshot
Quarterly Results vs. Expectations:
Missed revenue estimates by 0.5%.
Missed EBIT estimates of positive $904.2 million with a loss of $353 million; EPS similarly sharply missed estimates.
Beat its $2.5 billion free cash flow guide by 24%.
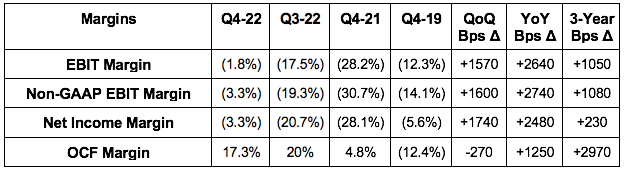
Key Context
Commercial:
152 deliveries vs. 112 QoQ & 99 YoY.
Backlog grew to $330 billion vs. $307 billion QoQ & $297 billion YoY.
Received 376 net orders vs. 227 net orders QoQ.
Commercial operating margin improved from (93.8%) to (6.8%) YoY.
Defense:
Defense backlog fell to $54 billion from $55 billion QoQ & $60 billion YoY.
Defense operating margin improved from (4.4%) to 1.8% YoY.
Global Services:
Global Services backlog is stable QoQ at $19 billion & fell from $20 billion YoY.
Global Services operating margin improved from 9.3% to 13.9% YoY.
Its Germany Distribution Center is now open.
2022 vs. 2021:
Boeing is still in negative EBIT margin & net income margin territory for 2022 just like in 2021. BUT, free cash flow did re-inflect positively from ($4.4) billion to $2.3 billion YoY. This was its first year of positive FCF since 2018.
Max return to service + 787 deliveries resuming helped mightily here along with a broader commercial traffic recovery.
737 MAX deliveries of 387 for the year beat its 375 plane guide.
Generated $2.3 billion in total 2022 FCF vs. burning $4.4 billion in 2021. Max & 787 return to service + the broader commercial travel recovery powered this.
Balance Sheet
$17.2 billion in cash & marketable securities.
$58 billion in total debt with $5.2 billion in current debt.
$78 billion in inventory.
2023 Guidance
Boeing reiterated its 2023 free cash flow guide of $3.25 billion.
Guided to 400-450 737 deliveries and 70-80 787 deliveries.
The 737 Max’s return to service in China is NOT part of this guide. It would present significant upside to its results but the timeline is very uncertain.
More Call Notes
The team was quite optimistic about forward-looking demand. CEO Dave Calhoun called demand across the entire portfolio “strong” both in the U.S. and internationally several times during the call. He sees Boeing as “very well positioned” heading into 2023.
“Recessions don’t get in the way because we’re competing for deliveries out 4 to 5 years from now.” -- CEO Dave Calhoun
h) Semiconductor Earnings this week
Intel’s (INTC) quarter was bad. It’s levering up to cover a dividend and now generating negative earnings while revenues plummet. This reminds me of Boeing in 2019 and 2020: A company with the odds stacked heavily in its favor that can’t seem to get out of its own way. While the Intel weakness has been greatly bolstered by micro-based challenges like AMD share gains, macro is hurting too. The PC market -- as we saw with Microsoft -- is weak and economic output data is slowing. Semiconductors are quite cyclical and tied to economic activity.
We did see sector-obstacles play out for other names in other parts of the industry like Lam Research, KLA Corporation and Advanced Semiconductor Materials Lithography (ASML) but they all seemed to fare better than Intel. ASML specifically guided to somewhat robust 2023 growth with the expectation that its demand rebounds starting in Q3 with “demand for the systems remaining strong.” Lam’s guide was a bit more disappointing, but it still expects positive growth in 2023 which was better than many industry experts feared. It did call out cautious customers, especially in its memory niche, but sees spend cuts as effectively offsetting that temporary demand headwind. It doesn’t expect the same 2H demand rebound that ASML is counting on.
10. Macro
Key Data from the Week
December Personal Consumption Expenditures (PCE) Data:
YoY Core PCE was 4.4% vs. 4.4% expected and 4.7% last month.
This is now roughly in line with the Fed Funds rate of 4.25%-4.50%.
Month over Month (MoM) Core PCE of 0.3% vs. 0.3% expected & 0.2% last month.
YoY PCE was 5% vs. 5.5% expected and 5.5% last month.
MoM PCE was 0.1% vs. 0.2% expected & 0.1% last month.
Bond Auctions & Yields:
The 2-year note auction closed at a 4.139% yield vs. 4.373% last month.
The 5-year note auction closed at a 3.53% yield vs. 3.973% last month.
The 2 year yield has now fallen 54 basis points from 4.71% to 4.17% in under 3 months.
The 30-year fixed mortgage rate continues to fall. It’s now 6.13% vs. 7.08% about 3 months ago.
Economic Output Data:
January Manufacturing Purchasing Managers Index (PMI) was better than expected at 46.8 vs. forecasts of 46.
January Services PMI was better than expected at 46.6 vs. forecasts of 45.
December Core Durable Goods fell 0.1% vs -0.2% expectations and +0.1% last month.
December Durable Goods Orders rose 5.6% MoM vs. 2.5% expected and -1.7% last month.
Q4 GDP was 2.9% vs. 2.6% expected
Consumer Data:
Initial Jobless Claims of 186,000 was better than expectations of 205,000.
December personal spending fell 0.2% MoM vs. -0.1% expected and 0.1% last month.
Michigan Consumer Expectations & Sentiment both slightly beat forecasts and improved MoM.
New Home Sales for December met expectations of 616K
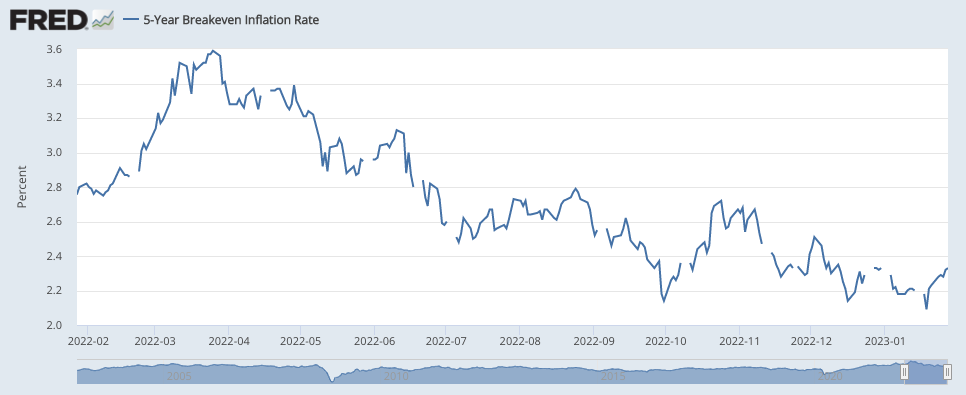
5 year breakeven inflation ticked higher this week:
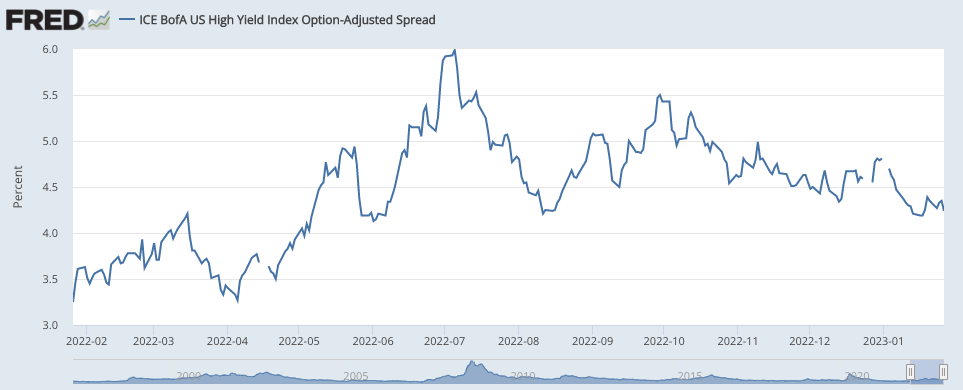
High yield option adjusted corporate credit spreads ticked lower (signaling better liquidity & risk appetite) this week:
b) Level-Setting the Data
The macro backdrop is playing out as I expected it to so far in 2023. Inflation is falling sharply (with the PCE data this week deepening that trend) while economic data is only modestly worsening. The faster pace of cooling inflation augers well for the Fed to avoid hiking us beyond a recession and into a depression. Frequent layoff news should continue to dampen that economic data and (as I’ve been saying) turn employment into the more fragile Fed mandate in the first half of this year. That frees the Federal Reserve to take a more cautious approach to rate hikes and I continue to expect a hike pause after the next meeting. I still expect a mild recession in 2023 as a base case. In that scenario, discount rates would stop rising and structural, profitable growth would become more scarce and more coveted. That’s a good environment for growth stocks.
11. My Activity
I trimmed 8% of my Shopify position this week. When I built out the new holding, I did so at a valuation I viewed as expensive but barely reasonable enough. Well? Since then it has gotten 50% more expensive. While I’m optimistic about its 2023, I still viewed that rapid rise as a great opportunity to take profits that I can hopefully reallocate back into the name if it takes a breather.
I always enjoy these. One of the reasons is that you do an excellent job of organizing the content. 😁