

News of the Week
News of the Week
Disney; Amazon; Uber; PayPal; Nike; Valuation Note; Accounting Note; M&A Note; Market Headlines; Portfolio

Today’s Piece is Powered by My Friends at BBAE:

1. Disney (DIS) – Sports and Parks
a) Sports (Includes Amazon)
I talk a lot about this: Live sports content rights are wildly expensive. Most of the top-watched content in North America is live sporting events, which illustrates the strong passion fans have for their teams. As a result, live sports as a category is the only remaining healthy part of linear TV. It is the last domino to fall in the cord-cutting revolution. The rest of linear is in obvious terminal decline. This will be too, eventually.
This situation puts Disney and its market-leading ESPN brand in a perfect position to control the remaining decay of linear television and transition to streaming. ESPN owns 30%-40% (depending on the source) of major sports rights in the USA and it will decide when to move those rights off of linear. That direct-to-consumer shift will likely come in 2024. This all sounds nice. It depicts Disney as being in a strong position, perhaps even the driver’s seat, to enjoy strong streaming market share as it pairs this asset with Hulu and Disney+. But there are two major issues standing in the way of this attractive scenario coming to fruition: money and distribution.
Again… Live sports rights are very, very expensive. For example, Disney will pay $700 million per year just for exclusive SEC college football rights. Disney’s balance sheet is clearly strong enough to outbid the Paramount’s and Fox Sports networks of the world. Today however, it needs to outbid wildly deep-pocketed mega-cap tech as well. Apple is bidding for more rights and Google secured NFL Sunday Ticket this year. The search giant has an appetite to invest more. Amazon is reportedly looking to accelerate investments across sports too. It would do so through an investment in Diamond Sports Group following that firm’s bankruptcy declaration. Diamond owns TV rights to 40 professional sports teams in the USA.
All three of these newer entrants can use live sports as a loss leader to reel in fans and cross-sell them other products and services. They don’t need to make money on these contracts; they can easily profit elsewhere and literally have tens of billions to spend. Disney needs to make money on these contracts and has less firepower to win them. That’s far from ideal. Yes, Disney has the omni-channel flywheel with its parks business to drive some cross-selling. Still, that flywheel pulls from its scripted entertainment and the beloved brands within that bucket – not from ESPN.
So? Disney needs to get ahead of this developing sports bidding war and partner up. And that needs to happen soon. I candidly find it annoying that the Diamond Sports news is coming before the ESPN news I want and expect to come. ESPN is still considered the defacto brand in sports and mega-caps still want their hands on it. That will not last forever as fans get accustomed to watching events on other streaming services. It is the reality today and a reality that Disney needs to urgently leverage before the value dissipates. The brand still has a temporary edge, which will not be an edge forever. They must partner with and sell a minority stake in ESPN to Amazon, Google or Apple to preserve any piece of that edge over the next several years. This will make winning content bids easier and less competitive for what is clearly the David and not the Goliath in this situation.
Mega-cap tech will also help mightily with the second issue of distribution. Disney loses consolidated distribution outlets as Xfinity and Spectrum become less popular. It loses that aggregated ecosystem of reliable traffic. How does it mimic that traffic? By partnering with mega-cap tech and their ubiquitous distribution networks. This will make nurturing an ESPN streaming brand far less costly, far less risky and likely more successful. I am impatiently waiting for news of a partial ESPN sale to come. Chop, chop.
b) Parks & IP
Disney got a lot of blowback from others for its plans to raise annual CapEx from $3 billion to $6 billion to support its parks and experiences segment. We already worked through why I think this is the correct decision. In summary, it pulls from a mere portion of the savings being generated in its film, administrative and general entertainment cost buckets. It shifts low-return investment dollars to this higher-return area. Simple enough. You can find more detail on the decision here.
This week, Disney announced a new Zootopia attraction in its Shanghai Park. For context, Zootopia is one of the top grossing animated films ever in China. Why do I bring this up? It points to all of the expansion opportunities Disney has within this sky-high return investment category. It shows exactly how this segment cannot just be a stable cash cow, but a reliably growing cash cow. Disney has about 1,000 acres of vacant land to develop (or 2 Disneylands) solely at its Shanghai park. It has significant brand power and pent-up demand for brands such as Zootopia in important markets like China. That’s why it’s opening and expanding Frozen, Avengers, Star Wars and Little Mermaid exhibits globally.
Much attention is paid to its media business, and for good reason. Linear is a dying business and streaming needs more time to help profitably supplant it. This other segment is a sleeping giant cloaked in the negative sentiment surrounding The Walt Disney Company. An expected explosion in FCF, streaming profitability and a needed asset reshuffling will all go a long way toward mending this sentiment. It should allow the Parks & Experiences segment to get the credit it deserves.
2. Amazon (AMZN) – Oh, Canada… Oh, AWS
Amazon’s AWS will open a second cloud infrastructure region in Calgary. This will unlock broader access to its cloud services including data analytics and its AI tools in that country. Whether it’s investments across Southeast Asia or North America, AWS remains firmly entrenched in expansion mode. Is this approach warranted and what does it mean?
Signs of greenshoots across cloud-computing have been broad-based. Azure (Microsoft) and AWS both put up strong quarters with outperforming demand and upbeat commentary. AWS further talked up workload (or usage) optimization shifting to a newfound appetite for incremental workloads. Most of the optimization AWS saw throughout 2023 “already happened” with optimization demand “attenuating.” Sales cycle elongation has also normalized across the large cloud providers, while AWS signed more deals in the month of September vs. the rest of Q3 as a whole. Jassy told us that this momentum would prop up growth through 2025. Oracle’s cloud struggled a little bit in Q3 while Google was more average, but AWS and Azure are the two titans. Both are enjoying brighter days.
There’s additional evidence for general cloud sector health. More niche cloud players like MongoDB and Snowflake, among many others, had strong quarters. Both companies rely heavily on usage and cloud-based revenue. As we’ve covered throughout this earnings season, usage-based revenue is easier to boost or cut than subscription-based revenue. So? The fact that cloud customers are leaning into what they can better control is another positive sign of the sector having found its footing.
Just a few months ago, analysts were panicking about AWS growth slowing to 11% Y/Y amid raging macro headwinds and very tough comps. Those headwinds were always going to ease considering how early we are in the on-premise to cloud migration our world still is. Customers cannot optimize workloads forever. They eventually become… well… optimal. Comps were also inevitably going to get easier and they have.
So what does this mean? We talk a lot about margin potential within the marketplace. There are many tweaks happening within Amazon’s cloud business to boost profitability. We cover them all extensively. While all of those tweaks are important, AWS’s acceleration is perhaps even more important. The majority of Amazon’s profits come from AWS despite just 16% of its quarterly revenue coming from that segment. More revenue here, with the 30% EBIT margin, would add fuel to the margin expansion wildfire as marketplace/fulfillment profit levers are pulled. The stars are aligning for Amazon’s 2024 profits to continue vastly exceeding expectations. That’s what I expect… just like I expected in 2023.

Looking for a better investment platform? Enter BBAE. The product speaks for itself. The Town Square copy trading tool allows you to emulate Wall Street’s finest. Its curated stock themes (under BBAE Discover) inspire new ideas, and its valuable technical and fundamental research tools guide you through key concepts.
BBAE is the broker dedicated to giving investors what matters to us. No gimmicks, no charms, no confetti, and never any pressure to trade. This is THE broker for long-term investors. Oh… and it’s offering generous deposit bonuses of up to $400. Check it out here. You’ll be glad you did.
3. Uber (UBER) – B2B & Japan
a) B2B
Uber is a consumer giant. It owns commanding market share positions across rideshare and food delivery throughout most of the developed world. It enjoys leading driver supply, 15 million loyalty program members (so lower marketing intensity) and verb status. But? It isn’t satisfied with merely being a consumer-facing transportation firm. Its sites are set far wider than that.
For review, Uber-for-Business is one of the firm’s many promising growth vectors. It’s a full service B2B offering that handles all employee transportation and meal costs for employee bases of large enterprises. It manages business travel, enforces spend limits in real time and offers meal and catering programs. It also boasts Uber One corporate membership options with added perks vs. the consumer subscription.
This week, Uber announced new receipt matching capabilities for Uber Business clients. It will offer this through new Brex and Ramp integrations to streamline expense reporting and organization. While this added layer of automation seems and is subtle, it’s just one tool in the expanding product kit. Uber for consumers laces more product breadth and utility into its product suite than competition can to drive engagement and retention. It makes sure consumers can get whatever they want whenever they want it through that program to reduce churn. It uses this base of retained users to greatly lower marketing spend per customer. This makes growth more efficient and its margin profile best-in-class. Now? It’s beginning to unpack this exact same playbook for enterprise customers. Not only should this drive broader traction for B2B, but it should also create top of the funnel delight for users who are new to Uber. That, in turn, could drive consumer-facing cross-selling. Another product lever. Another competitive differentiation lever. Another success lever. These things add up.
b) Japan
Japan is perhaps the most tightly regulated major market in ride-sharing and transportation. It’s illegal there to use a personal car to offer rides. Uber’s product suite is effectively limited to using the app to call for a taxi in some situations like airport travel. UberEats also functions there with leading market share. Japanese regulation has pretty much prevented Uber from winning any share of the $17 billion taxi market. Based on some rough calculations, for context, the UK taxi + ride-sharing market is worth about $20 billion. This is a large opportunity considering the UK makes up a high single digit percent of Uber’s total business.
The handcuffs will be removed in April. Prime Minister Fumio Kishida told the public this week that Japan will lift its ride-sharing ban next year. It will not become a free-for-all, but regulation will become significantly more relaxed. Uber has been spending time and money lobbying there for several years and it now seems like those investments will pay off and this could be huge for the company.
Starting in April, non-taxi drivers will be used to supplement taxi supply during demand spikes. These drivers will be supervised by taxi operators and must work under one. Uber works with many of the operators in the country. That should be step one. Kishida also told the public that he plans to sign another law next year that would remove this requirement and make Japanese ride-sharing wide open for business. Frequent taxi shortages in that country lead to sky-high fares for the service. Uber should be able to rapidly improve service levels by easing supply constraints, surcharges and wait times. There are some fierce competitors across Asian markets. Uber is a fierce competitor too. With its existing lead in food delivery, it is poised to lead in ride-sharing too.
In other news, Uber also received a favorable court order in France during the week. A $500 million anti-competition lawsuit with Paris taxi drivers was thrown out.
4. PayPal (PYPL) – Buy Now, Pay Later (BNPL)
I shared a PYMNTS study last week showing PayPal’s top share position for BNPL in the United States. This follows a consistent trend of 3rd party data pointing to PayPal BNPL being the most or among the most popular in North America. This week, given the light news cycle, I wanted to dig into what this success could mean for PayPal and why we, as investors, should care.
The first item is obvious. BNPL is very popular among younger generations. PayPal needs to do a better job of attracting younger consumers, and it has a clear edge within BNPL to make this product its top of the funnel generator. It’s important to keep in mind that BNPL is merely one tool in PayPal’s product suite. BNPL is not its entire business like for an Affirm or Klarna, but a small, small piece of its business. It has extensive customer data profiles entailing far more product touch points than with point solutions. It offers its consumers more, has existed for longer and so it knows its customers better than the rest. It has data on loan repayment, savings, broad credit chargeback history and more. Simply put, within BNPL, it has the largest and most relevant dataset. That matters a lot. Why?
It means its approval rate on BNPL transactions sits at roughly 90%. Depending on which data source we go with, for the industry as a whole, that approval rate sits around 70%-85%. More approvals mean happier customers and a more successful BNPL offering. Thanks to its extensive customer data profiles, PayPal combines this tangible advantage with best-in-class loss rates. Relatedly, delinquency rates for this specific credit bucket remain in great shape for the firm as well. This means the happier customers coincide with financially healthier merchants. These merchants (and PayPal) enjoy a 30% higher order frequency from BNPL users with 90% of the volume being additive, not cannibalistic to demand. This is because BNPL is used mainly for shorter-term and smaller purchases.
BNPL could provide a real source of separation from the pack in a checkout world that has been largely commoditized to date. PayPal’s brand does offer a material boost in the field, but this is surely a welcomed second factor. There’s one more demand boost that BNPL provides for PayPal. “Upstream Presentment” means showing PayPal checkout and BNPL options before the actual checkout page. When PayPal secures these placements, its checkout share meaningfully rises. The instances of winning these types of placements have predominately come from its BNPL segment.
Ok got it… so this is good for PayPal volumes and revenue, but what about margins? BNPL is also good news for margins. About 90% of BNPL repayment is done via debit sources. Debit-funded means higher transaction margin for PayPal vs. credit-funded. This is because it pays out less in 3rd party interchange fees to other financial service companies involved in the transaction. With transaction margin a key concern for the PayPal bull case today, this should provide some needed alleviation. Fattening up Braintree’s margins is sorely needed too, but we’ll take all of the margin tailwinds we can get here.
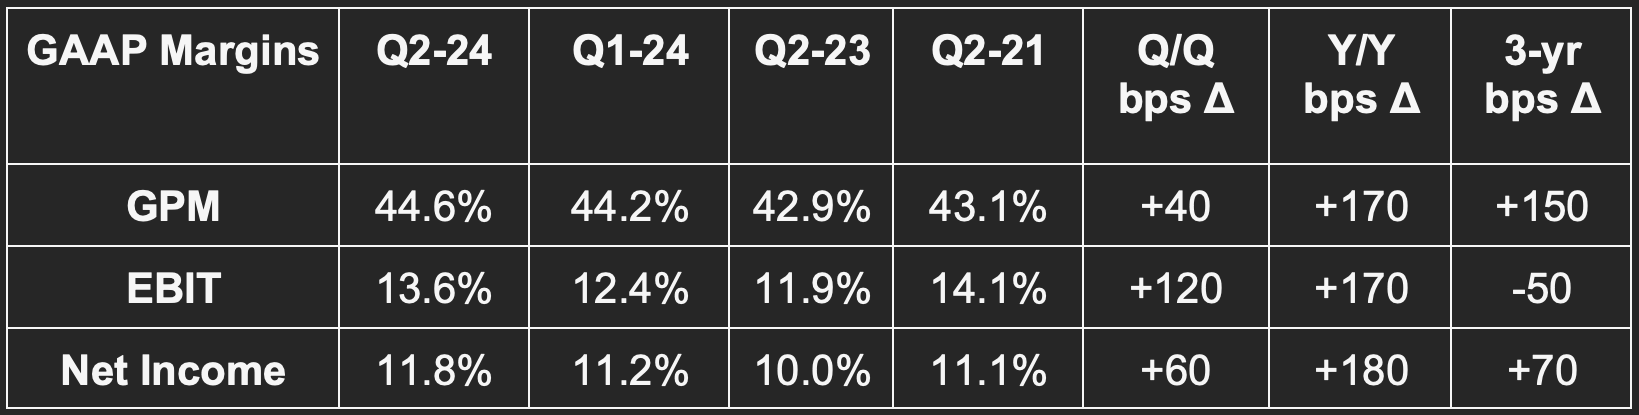
5. Nike (NKE) – Earnings Review
a. Results
Barely missed revenue estimates by 0.3% and roughly met its revenue growth guidance.
Beat gross margin estimates by 60 basis points (bps; 1 bps = 0.01%) and beat its margin guidance by 70 bps.
Nike comfortably beat EBIT estimates by 18.5%.
Beat $0.85 earnings per share (EPS) estimates by $0.18 representing a 21.2% net income beat. EPS rose by about 20% Y/Y.
Please note that Nike worked aggressively to liquidate inventory gluts throughout 2023. This makes for easier margin comps and tougher revenue growth comps in fiscal year 2024 (especially Q1 and Q2).

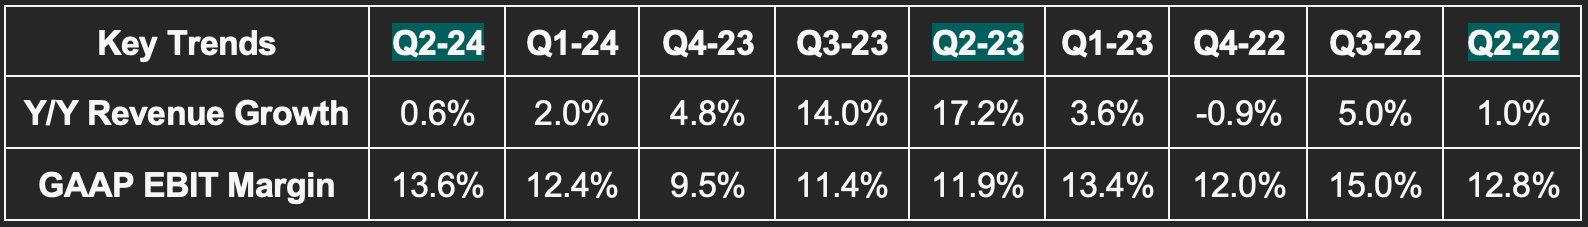
b. Full Year Guidance
Nike lowered its full year revenue growth guide from mid-single digits to 1% Y/Y. Analysts were hoping for 3.8% Y/Y revenue growth heading into the report. Unfortunately, selling, general and administrative (SG&A) growth guidance was not lowered alongside the revenue cut. It still expects SG&A growth in the mid-single digits for the year. It had previously told us that SG&A would be slightly lower than its old mid-single digits revenue growth guide. The lone bright spot of the guide was reiterated guidance of 150 bps of Y/Y gross margin leverage.
“Last quarter, I highlighted operating risks like a stronger U.S. dollar, consumer demand and our wholesale order books. Looking forward, the impact of these risks is becoming clearer. And as a result, we are adjusting our full year financial outlook.” – CFO Matthew Friend
c. Balance Sheet
$9.9 billion in cash & equivalents.
$8 billion in inventory represents -14% Y/Y growth as it right-sizes its inventory position like many other retailers have had to do.
Basic share count fell 2.4% Y/Y; Diluted share count fell 2.5% Y/Y.
$8.9 billion in debt (none of it is current).
$1.2 billion in buybacks with $10.9 billion left on its 4 year plan issued in June, 2022.
d. Call Highlights
On Results:
Nike blamed the poor guidance on a few factors. First is the highly promotional environment (especially in China and Europe) that it’s seeing across all channels. Nike is not willing to follow suit or “chase” that discounting activity. This is resulting in slower growth and the revised guidance and is why that happened while gross margin was reiterated. The competition is responding to a weaker consumer and more cautious spending with better deals. China was the most pronounced source of weakness here, but discounting overall is becoming sharper for many.
“We are seeing indications of more cautious consumer behavior around the world in an uneven macro environment.” – CFO Matthew Friend
This is making Nike’s products comparatively more expensive while the consumer feels less confident. That’s a large part of the weakness. Nike is still taking market share with strong 10% Y/Y holiday revenue growth and the firm is still seeing a larger portion of sales at full price as well as strength across its higher-priced items. The backdrop is simply heavily weighing on this company.
“Overall, we have maintained lower markdown rates than many of our competitors.” – CFO Matthew Friend
The second factor cited was simply execution-based. Leadership reminisced on the investments made in Nike Direct since 2019. It talked up the benefits of these investments, but also “added complexity and inefficiency.” These weak spots are being addressed through accelerated innovation and better consumer experiences. Another big piece of this will be pulling $2 billion in cost over the next 3 years from inefficient and redundant sources to plow back into its highest priority growth initiatives. It’s about a year late on this as most large caps have already begun cost-cutting. The company will look to drive savings via simplified product assortment, supply chain efficiencies and investments in automation.
It’s using this highly promotional environment to pull attention and supply away from current franchises to refocus on new franchises and consumer activations.
“The second half of fiscal '24 represents the start of a multiyear product innovation cycle that will introduce new franchises, concepts and platforms, elevating our full portfolio. And while there'll be some key moments in the second half, this new innovation cycle will take some time to fully ramp up, given our size and scale.” – CEO John Donahoe
Final Notes:
NIKE was the #1 sports brand on Tmall for China’s 11.11 event.
Jordan is “well on its way” to being the #2 footwear brand in North America. Jordan Apparel has grown at an annual clip of 20% since 2020.
e. Take
This quarter stands in stark contrast to the glowing demand commentary Lululemon’s team gave on their last call. Lulu did acknowledge China's headwinds, but confidently proclaimed how well they were overcoming that headwind and all others. I don’t think this is a matter of Nike underperforming vs. the pack as others in the space have dealt with similar issues. Nike is faring better than most… Lululemon is just special in my shareholder opinion. Nike continues to take share and continues to be the ubiquitous brand. It needs to improve execution and for consumer headwinds to fade like they soon will.
If you want to generate alpha in tech and growth stocks over the next few years, you have to look far beyond the Magnificent 7. Why? Because valuation matters, and most Big Tech stocks have become too expensive. "High Growth Investing” can provide you with fresh investment ideas and insight into a winning stock-picking strategy for public technology companies. The new Substack comes from Stefan Waldhauser, who is one of the most respected tech investors in Germany.
Stefan is a serial software entrepreneur and has been investing in technology stocks for 35 years. His work is of high quality. You can feel his experience as you read his investment stories, which are easy to digest. You don't need to be a techie to be a successful tech investor. If you want to learn more about investing in tech stocks - check out “High Growth Investing”, it’s completely free!

6. High Growth Valuation Landscape & Commentary
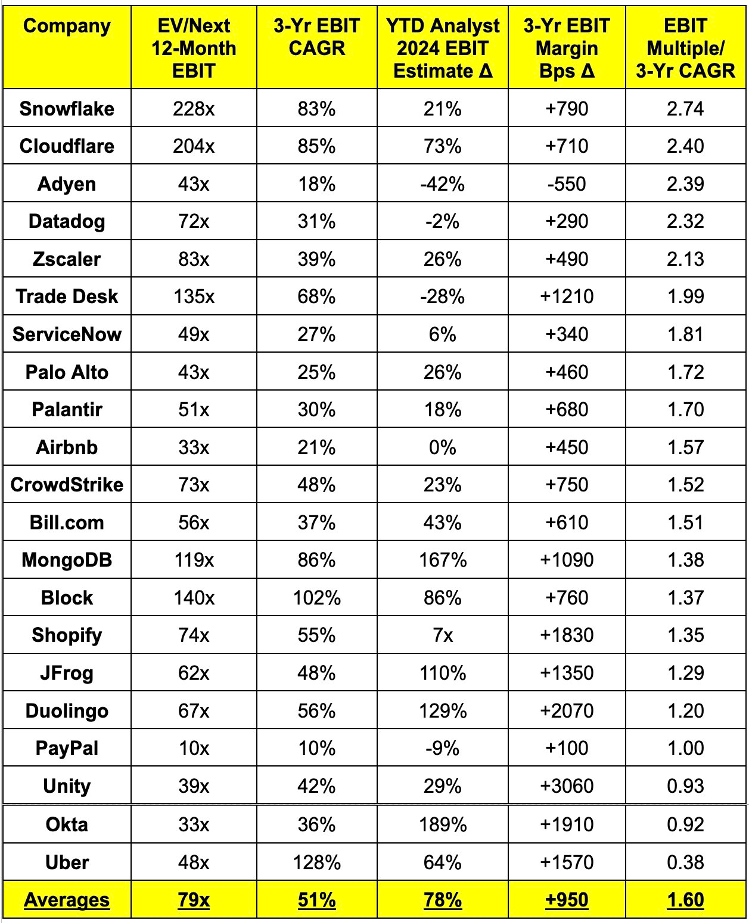
If you follow me closely on Twitter, you know that I like to post quarterly comp sheets comparing valuations of firms in similar stages of maturity. I wanted to share the most recent iteration of my EBIT comp sheet and compare how the averages have trended over the past year. I will be doing this quarterly going forward.
Across all 5 columns, things have gotten noticeably more expensive over the last 3 months. The EV/Next 12-Month EBIT category has expanded by about 5 turns with the others expanding materially as well. Why is this happening? Likely in response to rising expectations of an increasingly dovish Fed. As rate expectations fall like they are right now, expectations of future free cash flow discounting diminish. This makes $1 earned in FCF 5 years from now more valuable today than if interest rates (AKA discount rates) were to keep precipitously rising. Multiple expansion can be expected during easing cycles. Markets are always looking a few quarters ahead. They seem to be looking ahead to easy monetary policy, which was telegraphed in the last Fed statement.
Like in 2021, when hawkish policy commenced, things have recently changed. Don’t fight the Fed now means to own equities, while it has meant the opposite for the last nearly 2 years. So for me? This will mean widening the multiple expansion bands required for me to trim a position and shrinking the multiple contraction bands needed to justify accumulating. Things have gotten more expensive, and they’ll likely continue to get more expensive as we begin a new easing cycle. Candidly, things are a bit overheated right now and I’d love to see markets cool off for a few weeks. This is just me saying that if this occurs, the bar for accumulation has been lowered.
7. EBIT vs. Net Income: What to Use?
Light news weeks always offer a great opportunity for me to dig a bit deeper into accounting concepts. From the income statement, there are three profit metrics most commonly used to arrive at valuation multiples:
EBITDA or Earnings Before Interest, Tax, Depreciation and Amortization.
EBIT or Earnings Before Interest and Tax.
Net Income or Earnings (E). This is what is used in Price to Earnings (P/E) and Price to Earnings to Growth (PEG) ratios.
When should we use each of the three? First, if there’s no EBITDA then I use enterprise value (EV) / gross profit. If gross profit is negative, that’s an automatic non-starter for me personally. A negative gross margin shows that revenue can’t even cover input costs. It’s like a t-shirt vendor paying $5 for raw materials to sell a shirt for $4. It is very hard to fix that issue and turn a business into a profitable scaler from there.
Of the three that I do use, EV/EBITDA is my least favorite. I only use it if there’s no EBIT or net income. It does often offer a decent proxy for free cash flow generation by removing non-cash operating expenses (DA), but adjustments to this metric are highly flexible, widely ranging and occasionally adventurous. I’d rather just use free cash flow.
The main thing I care about is the operating profitability of a business. That is what EBIT represents. It gives me a view of how profitable an enterprise is in their day-to-day operations and is often my go-to profit metric. For this reason, I love using EV/ EBIT.
Still, I do prefer net income in some cases if there aren’t any weird accounting items to consider. That’s when I will use market cap/net income as my go-to valuation metric. For example, GAAP net income makes companies mark-to-market equity valuations on a quarterly basis. If, for example, Shopify’s stake in Affirm becomes less valuable during a quarter, that counts towards net losses. Other GAAP accounting items below the EBIT line such as differing Y/Y tax rates, some asset or M&A impairment charges, debt refinancing and more can all make GAAP net income quite noisy in a given period. In the absence of any items such as these, net income becomes my favorite income statement metric. It rewards cash-rich balance sheets via net interest income and penalizes levered balance sheets after accounting for interest expenses. EBIT doesn’t.
You’ll notice that I use enterprise value for the numerator for EBITDA and EBIT, but market cap for net income. Why? Enterprise value represents market cap + debt - cash. It gives an idea of total rights to profits between both shareholders AND creditors. Market cap only depicts shareholder rights to profits. Because EBITDA and EBIT are before interest expenses or benefits, we must use enterprise value to properly value the company. Because net income is below the interest expense/benefit line, we must use market cap.
One more note here. Some will argue that profit metrics shouldn’t be used until a firm is optimizing for that metric. So? If it’s spending most of its gross profit on growth, that will hit EBITDA and make it look more expensive. I don’t agree with this. I want companies to show operating leverage regardless of how mature they are. Economies of scale need to form. If that’s happening, in this example, EBITDA and EBIT growth will be in excess of revenue growth. I use valuation growth multiples to reward this very scenario. This takes a valuation and divides it by the growth rate of the profit metric used. I use multi-year profit CAGRs to minimize growth volatility. By doing this, firms investing heavily in growth, yet also showing leverage are rewarded as margins expand and profit growth accelerates. That operating leverage and faster profit growth will mean a cheaper valuation growth multiple. I prefer using this as an equalizer vs. refraining from using profit denominators from further down the income statement.
8. M&A
Warner Brothers (WBD) and Paramount (PARA):
Warner Brothers and Paramount are exploring a potential merger. The content space needs further consolidation. As discussed in the Disney section, cord cutting means content creators losing centralized linear distribution outlets. If streamers want their services to garner that same traffic visibility, there likely need to be fewer players with larger content libraries. This would be a big piece to move in that equation. Combining Paramount with HBO would create another content powerhouse in the U.S. and could potentially be these two companies fattening up their libraries and potential multiples on a potential sale to mega-cap tech.
Salesforce (CRM):
Salesforce announced plans to acquire Spiff. This is a sales commission software firm that automates and fully services these employer-employee transactions. It tracks commission data, predicts future commissions, designs incentive plans and streamlines this form of payment. The company is very small, so this likely wouldn’t be material to results. I was a bit surprised to hear this news considering CRM disbanded its M&A team to focus on organic growth. Still, the tuck-in nature of this small purchase makes the deviation from this guidance pretty unconcerning.
9. Market Headlines
Boeing (BA):
Boeing delivered its first 787 Dreamliner to China in about 4 years. China is a hugely important growth market for Boeing and Airbus. They don’t have the ability to make their own planes. They buy from the duopoly.
Enphase (ENPH):
Enphase will fire 10% of its workforce. The solar sector has been hard hit by the historically brisk pace of the now-ending tightening cycle.
Fed Bubble:
Pour one out for two of the largest Fed-bubble grifters in public markets. Nikola’s Trevor Milton, who pushed a truck down a hill and called it a legitimate demo, will get 4 years in prison. Bird, a scooter sharing company, is now worth about $2 million dollars vs. north of $2 billion during the bubble. It raised a half billion in public markets. Bird? More like woof.
10. Macro
Consumer & Employment:
Conference Board consumer confidence for December was 110.7 vs. 103.8 expected and 101 last month.
Initial jobless claims of 205,000 compared to expectations of 214,000 and 203,000 for the last report.
Michigan consumer expectations and Sentiment of 67.4 and 69.7 respectively both beat consensus.
Personal spending rose 0.2% M/M in November as expected. This compares to 0.1% growth last month.
Output Data Including Housing:
Building permits for November came in at 1.46 million. This missed 1.47 million estimates and compares to 1.50 million last month.
Housing starts for November came in at 1.56 million. This missed 1.36 million estimates and compares to 1.36 million last month.
Existing home sales for November came in at 3.82 million. This beat expectations of 3.78 million and compares to 3.79 million last month.
New home sales for November came in at 590,000. This missed expectations of 695,000 and compares to 672,000 last month.
The Philly Fed manufacturing Index for December was -10.5. This missed expectations of -3.0 and compares to -5.9 last month. Its employment index worsened M/M as well.
The most recent Q3 GDP revision came in at 4.9%. This compares to 2.1% last quarter.
Inflation Data:
5-Year Treasury Inflation-Protected Securities (TIPS) auction closed at 1.71% vs. 2.44% last auction as inflation concerns continued to ease and yields fall.
Core Personal Consumption Expenditures (PCE) rose 3.2% Y/Y. This is cooler than expectations of 3.3% and cooled vs. last month’s 3.4% reading too.
Core PCE rose 0.1% M/M. This is cooler than expectations of 0.2% and is stable vs. last month’s 0.1% reading.
PCE rose 2.6% Y/Y. This is cooler than expectations of 2.8% and cooled vs. last month’s 2.9% reading.
PCE rose -0.1% M/M. This is cooler than expectations of 0% and cooled vs. last month's 0% reading.
Michigan 1-year inflation expectations for December are 3.1% as expected. This compares to 4.5% last month.
Michigan 5-year inflation expectations for December are 2.9%. This compares to 2.8% expected and 3.2% last month.
This was another great week for the disinflation and dovish Fed hypothesis. Not only was the Fed’s favorite inflation reading (Core PCE) cool across the board, but the yield on the 5-year TIPS auction fell off a cliff while yields continued to cool.
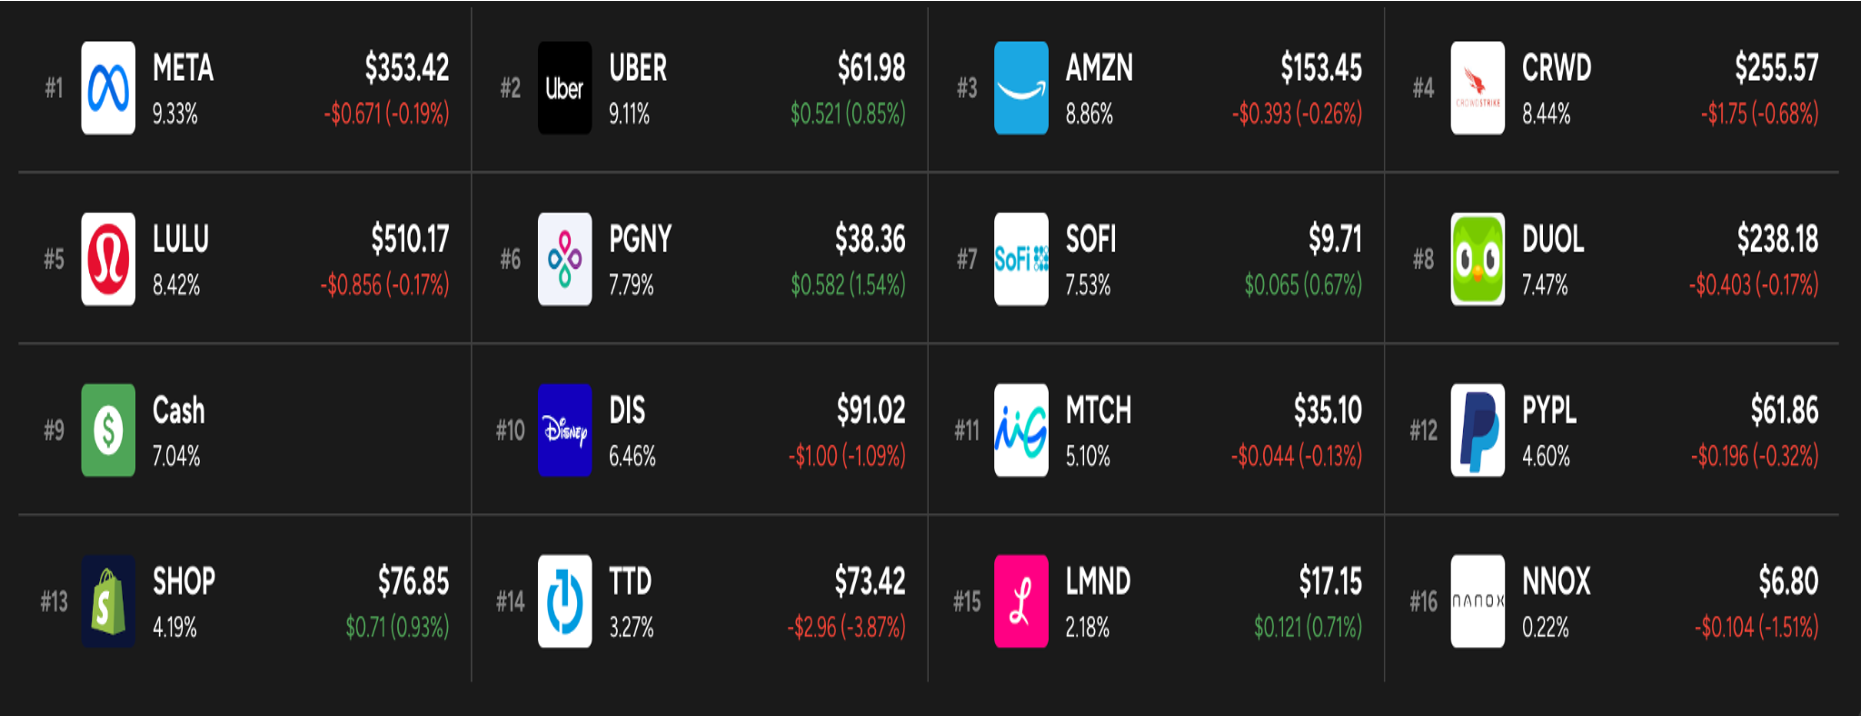
11. Portfolio
I added to Disney and Progyny during the week.
It looks like companies that look expensive using valuation metrics, doesn’t look so with with this exercise when adjusted for future growth like SHOP, MDB, DUOL, UBER < 1.50 ......is that the correct way to see it ?