

News of the Week (April 17 - 21)
News of the Week (April 17 - 21)
Airbnb; Uber; Lululemon; PayPal; The Trade Desk; Tesla; Netflix; Bank of America; Intuitive Surgical; Apple & SoFI; Datadog; Alphabet; Macro; My Portfolio

Today’s Piece is Powered by Savvy Trader:


1. Airbnb -- Starwood & Greystar
Airbnb is expanding its Airbnb-Friendly Apartments program to more landlords and buildings. This week, it announced the addition of Starwood Capital Group and Greystar Real Estate (2 massive landlords) to the initiative. The program involves landlords permitting renters to use their living quarters for Airbnb hosting on a part-time basis. Renters enjoy the added income, and landlords enjoy a powerful top-of-funnel for new renter demand by adding this perk. Airbnb will be displaying these buildings on its app for renters searching for apartments to lease. Considering its massive scale, this will be a demand driver to reduce both marketing spend and vacancy rates for landlords.
Many, many landlords do not allow short-term subleasing. That reality offers these participating players a real point of differentiation for attracting tenants. Specifically, nearly half of all renters pay more than 30% of their salary on rent. This makes secondary income streams like this one enticing -- especially as remote work and a nomadic lifestyle become more popular. To attract these landlords, Airbnb has created “visibility and controls” and “a framework to get landlords comfortable with this.” Its software ensures landlords always know who is hosting and how many guests are staying with easy enforcement actions to take against rule violators.
Airbnb is going very slowly with the rollout of this project to ensure it works perfectly for landlords. It wants to change the negative perception associated with short term rentals to one that centers on incremental revenue opportunities rather than added asset risk. Its insurance program works wonders in facilitating this as well. Today, Airbnb-Friendly Apartments covers 230 buildings across 38 U.S. cities with plans to grow from here and expand globally. If the initial launch goes well with Starwood or Greystar, there could be many more buildings to come from these two alone.
And According to Co-Founder Nate Blecharcyzk, there’s a large backlog of landlords ready to join. A short report published this month offered a main bear case that landlords would cut Airbnb entirely out of operations and vertically integrate the services. Well? Here we have two of the most capable landlords in the country turning to Airbnb instead.
2. Uber Technologies (UBER )-- Cannabis, Robots and Liquidity
a) Cannabis & Pets
In a world of perishable goods delivery, the cannabis delivery opportunity is a potentially lucrative extension of Uber’s operations. Federal regulation in the U.S. doesn’t allow for its participation today, but it’s legal in Canada -- and Uber is taking advantage. This week, it announced a new partnership with a popular cannabis marketplace called Leafly. I guess this is Uber’s way of saying Happy 4/20.
Between Leafly and Weedmaps, these two companies essentially own the e-commerce shopping space. And now Leafly will merge this market power with Uber’s leading delivery capability. I’m bullish on the cannabis opportunity for Uber as regulation continues to open up. The timeline there is about as unclear as things get, but legalization in the U.S. is a “when not if.” 68% of all Americans (and a majority of both wings) support it.
Uber Eats also added PetSmart and its 1,600 locations as a store delivery option this week. The Eats segment is fixated on allowing consumers to have whatever they want as fast as they want. Both of these news releases are part of building out that vision.
b) Robots
Uber and a robotics delivery company called Cartken are expanding a newer partnership. With Cartken’s technology, Uber Eats consumers in Fairfax County’s Mosaic District in Virginia can have goods delivered by autonomous robots. Autonomy will be a massive piece of Uber realizing its full margin and service quality potential. Drivers are expensive and unpredictable; robots are cheaper and fully controllable. I know this sounds insensitive to the drivers who will ultimately be displaced, but it is a reality.
Uber is already morphing into a cash printer before our eyes through needed cost base rationality and tighter focus/execution. Autonomous delivery would be another large margin augmenter.
c) Russia
Uber has officially exited Russia. It sold its remaining stake in Yandex.Taxi to Yandex for $702 million. Uber entered the market in 2017, sold off its delivery equity in 2021, and finished the liquidation process this week.
Between this and the $400 million created last week via selling part of its Careem business, Uber has added over $1 billion in cash to its balance sheet. The rumored spin-off of its freight business would add even more. As it inflects to profitability, its balance sheet continues to look healthier and healthier. It still has a few billion in investments that it could liquidate if it so chooses… but there’s no pressing need for any sales today.
Savvy Trader is the only place where readers can view my current, complete holdings. It allows me to seamlessly re-create my portfolio, alert subscribers of transactions with real-time SMS and email notifications, include context-rich comments explaining why each transaction took place AND track my performance vs. benchmarks. Simply put: It elevates my transparency in a way that’s wildly convenient for me and you. What’s not to like?
Interested in building your own portfolio? You can do so for free here. Creators can charge a fee for subscriber access or offer it for free like I do. This is objectively a value-creating product, and I’m sure you’ll agree.
There’s a reason why my up-to-date portfolio is only visible through this link.

3. Lululemon Athletica (LULU) -- Mirror
Lululemon acquired Mirror for $500 million during the heat of the pandemic. Stay at home orders fostered a remote fitness boom which Mirror greatly enjoyed. Like for Peloton and others, the end of the pandemic conversely led to a sharp mean reversion in demand.
To combat this, Lululemon has been shifting its subscription and fitness content partnerships to a more software-heavy approach which doesn’t rely on Mirror hardware as an access prerequisite. It also took a $442 million goodwill impairment charge (nearly 90% of the original purchase price) as part of this pivot. Customer acquisition cost (CAC) for Mirror users is simply not compelling enough to keep investing -- it’s throwing good money after bad and weighing on Lulu’s overall margin profile.
The newfound hardware independence allowed its “Essentials” loyalty program tier to boom in membership growth; in just 9 months it has 9 million members. Notably, this program involves zero access to discounted products. It only offers early access and a few other perks which is clearly all Lulu needs to do to sharpen its customer engagement by a full 9%.
“Since our acquisition, the at-home fitness space has been challenging. While members love our content, hardware sales did not match expectations. As we continue to invest prudently in this business, we are evolving the model from being focused on hardware-only to offering content through a digital and app-based solution. We think the lower cost of entry will allow us to more easily migrate and attract guests into it.” -- CEO Calvin MacDonald
This past week, rumors swirled around Lulu exploring a sale of Mirror once and for all. Candidly, I don’t really care what the price tag would be on this transaction. Liquidating it for whatever Lulu can get and removing the fixed expenses from its cost base is the right decision. To me, leadership liquidating the asset would mark its willingness to right a previous wrong rather than doubling down. In hindsight, the purchase was a mistake and there’s no need to compound the blunder. Hydrow is rumored to be an interested buyer.
4. PayPal (PYPL) -- Case Study
Seguros Caracas is a large insurer in Venezuela. It wanted to add the ability to receive payments in U.S. dollars, needed to raise buyer confidence and wanted to responsibly juice its approval rate. PayPal allowed the customer to raise volume by 189% and boost approval rates by 13% using its underwriting models.
5. The Trade Desk (TTD) -- Magnite
Magnite is looking to cut demand side platforms (like The Trade Desk) out of the programmatic advertising equation. With a new product called ClearLine, publishers will gain direct access to advertisers with a direct data channel as well. The Trade Desk has been making similar moves with its OpenPath product which allows clients to perform key supply side tasks like yield management on their own. Supply side and demand side ad platforms continue to slowly converge. I think The Trade Desk is in a better position to raise wallet share than supply side players like Magnite. Its services are less commoditized which is why its take rate is so much higher than other supply chain pieces. Its scale and partnerships with essentially all relevant ad buyers while it delivers superior ad returns by cutting booking costs in half makes it difficult to displace.
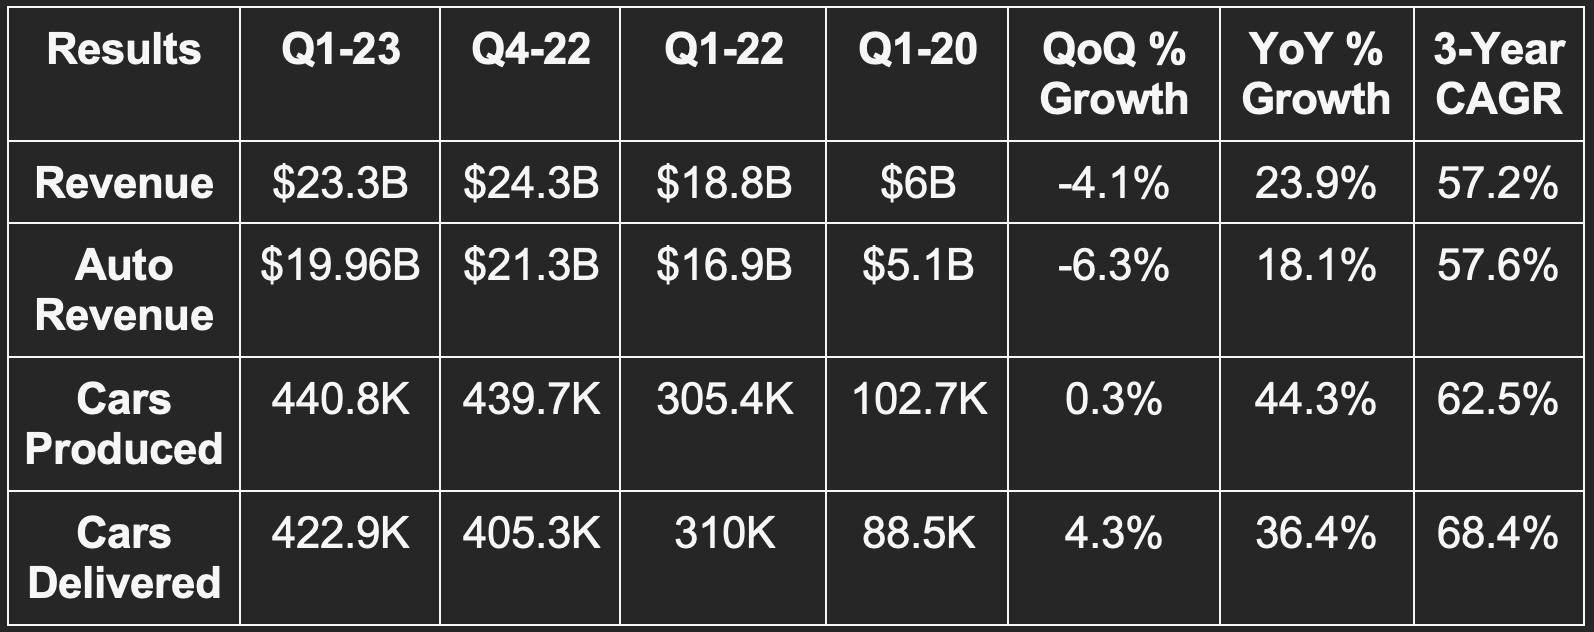
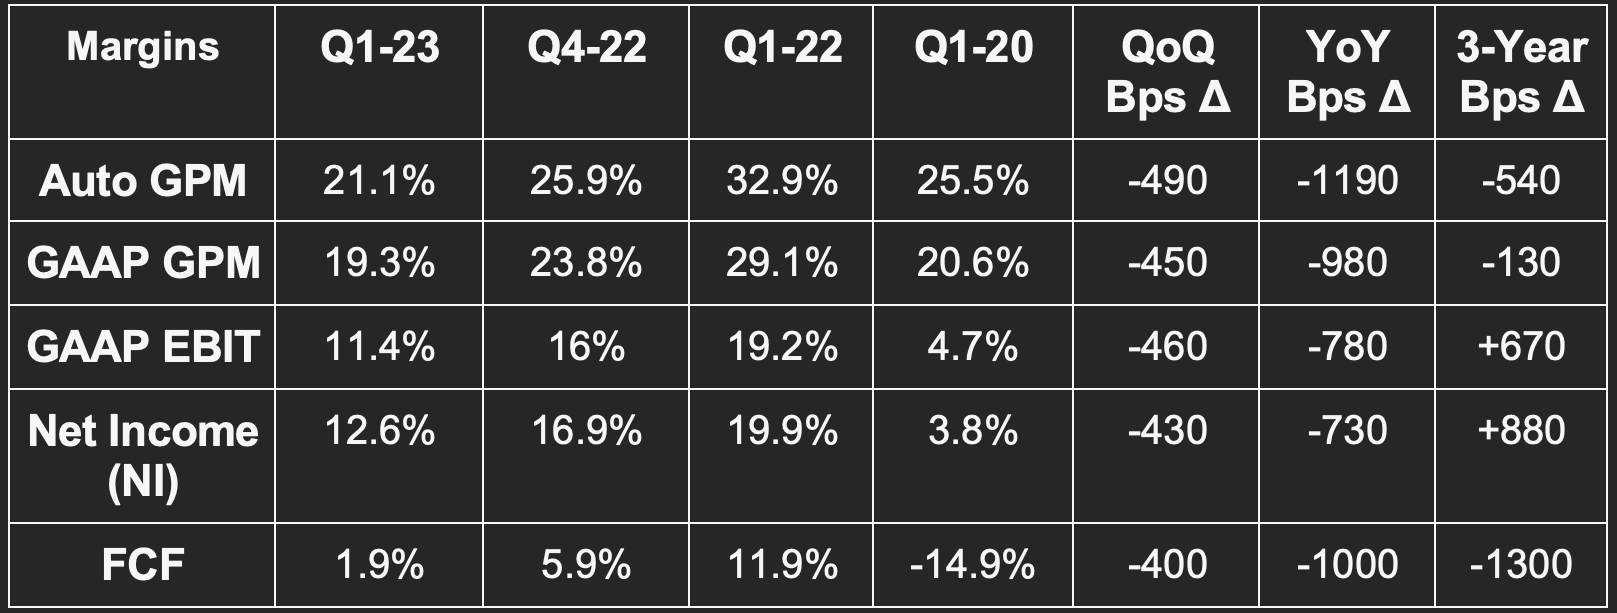
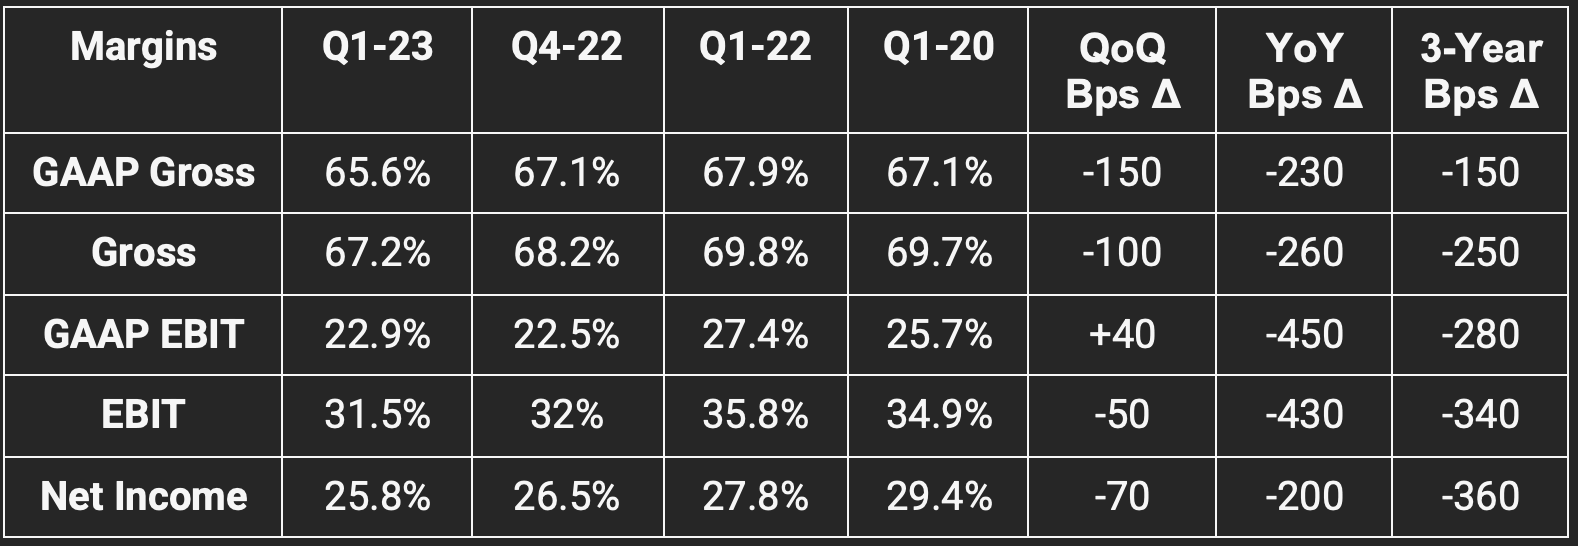
6. Tesla (TSLA) -- Earnings Review
a) Results vs. Expectations
Met revenue estimates.
Missed EBIT estimates by 6.5%.
Met GAAP & non-GAAP EPS estimates.
Sharply missed FCF estimates by nearly 90%.
Missed GAAP GPM estimates by 140 basis points (bps).
Missed auto GPM estimates by 190 bps.
It also slightly beat both production & delivery estimates as reported last week.
b) Forward Guidance
Tesla reiterated its long-term guidance of a 50% volume CAGR and among best-in-class auto EBIT margins. It also guided to 1.8 million vehicles produced for 2023.
c) Balance Sheet
$22.3 billion in cash & equivalents.
$1.5 billion in current debt.
2% basic share count growth YoY.
Inventory rose by 12% QoQ and 115% YoY.
d) Letter & Call Highlights
Tesla’s 3-year revenue CAGR sits at 57.2% vs. 48.6% last quarter and 50.5% 2 quarters ago.
Macro, Pricing, Margins & Production:
Leadership spoke on macro headwinds as providing a “unique opportunity” to grow the company’s production efficiency and share leads over incumbent car makers. It “aims to leverage its position as a cost leader” to accomplish this with continued focus on cost optimization. Projects like vertically integrating controllers and opening its charging network to other EV makers are examples of how it can cut costs while extracting more value from its investments. Still, price cuts this year have lowered Tesla’s 20% auto GPM ex-credits floor for 2023 according to CFO Spencer Neumann.
More sources of cost efficiencies expected via:
Ramping the Austin and Berlin factories to full capacity.
One time warranty adjustments on older models not recurring.
YoY impact of higher deferred revenue from autopilot features normalizing.
“The beginning of some commodity cost reductions.”
New 4680 cell battery announced at its investor day requires 70% lower CapEx per gigawatt hour than older models at scale. This will be a large boost to free cash flow.
Considering OCF was $2.5 billion with $2.1 billion in CapEx leading to just $400 million in FCF, this matters a lot.
Structural pack battery design comes with 50% less CapEx needs and ⅓ of the factory footprint needs of older models.
Larger cell capacity also means more range and higher energy efficiency (for lower cost).
The opening of its lithium refinery in Corpus Christi is set to reduce cost and “produce a byproduct that can be repurposed in construction” as an added layer of efficiency. Tesla DOES NOT WANT to be doing this itself. It’s doing it because nobody else is fulfilling the need.
Notably, Tesla continues to favor production volume and deliveries over optimizing the margin profile. It’s willing to “lay the groundwork today” by selling cars at lower margins and “harvesting more margin” as autonomous driving and software upgrades unlock recurring revenue streams. This willingness also makes Tesla inherently more difficult to compete against. It also could foster an inventory glut over time. Inventory levels are already elevated, but importantly, Elon told us that “orders remain in excess of production.”
“Near term pricing considers a long-term view on per vehicle profitability given the potential LTV of autonomy, supercharging, connectivity and service.” -- Elon
Free cash Flow:
“Q1 was our third quarter in our plan to move to a more regionally balanced mix of build and deliveries. This results in lower deliveries and production within a quarter due to a higher volume of cars in transit at the end of the quarter and has an associated impact on quarter-ending free cash flows. This was particularly prevalent in Q1 for S and X as we began exporting cars for international deliveries.” -- CFO Spencer Neumann
Auto Business Updates:
Model Y was the best-selling vehicle of any kind in Europe during the quarter and the best-selling non-pickup in the USA.
Cybertruck deliveries are on track to begin this year.
4,947 supercharger stations this quarter vs. 3,724 YoY.
Launched auto sales in Thailand to a “very positive reception.”
Thinks it will get to 2 million cars produced this year if macro cooperates and 1.8 million if it doesn’t (which is the base case).
Non-Auto Revenue:
Energy storage production capacity at its factory in California is ramping nicely with it now working on opening a new energy storage plant in Shanghai.
67 solar megawatts generated vs. 100MW QoQ & 48MW YoY. The sequential decline was a result of “volatile weather and supply chain challenges.”
Energy storage deployed of 3,889 megawatt hours vs. 2,462MW QoQ & 846MW YoY. It will eventually include production and delivery metrics from storage alongside its quarterly auto disclosures.
Storage and energy generation businesses are expected to carry a “mid 20%” gross margin at maturity. Neither are there yet but both are progressing nicely.
It continues to open up its charger network with 50% of its Europe stations now open to all EV types.
Dojo:
Dojo is Tesla’s supercomputer project being built to season its AI models. Leadership assured us that while it continues to buy computing capacity from Nvidia in large amounts, it’s also investing heavily on vertically integrating this need. It thinks Dojo could eventually benefit from lower cost of training models by an “order of magnitude.” Tesla wants to eventually sell the service as a white-label tool. Importantly, Elon still sees the success of this project as a “bit of a long shot” but with the potential reward making it worth the bet.
Full Self Driving (FSD):
“I hesitate to say this, but I think we’ll do FSD this year.” -- Elon
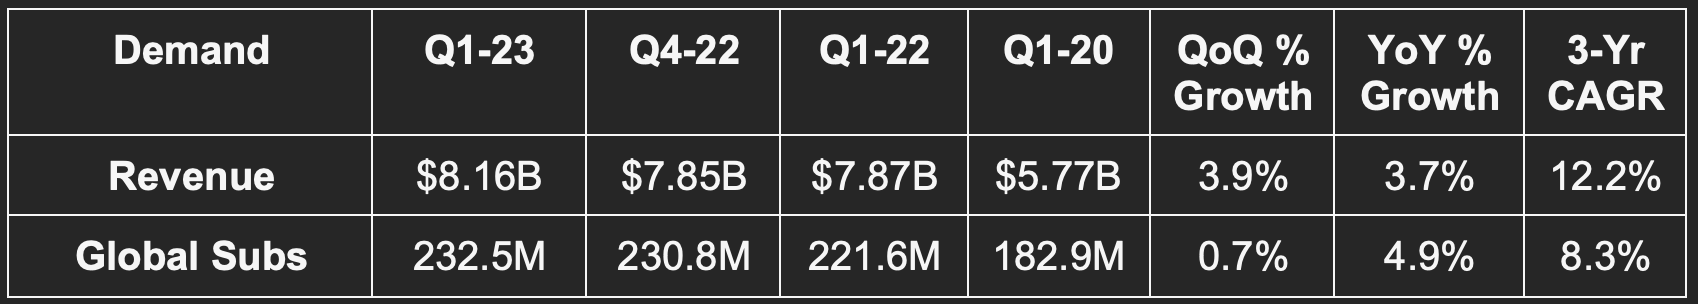
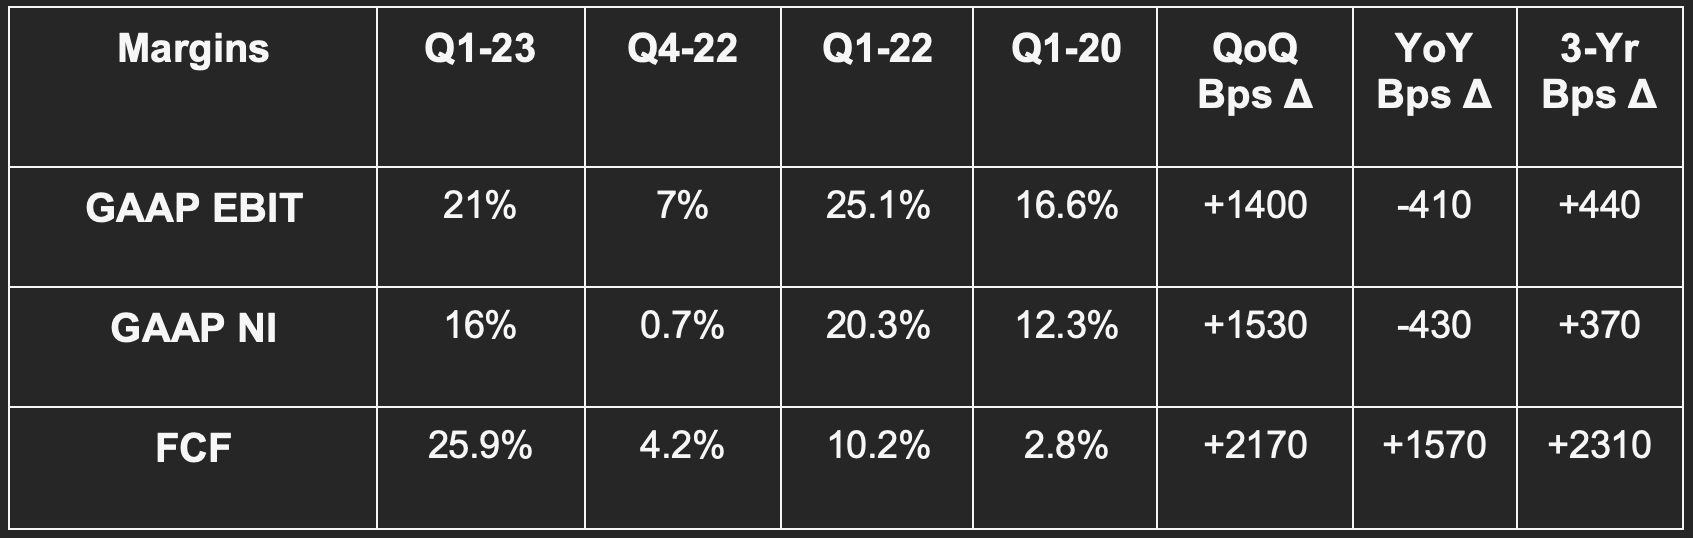
7. Netflix (NFLX) -- Earnings Review
a) Results vs. Expectations
Missed revenue estimates & missed its identical guide by 0.2%.
Beat EBITDA estimates by 1.2%.
Beat EBIT estimates by 4.3% & beat its guide by 5%. While Netflix guided to a 20% EBIT margin it posted a 21% margin.
Beat $2.87 EPS estimates by $0.01 & beat its $2.82 guide by $0.06.
Obliterated $782M FCF estimates with $2.11B in FCF.
Missed subscriber net add estimate of 2.3 million by 24%.
b) Forward Guidance
Q2 2023:
Missed revenue estimate by 3.2%. Q2 revenue growth to be almost entirely driven by paid subscriber additions.
Missed EBIT estimate by 9.1%.
Revised subscriber adds lower. Previously told investors to expect more net adds in Q2 vs. Q1 but now expects adds in Q2 to equal Q1. This is despite missing its expected net subscriber number for Q1.
2023:
Reiterated its revenue guidance. It continues to expect constant currency revenue growth rates to rise throughout 2023 via paid sharing, advertising and easier comps.
Reiterated its EBIT guidance and reiterated a 19% 2023 EBIT margin at the midpoint.
Raised its at least $3 billion in FCF guide to at least $3.5 billion. This is mainly due to lower content spend.
Long Term:
Netflix reiterated its long-term targets of double digit revenue growth, EBIT leverage and growing FCF.
c) Balance Sheet
Moody’s upgraded Netflix debt to investment grade to join its investment grade rating from S&P Global.
$7.8 billion in cash & equivalents.
$14.5 billion in total debt.
1.1x last 12-month (LTM) debt to EBITDA ratio vs. 1.2x last quarter and 1.3x 2 quarters ago.
Repurchased $400 million in stock and “currently expects to accelerate repurchases over the course of 2023.”
d) Letter & Call Highlights
Global Demand:
Overall revenue growth of 4% was 8% YoY on an FX neutral (FXN) basis.
North American revenue rose 8% YoY via a 9% rise in average revenue per member (ARM). Paid members shrank slightly YoY and rose slightly QoQ on the continent.
EMEA revenue fell 2% YoY due to ARM falling 6% YoY. FXN revenue rose 6% with ARM rising 1%. A 4% rise in paid members was the largest source of growth here.
LATAM revenue rose 7% YoY and 13% FXN. Paid members fell due to a “pull forward from Q4 and some macro softness.”
APAC revenue rose 2% YoY and 10% FXN via strong paid member adds growth of 17% YoY and offset by ARM falling 13% YoY.
If demand growth accelerates enough, it will raise its planned content spend which will weigh on FCF generation. Puts and takes.
Margins:
EBIT outperformance was via “expense management” and timing of some spend. The 21% margin vs. 25% YoY would have been 24% vs. 25% YoY FXN.
Again, lower content spend is why FCF outperformed by such a wide margin.
“We don’t see ourselves approaching a near-term margin ceiling.” -- CFO Spencer Neumann
Advertising:
Outperforming per-member advertising margins are leading to Netflix “upgrading the ads experience” with more content, higher video quality and concurrent streams.
Member experience, value to advertisers and incremental business contribution are the 3 main metrics it tracks here. All three are as strong as expected with overall engagement “above initial expectations” just like last quarter. There has been “very little switching” from ad free plans via this launch.
95% of its ad-free content is now available for ad tiers.
It will soon launch its programmatic ad market (through a Microsoft partnership).
ARM in the USA for ad-supported plans is ABOVE standard plan ARM.
Incremental revenue from the ad business is expected to carry an EBIT margin north of 50% over time.
Paid Account Sharing and Pricing:
Netflix launched its paid account sharing option in 4 markets during Q1. It’s “pleased with the results” and has a broad rollout scheduled for Q2. There was an immediate “cancel reaction” that quickly faded.
The rollout was initially expected in Q1, but there’s some more product tweaking left to be done.
In Canada, the paid member base and revenue contribution is now larger than before launching password sharing restrictions and paid sharing.
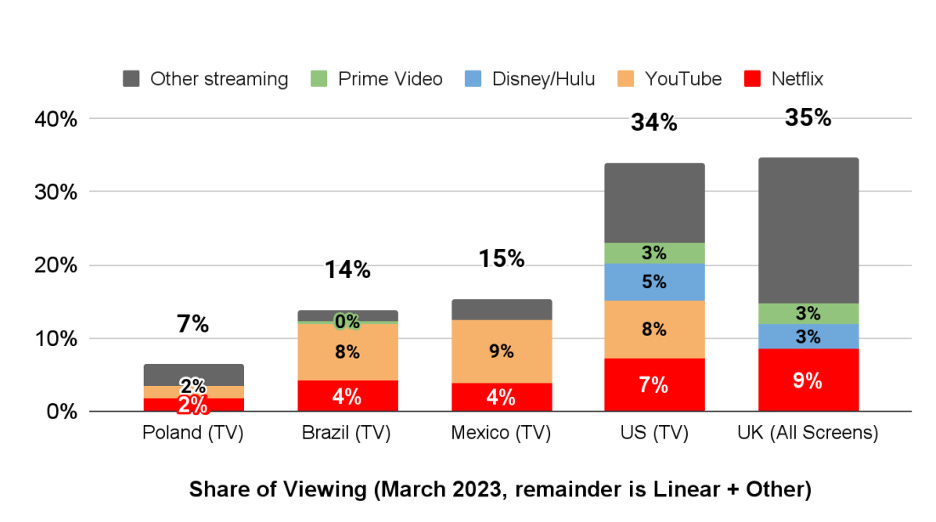
Netflix cut prices in 116 countries during the quarter. This was in response to how meaningful of a revenue accelerant the same move fostered in India last year. The changes come in markets totaling less than 5% of its 2022 revenue and it thinks this will maximize revenue longer term.
Netflix offered an interesting chart on its share of eyeballs within the streaming landscape. Netflix and YouTube continue to dominate with Disney catching up in the USA:
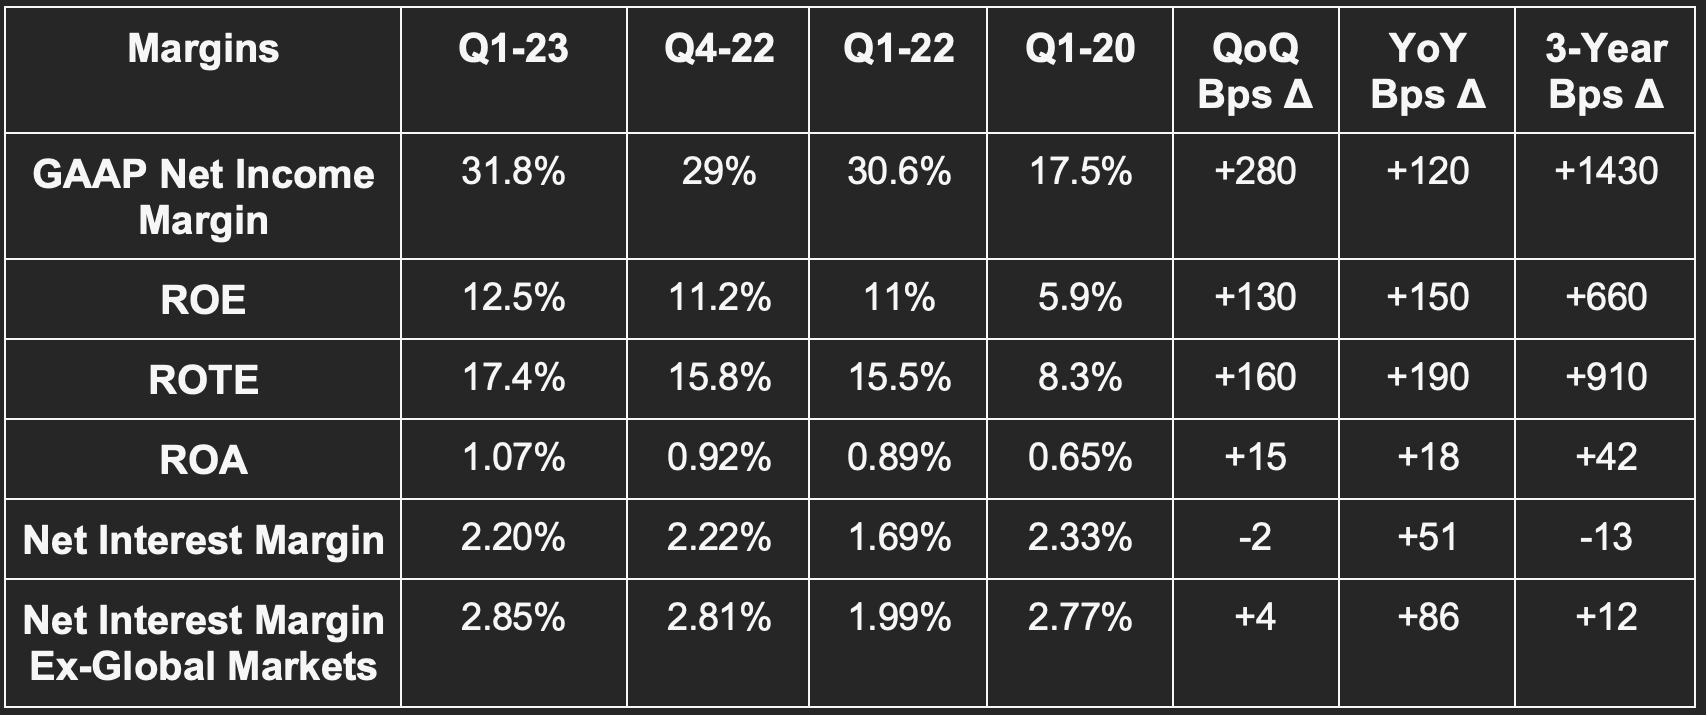
8. Bank of America (BAC) -- Earnings Review
Like JP Morgan last week, Bank of America is a fantastic view into the health of the U.S. economy and consumer. And just like JP Morgan last week, the quarter was excellent with some caution offered for the rest of the year. As a brief aside, this isn’t surprising. Banks thrive amid rising rate environments as they extract more yield from deposits. When that rate peaks later this year or early 2024, net interest margin (NIM) will morph into a headwind as depositors demand higher deposit returns. Economies are inherently cyclical and always will be.
a) Results vs. Expectations
Beat revenue estimates by 4%.
Beat $0.83 EPS estimates by $0.11 or 13.3%.
Beat return on equity (ROE) estimates by 145 bps.
Beat return on asset (ROA) estimates by 12 bps.
Beat book value per share estimates by 1.1%.
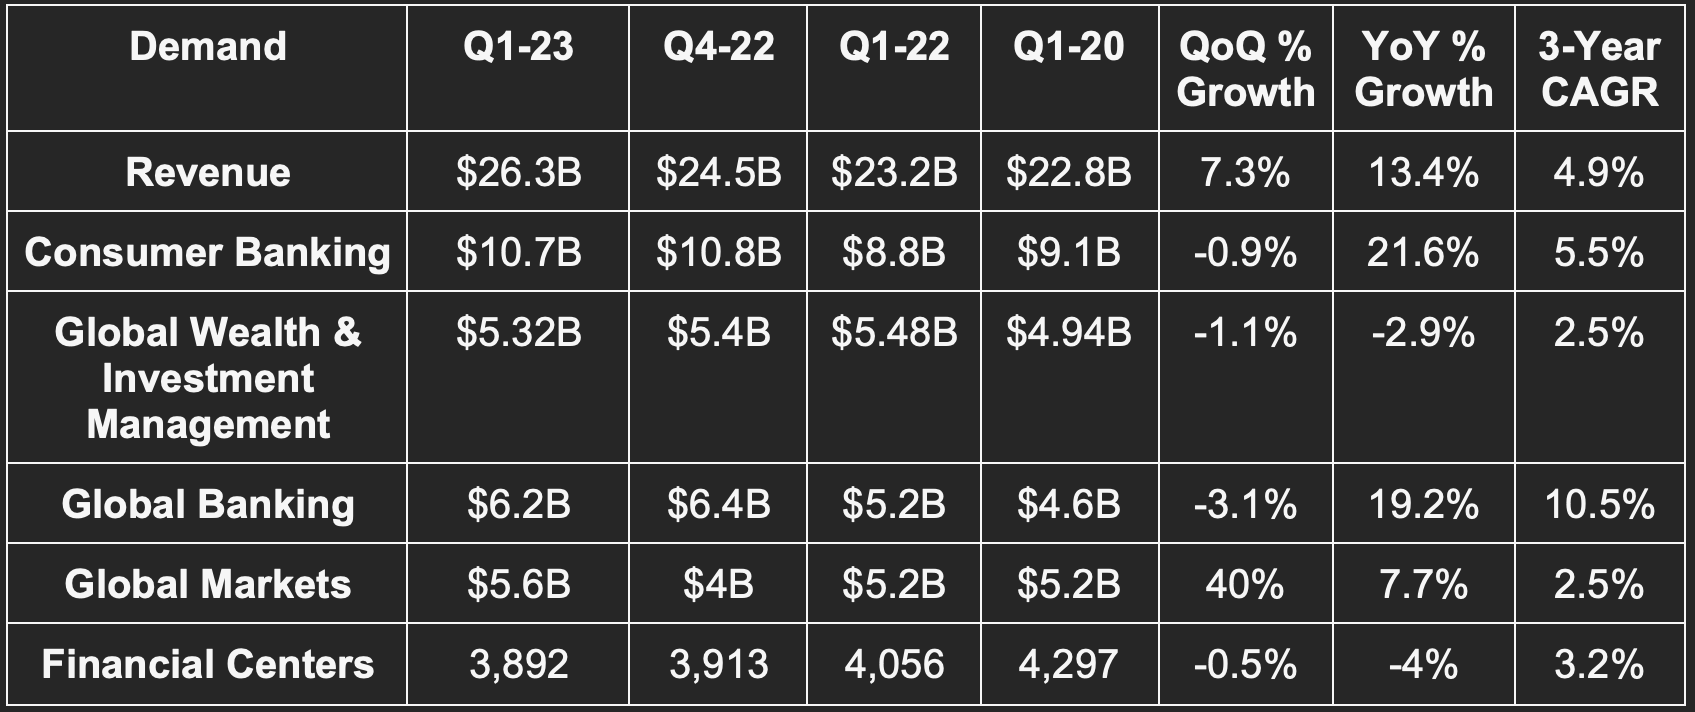
b) Balance Sheet & Liquidity
Common Equity Tier 1 Capital Ratio (CET1) under the “standardized approach” was 11.4% vs. 11.2% QoQ & 10.4% YoY. Using Bank of America’s “advanced approach” (fancy way of saying non-GAAP) CET1 was 12.9% vs. 12.8% QoQ & 12% YoY.
Tier 1 leverage ratio was 7.1% vs. 7% QoQ & 6.3% YoY.
Book value per share rose to $31.58 vs. $30.61 QoQ & $29.70 YoY. Tangible book value rose to $22.78 vs. $21.83 QoQ & $20.99 YoY.
Outstanding loans and leases rose slightly to $1.041 trillion vs. $1.039 trillion QoQ and $977 billion YoY.
Deposits fell 1% YoY and average deposits fell 7% YoY. It’s actually encouraged by this result considering it sees this growth now normalizing at a dollar base 34% above 2019 levels.
c) Call & Release Highlights
Macro:
“Our research team continues to predict a shallow recession that will occur beginning in Q3 2023… everything points to a mind recession… signs of inflation are tipping down, but they’re still there.” -- CEO Brian Moynihan
Moynihan and CFO Alastair Borthwick added that consumer spend remained strong into March with year-to-date growth sitting at a robust 8%. That activity began to soften in April.
Credit Quality:
Bank of America expensed a $931 million credit provision vs. $1.09 billion QoQ and just $30 million YoY. This provision counts against net income, but Bank of America saw leverage on this margin line and 15% YoY net income growth regardless.
$807 million in net credit charge offs for a 0.32% rate vs. $392 million for a 0.16% rate YoY. Losses are normalizing in a post-pandemic, post stimulus world.
"Asset quality remained strong with net charge-offs still below pre-pandemic levels. Our CET1 ratio is nearly 100 basis points above our current minimum requirements. Capital strength allowed us to return $4 billion back to shareholders, and we continued to invest in our people and businesses.” -- CFO Alastair Borthwick
Rising Rate Impact:
Interest income rose 25% YoY to carry Bank of America’s operations. In contrast, non-interest income rose 1% YoY.
Segment-Specific Results:
Digital sales now equate to 51% of all consumer banking revenue. Verified digital users rose from 54 million to 56 million YoY.
Erica (the BAC digital banking platform) users rose from 14.2 million to 17.8 million.
Zelle users (where Bank of America is a key participant) rose from 213 million to 275 million YoY.
Assets under management for its Global Wealth and Investment Management arm fell $104 billion YoY to $1.5 trillion.
Investment banking fees fell 20% YoY due to light industry activity as macro headwinds persisted and cost of capital rose. It remained the 3rd largest player in this category to point to the result truly being macro-driven.
On its Securities Portfolio:
Bank of America leadership spoke on the deposit spike it enjoyed since the start of the pandemic. It needed to put these deposits to work and did so in available for sale (AFS) and held to maturity (HTM) securities. It hedged the rate sensitivity risk of the AFS portfolio for the last 3 years and stopped adding to its HTM portfolio when deposits peaked in Q4 2021. It was also able to liquidate some of its AFS holdings this quarter to bolster its cash pile. Their balance sheet is unsurprisingly in FAR healthier shape than Silicon Valley Bank.
“We pay 92 basis points on deposits vs. our blend of securities which pay 290 basis points. We continue to benefit here… we’ve continued to raise overall yield on our balances due to maturity and reinvestment of lower yield securities.” -- CFO Alastair Borthwick
“As we entered the middle of 2021, it became clear that the stimulus payment would be the last one. We believed deposits would be peaking so stopped adding to our HTM book.” -- CFO Alastair Borthwick
Borthwick was explicitly asked if the HTM portfolio was in good shape in terms of realized losses and credit losses. He responded with “correct.”
d) Other Financial Earnings
American Express posted decent results via a “resilient consumer” and a strong return of travel spending. Provisions shot higher as expected with loss rates normalizing across the industry. Revenue was ahead of estimates and net income as well as EBT fell short. Return on Equity also underwhelmed materially. Still, it reaffirmed its full year guidance, meaning the miss was a matter of timing. The consumer is holding up quite well. This, JPM, BofA, Visa and Mastercard data all point to that being the case for now.
9. Intuitive Surgical (ISRG) -- Q1 2023 Earnings Review
a) Results vs. Expectations
“Product use grew strongly and was helped by positive surgical trends. New capital installs were likewise strong as customers built their da Vinci and Ion system capacity to meet demand.” -- CEO Gary Guthart
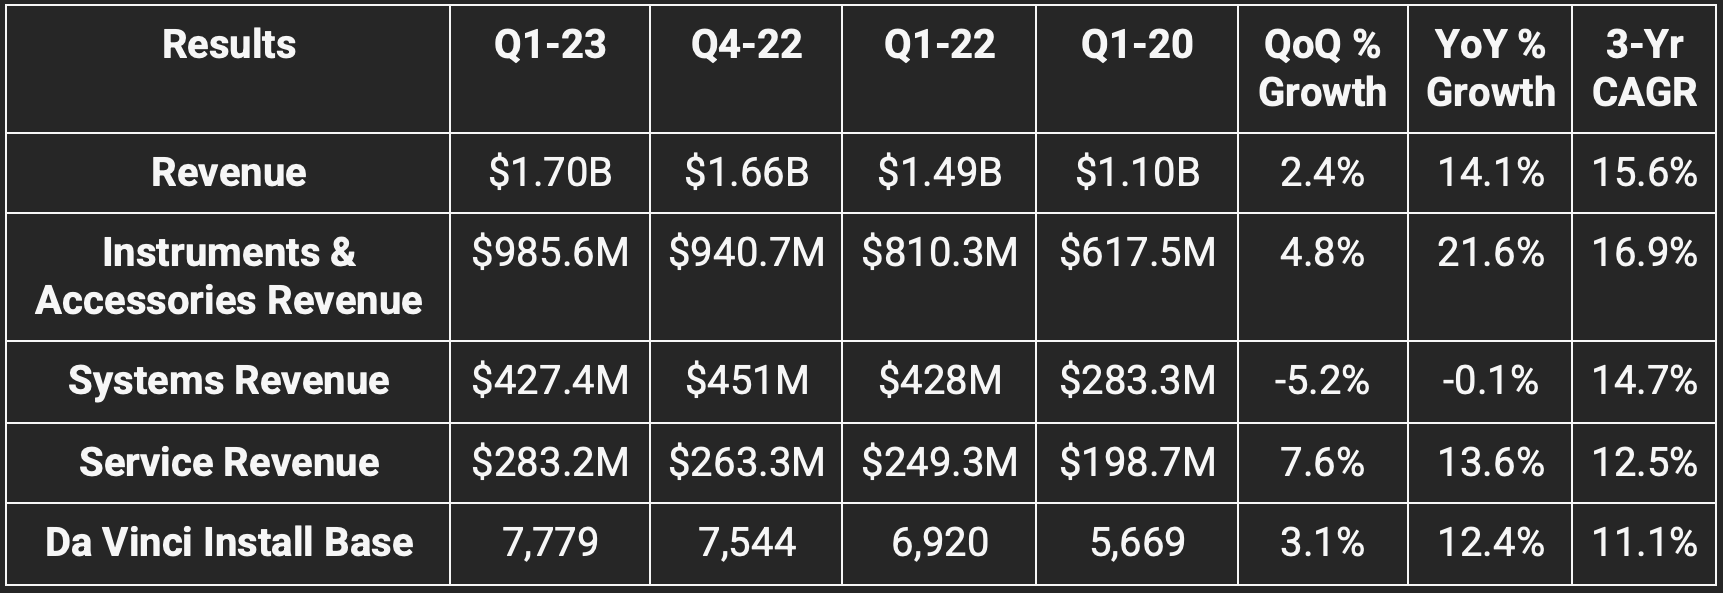
b) 2023 Guidance
Raised its procedure growth guide from 14% to 19.5% on the heels of an excellent quarter as industry-wide demand accelerates.
Reiterated its 68.5% gross margin guide.
Raised its operating expense growth guide from 11% to 13% via “higher variable compensation and costs related to more procedures.”
Lowered SBC guide from $630M to $615M.
Reiterated CapEx guide of $900M.
c) Balance Sheet
$6.58 billion in cash, equivalents and investments. This shrank slightly YoY via buybacks and CapEx.
Repurchased $350 million in stock vs. $1 billion in each of the previous 2 quarters.
Stock comp was a very modest 1.3% of revenue and just 6.7% of share repurchases.
Inventory rose 45% YoY and 6% QoQ to outpace demand growth.
d) Call & Release Notes
Demand:
Worldwide da Vinci procedures grew 26% YoY. This compares to 18% YoY last quarter and was aided by continued share gains but also strong industry-wide demand.
Placed 312 da Vinci surgery systems vs. 311 YoY and 369 QoQ; it placed 55 Ion systems vs. 34 YoY.
Foreign Exchange headwinds hit revenue by about 300 bps which was stable QoQ.
Adoption of its new Ion product is “strong.”
China procedure volumes improved materially QoQ but are not yet meeting its assumed 2023 demand run rate.
Diagnostic pipeline size rose above pre-pandemic levels after “several years of lag” as healthcare continues to normalize.
Utilization of systems rose 13% YoY as the firm gains share with use cases covered vs. alternative surgical methods.
Simulation subscription install base rose 36% YoY as “VR training becomes more embedded in the training pathway.”
“Our core business was lifted by positive surgical trends and continued interest in robotic-assisted surgery when compared with other surgical approaches. -- CEO Gary Guthart.”
Margins:
Margins were impacted by charges incurred from its stapling robotics product. Product access was diminished from these issues at it had to replace some hardware, but “has since recovered.”
Production yields for its newer lines of tools also fell short of expectations. It’s addressing this shortcoming with “investments in capabilities to raise yield in the face of rising demand.” It has “worked through the issues driving most of these issues.”
Regulation:
Intuitive Surgical secured a CE mark in Europe (their FDA approval equivalent) for its newer Ion system. It will roll this out first in the UK while continuing to collect clinical data to demonstrate outcome-based advantages that could eventually fetch more hardware cost reimbursements.
A Price Hike:
Intuitive Surgical is raising pricing on its instruments and accessories (I&A) by 5% across the board. This is in response to the “durability of component cost increases.” This is set to bolster 2023 revenue and EBIT each by $100 million as it plans to let the added revenue flow down the income statement.
10. SoFi (SOFI), Apple (AAPL) & the High Yield Savings battle
Apple Card customers can now access a high yield savings account for 4.15% APY through a partnership with Goldman Sachs. The account comes with no fees, a trackable savings dashboard from phones and no balance minimums. Notably, this is only for deposits up to $250,000 with the APY falling thereafter.
This is formidable competition for SoFi and its 4% savings APY despite SoFi having no deposit maximums. That perk should cater to affluent individuals -- especially with the $2 million in FDIC insurance.
At the same time, offering more yield to attract deposits is not a unique source of product differentiation. Mega-cap banks aren’t willing to follow suit, but pretty much everyone else is following in SoFi’s footsteps. SoFi’s high APY was not all that unique before this announcement. It was never going to be a durable edge. And surely there will be more new entrants into the space all vying for share.
To succeed, SoFi will need to continue bundling its products in a “better-together” manner to continue passing on unique perks like travel savings and loan discounts to its customers. It separates itself via a willingness to offer lower ROE products that others won’t to promote retention and cross-selling to the higher ROE products in its suite. To a lesser extent, it competes on convenience, speed to deposit access and loan funds, early IPO access, user interface and branding… but product depth and breadth is the real source of its uniqueness.
11. Datadog (DDOG) -- M&A
Datadog is buying Codiga -- a software company born to expedite developer coding. Codiga sifts through code (from a wide range of source code languages) to uncover blunders for software engineers. The messages are passed on to coders to allow them to fix as they write, rather than going back later to identify and fix bugs. This cuts the amount of bad finished code shipped to endpoints and networks.
This move pushes Datadog deeper into the world of DevOps. Specifically, this adds more capabilities on the dev (or developer/source code) side of things. Codiga generates $10 and $20 million in revenue annually. This will not be needle-moving to Datadog’s financial results, but will add new use cases which should improve client retention and provide high margin cross-selling.
12. Alphabet (GOOGL) -- AI Search Battle
Rumors are building that Google could lose its default search engine contract with Samsung to Bing. This contract is worth $3 billion in annual Google revenue. This is leading to more concern around its Apple contract expiring this year. Whether it’s Microsoft, Baidu, Amazon, Meta or virtually all other tech giants, Alphabet is now dealing with more discovery and search-based competition than it has since its early days. While NFTs and Web3 were all the rage in 2021 and 2022, thankfully AI and its more realistic utility took over media headlines in 2023.
As I’ve said before, AI requires massive datasets to season models and build efficacy. In the world of search, Alphabet is the company with the data scale. This is its battle to lose… but small signs like this build investor fears that it will lose.
To better compete, Google is reorganizing its AI teams into a single “DeepMind” group to make its product development more expedient and is frequently launching new models. This week it extended its generative AI model to search and ad campaigns. Furthermore, it’s building a brand-new AI search engine. Clearly, this is a priority. Google has the resources to win and is now more passionately focused on doing so. At the same time, all of these changes hint at its market power feeling threatened.
It’s not realistic to think Google will go extinct in search. It is realistic to think it could lose a few percent of its monopoly-like command over the sector. Search drives its margin profile, meaning share erosion would be a material pain in the neck for overall results.
As a brief aside, stronger competition here is great news for all other companies that compete with Google elsewhere. It will have to prioritize search more than it has in the past and focus less on ancillary projects like programmatic advertising. As a shareholder of The Trade Desk, I’m selfishly fine with this.
13. Final Market Headlines:
RBC channel checks point to robust merchant growth for Shopify in Q1. Our deep dive will be published tomorrow morning at 8:00 AM.
Meta is firing 10% of its UK staff as it pulls back in the country.
Microsoft has been working on vertically integrating the semiconductors used for ChatGPT since 2019. Microsoft Azure and Epic games are deepening their integration partnership to include OpenAI.
Amazon and Fox signed a new deal to distribute its local news content through Amazon’s platform. Amazon’s Whole Foods subsidiary will fire several hundred middle managers and reshuffle/condense organization structure. It’s everyone’s year of efficiency.
MercadoLibre is HIRING 13,000 new workers. What a refreshing divergence from layoff trends.
Block launched Tap to Pay on Android.
14. Key Macro Data from the Week
Output:
NY Empire State Manufacturing Index for April was +10.8 vs. -18 expected and -24.6 last month.
Philly Fed Manufacturing Index for April was -31.3 vs. -19.2 expected and -23.2 last month. Its employment index conversely outperformed with a -0.2 reading vs. -2.6 expected.
Manufacturing Purchasing Managers Index (PMI) for April was 50.4 vs. 49 expected and 49.2 last month.
S&P Global Composite PMI for April was 53.5 vs. 52.8 expected and 52.3 last month.
Services PMI for April was 53.7 vs. 51.5 expected and 52.6 last month.
Employment:
Updated Initial Jobless Claims were 245,000 vs. 240,000 expected and 240,000 last month.
Housing:
Building Permits for March (leading housing indicator) came in at 1.41 million vs. 1.45 million expected and 1.55 million last month. Permits fell 8.8% month over month (MoM) in March vs. expectations of 6% shrinkage and 15.8% MoM growth in February.
Existing Home Sales for March came in at 4.44 million vs. 4.5 million expected and 4.55 million last month. Existing home sales shrank 2.4% MoM vs. expectations of 5% growth.
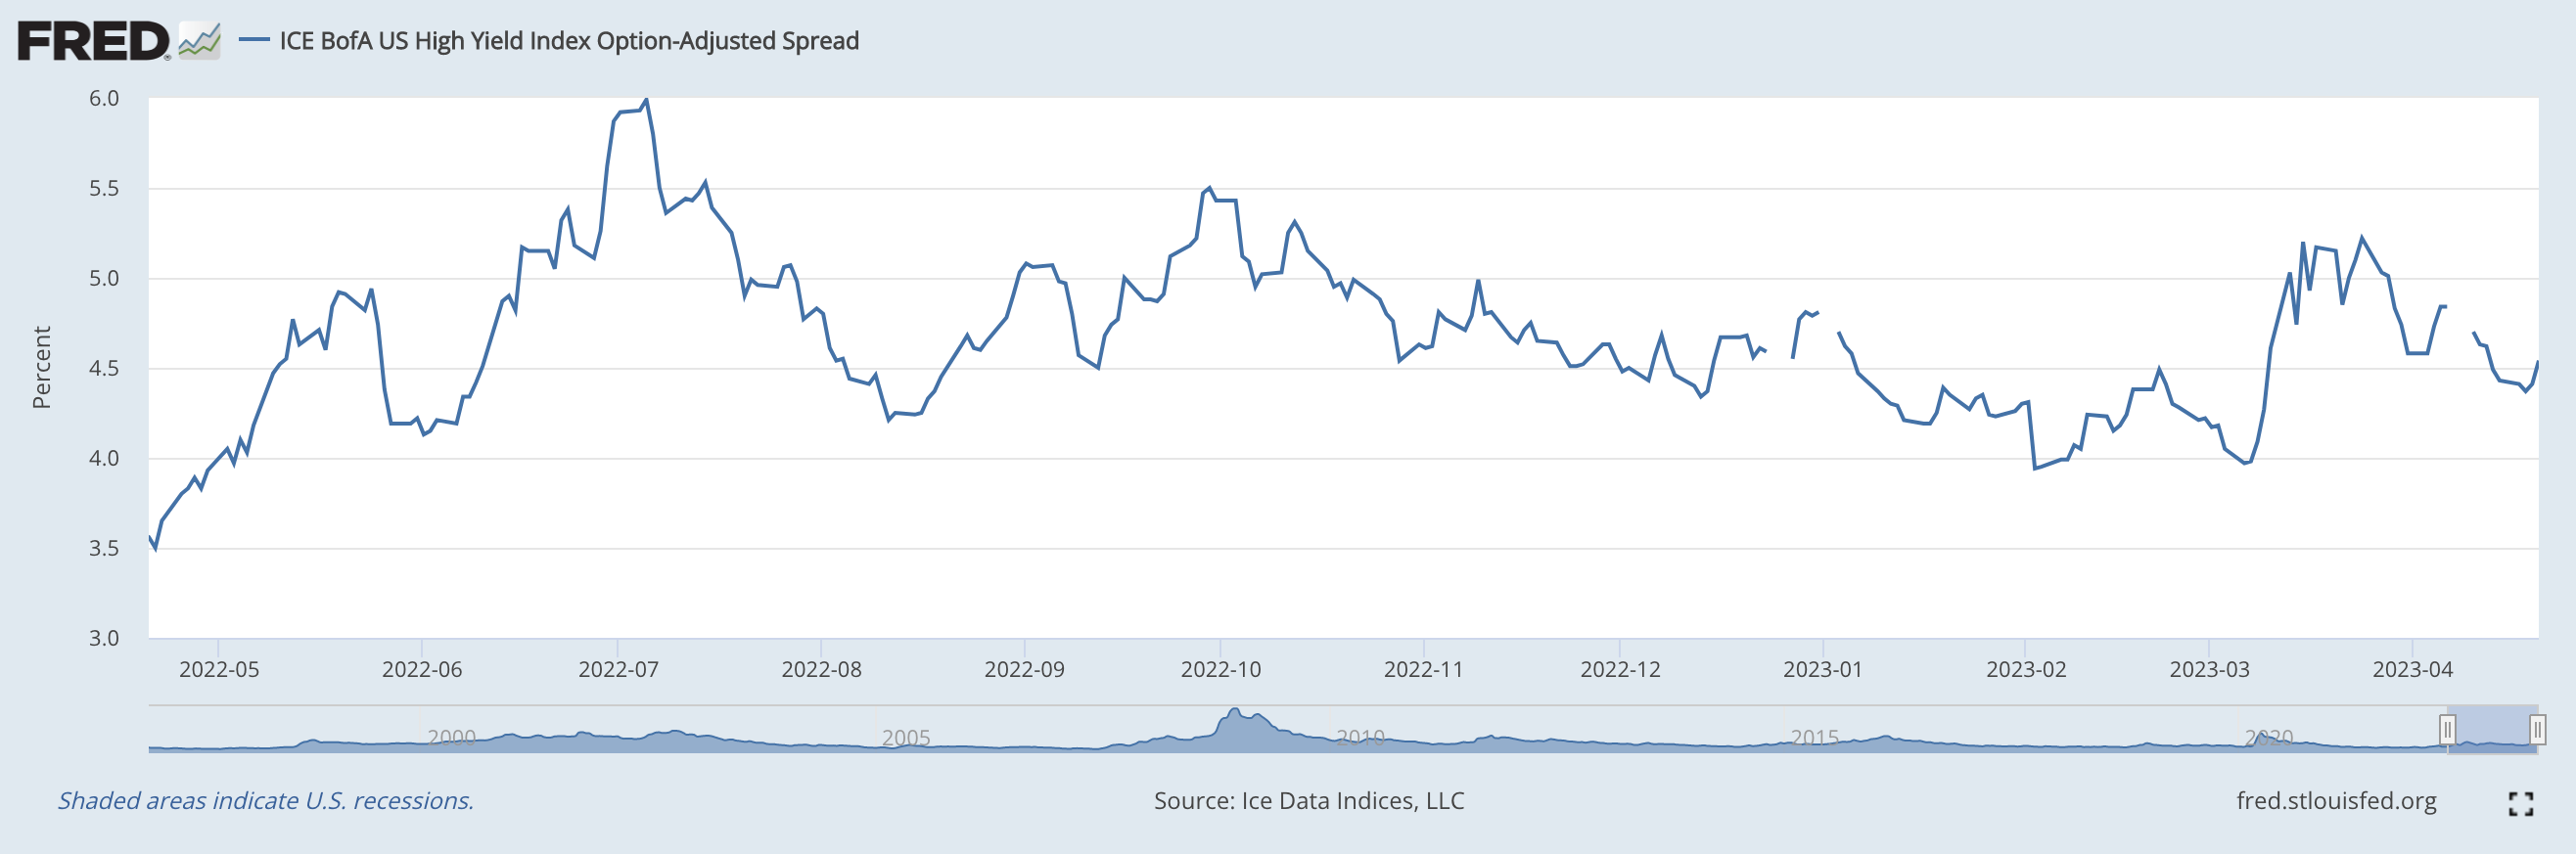
High Yield Option Adjusted Corporate Credit Spreads rose (a bad thing) a bit this week:
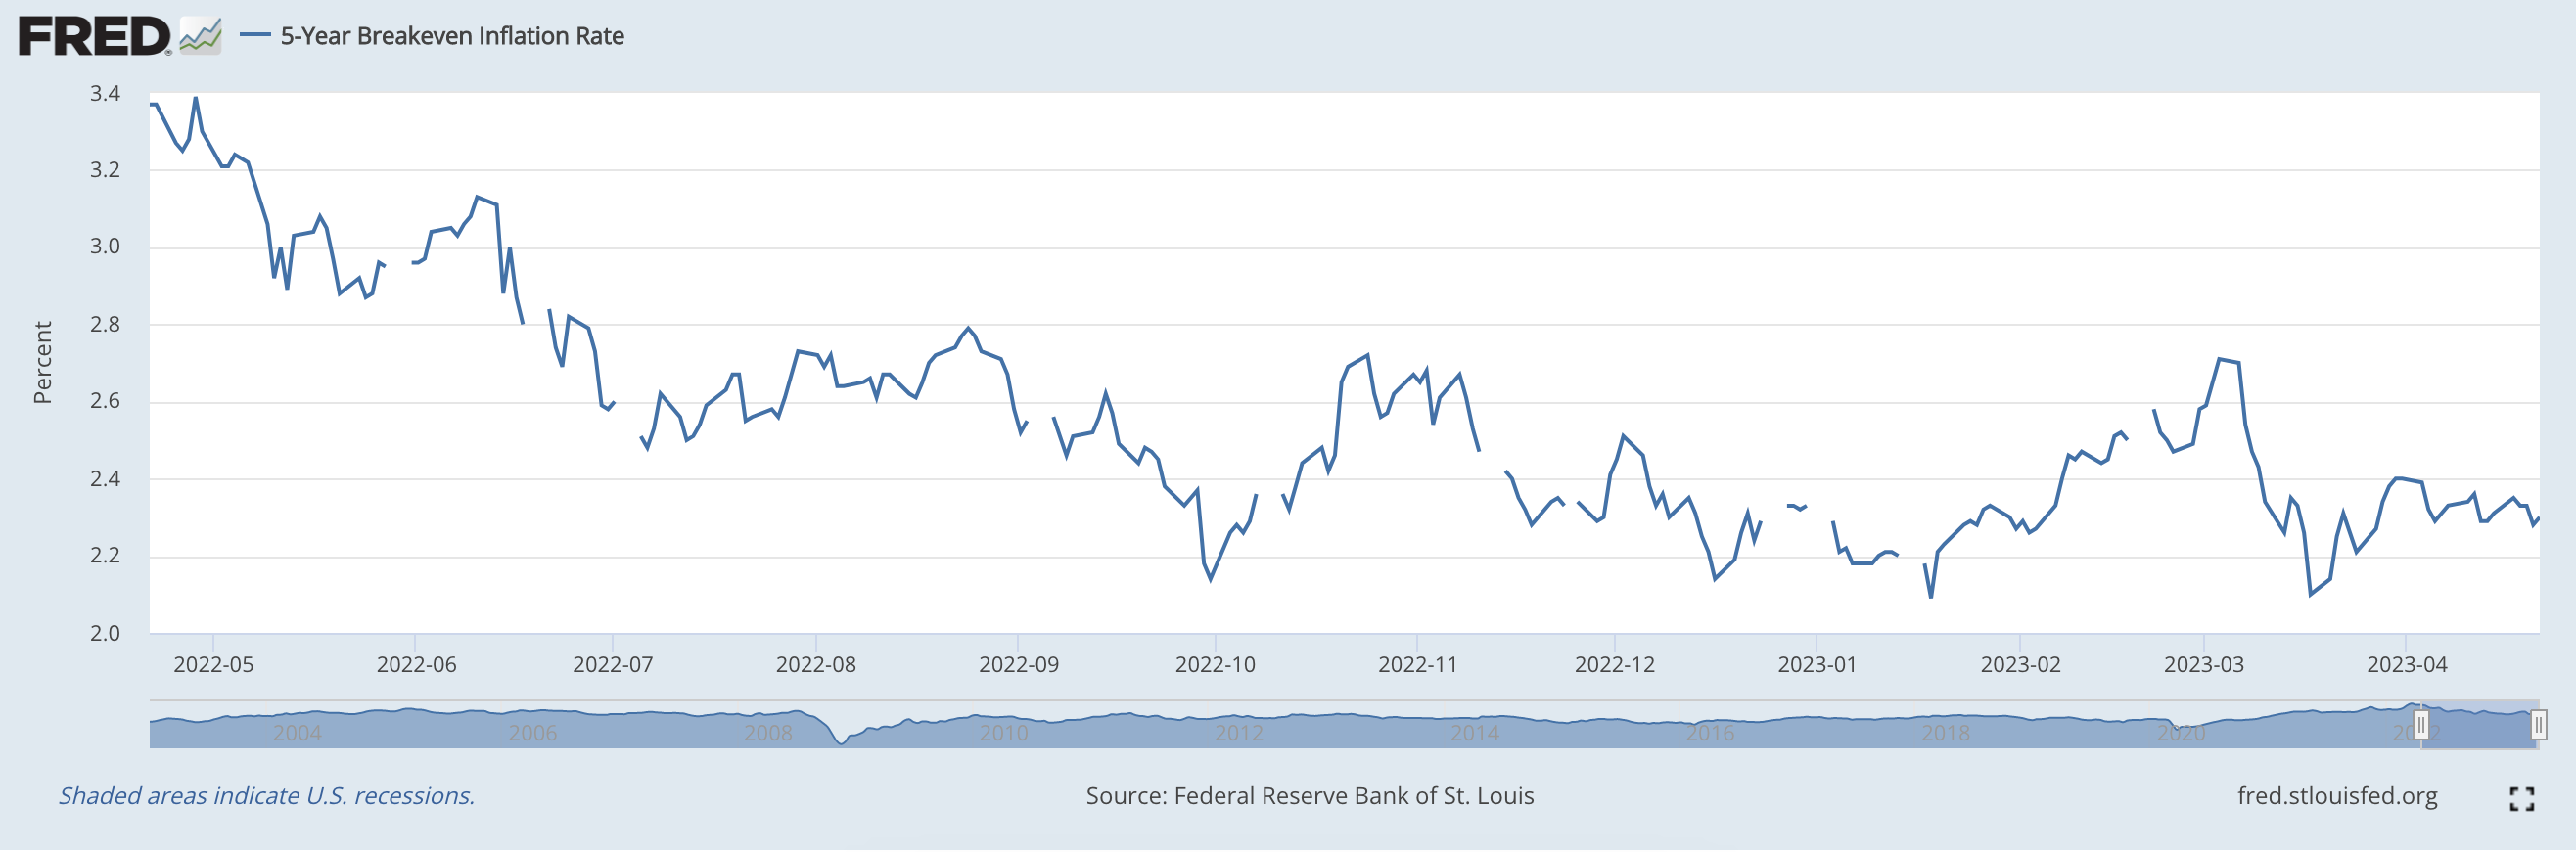
5 Year Breakeven Inflation Rate rose a bit this week too:
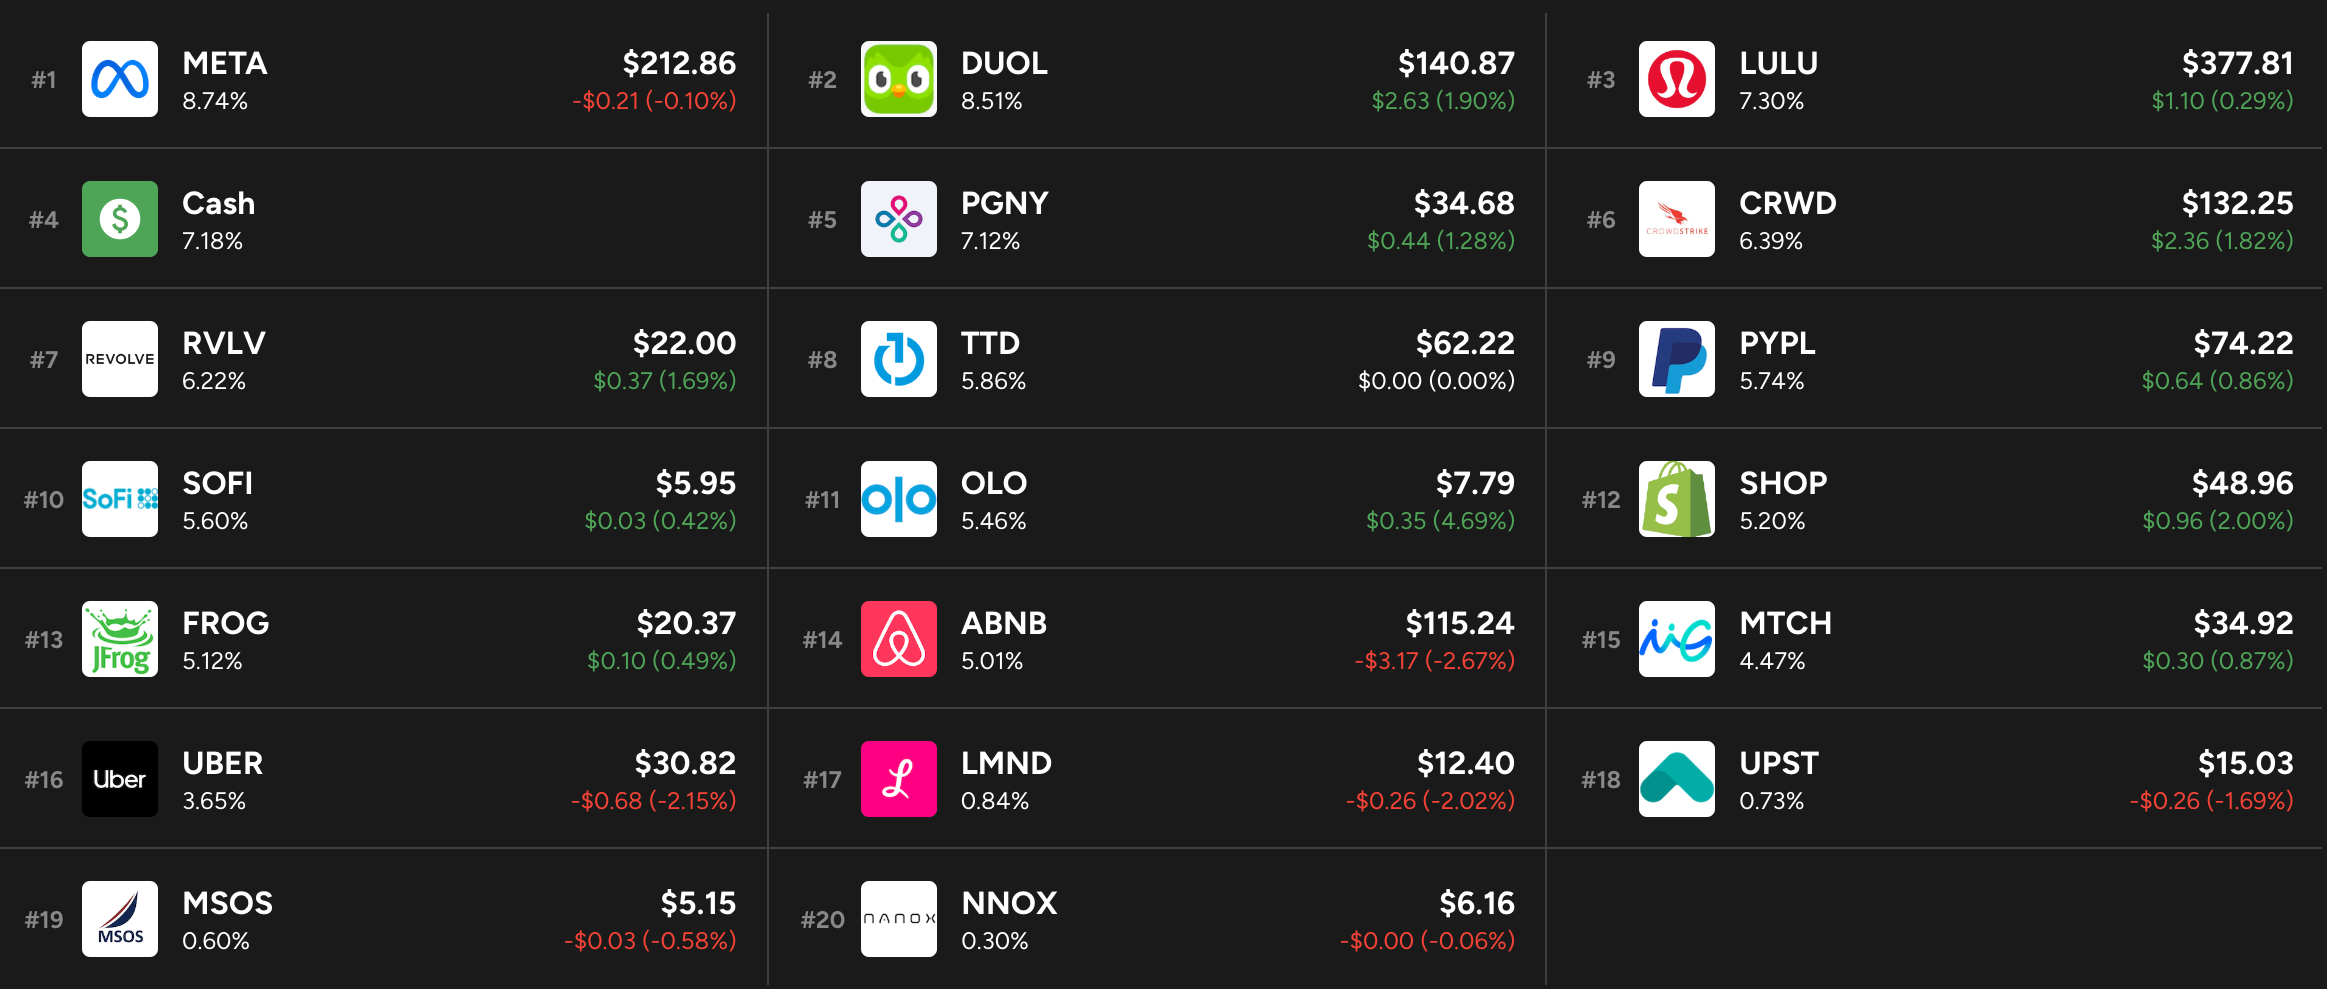
15. My Activity
I did not transact this week.
Always a great writeup! I like your take on Datadog and Google!