

Discover more from Stock Market Nerd
News of the Week (April 24 - 28)
CrowdStrike; SoFi; Shopify; Google; Microsoft; Amazon; CloudFlare; Visa; Mastercard; Chipotle; Upstart; Market Headlines; Macro; Portfolio
Welcome to the hundreds of new subscribers who have joined us this week. We’re delighted to have you and determined to provide as much value as possible.
1. CrowdStrike (CRWD) – CrowdStream & Google
a) CrowdStream
CrowdStrike debuted CrowdStream this week. The product expedites the location and querying of relevant 3rd party data to be infused into the Falcon platform. It unifies the data securing process from countless disparate silos to uplift threat remediation and prevention at its core. In essence, that is what the X in XDR (extended detection and response) means: Unlocking more partner data sources to combine with Falcon’s threat graph and customer data. Customers can do this free of charge for the first 10 GB of data. The product is offered in partnership with Cribl, an “open observability tool” and one of Falcon Fund’s (its VC arm) first investments.
Per the release, it “connects any data source into Falcon using Cribl’s observability tech. As the middleman, CrowdStrike vastly organizes and scalably eases this process. Alone, this is complex and expensive which has been a real hurdle for embracing XDR use cases. Problem solved.
b) Google
CrowdStrike and Google Cloud deepened their budding partnership this week. Now, Falcon is directly integrated into Google Cloud and its work environments. While CrowdStrike struggled in its early days to play nice with public cloud titans and missed out on significant partner revenue, that’s no longer the case. Whether it’s rapid revenue growth with AWS customers or Google developments like this, it’s becoming a better team player and its results will benefit. In terms of Microsoft, its direct competition with the company caps how closely these two can work together.
2. SoFi Technologies (SOFI) -- Student Loans & APY
a) Student Loans
Politico released a great article this week on a potential restart to student loan payments. According to the report, funding is running low as the Department of Education (DoE) has not collected revenue from this segment in 3 years and costs exploded higher to offer more borrower support. DoE fears that the Government does not have the funds to restart student loan payments and knows it does not have the funds to keep the moratorium in place. Tough spot.
In terms of the SoFi implications, they’re actually quite positive. This is forcing the hand of Capitol Hill to finally resume collections. That resumption would vastly accelerate SoFi’s refinancing demand and bolster what was its largest revenue segment pre-moratorium. Per the article, DoE officials are telling loan players like SoFi to prepare for a restart of payments in September. This hints at the current guidance of the moratorium ending by August 30th at the latest still being in place.
Still, there are planned “safety net” provisions which would allow borrowers to miss a certain number of payments with no penalties. That would slow, not halt, the re-ramping of demand. Policy makers want this grace period to last up to a year, but they don’t currently have the funding to do so.
SoFi’s guidance currently contemplates that student loan demand begins recovering in September. There was little certainty on this being the case as we were frankly worried about yet another extension hitting its full year estimates. Encouragingly, it does not look as though that will happen, although the grace period would dampen the ramp throughout 2023.
b) APY
SoFi raised its savings account APY from 4% to 4.2%. Perhaps not coincidentally, this is slightly ahead of Apple’s new rate and has no deposit maximums unlike the competition. While this will surely support top of funnel member growth, as we’ve said before, it is not a durable competitive edge. Alternatives like Robinhood and even Vanguard are rapidly raising their own rates as well. SoFi wins with its product suite breadth and tech stack integration offering more cross-selling opportunities and savings that it can pass on to customers. That is its consumer-facing edge… not a slightly higher APY.
Catch up on the markets daily for free in under 5 min in just One Read. Everyday we provide market highlights, important news and economic analysis in a easy to read simplified format. Don’t waste time filtering through all the stories in the financial world, sign up now and receive our update everyday after close!
3. Shopify (SHOP) -- Shopify Bill Pay
Shopify continues to expand its financial services offering. This week, through a partnership with a B2B payments vendor called Melio, it launched Shopify Bill Pay. The tool makes organizing and expediting bill pay obvious and doable all from the centralized Shopify Admin. There are no sign-up or subscription fees to use this.
As businesses scale, payment methods and vendors morph into a maze of names. Our business personally has about 10 advertisers in the database and nearly 10 different payment methods we use with them. It’s very annoying. According to the presser, the tool saves 16 hours per month on bill paying and is 2x faster than alternatives. In its mission to ensure businesses of all sizes have access to enterprise level infrastructure and resources, this is the latest development. The offering integrates perfectly into Shopify Balance to allow merchants to pay expenses from that account.
4. Alphabet (GOOGL) -- Earnings Review
a) Results vs. Expectations
Beat revenue estimates by 1.4%.
Beat EBIT estimates by 7.1%.
Beat $1.07 EPS estimates by $0.10.
Beat free cash flow (FCF) estimates by 14.7%.
b) Forward Guidance
Alphabet does not offer formal forward guidance. It did tell us that 2023 Capital Expenditures (CapEx) would be slightly higher than in 2022. This represents a small raise to that cost expectation as it builds out data center and server infrastructure to support its AI ambitions. It also sees FX headwinds moderating for Q2 vs. Q1.
c) Balance Sheet
Announced a new $70 billion buyback; Repurchased $13.3 billion in stock vs. $15.4 billion last quarter.
$114 billion in cash and equivalents.
$14.7 billion in long term debt.
It paid out $5.3 billion in quarterly compensation for 7.6% of its revenue and 30.8% of its free cash flow. It’s more than offsetting the dilution with buybacks, but that’s still elevated for a company at this stage of maturity -- especially considering it shifted more stock comp out of Q1 and into Q2.
d) Call & Release Highlights
More Margin Context:
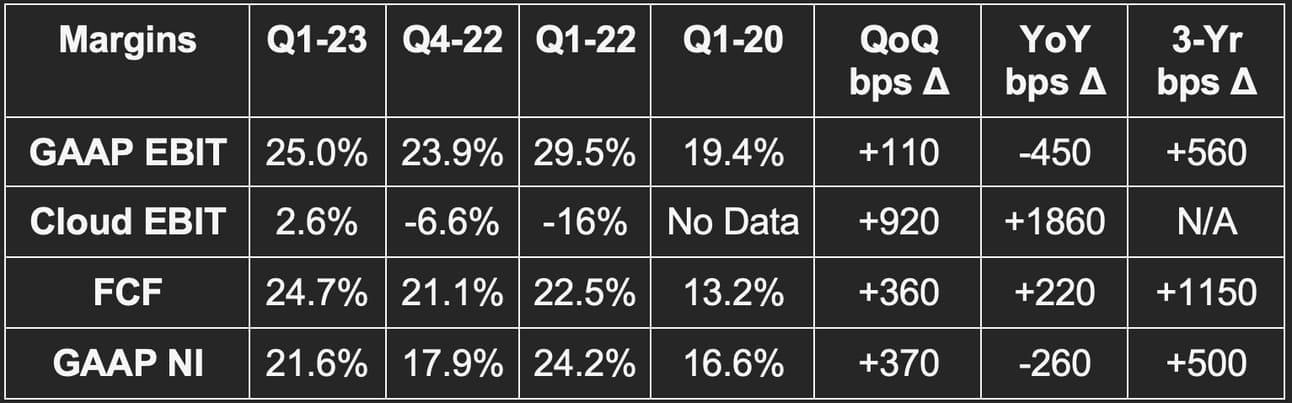
Google took $2.6 billion in charges related to layoffs and real estate footprint shrinkage. This hit GAAP margins and is why operating expenses rose by 19% YoY. Without these one-time charges, OpEx rose by about 5% YoY. GAAP EBIT margin for the quarter would have been 28.6% without this hit and GAAP NI margin would have been 25.2%.
More Accounting Changes & Cost Reductions Announced:
Google saved $988 million in depreciation charges from extending the useful life of its data center infrastructure. Microsoft and Meta have done the exact same thing this year.
The benefit from less depreciation will be ongoing; the hit from restructuring will be just for this year.
Google will continue to very selectively hire at a snail’s pace. Q1 headcount includes employees fired in January.
Will allocate more unallocated corporate costs to specific segments for “more decision making transparency.”
Timing of stock comp to shift from Q1 to the rest of the year. This helped Q1 margins along with the depreciation perk while the restructuring charges hurt. Very weird quarter for margins.
“In our view, there’s more to do with cost optimization.” -- CFO Ruth Porat
More Demand Context:
Revenue growth was 6% YoY on an FX neutral (FXN) basis.
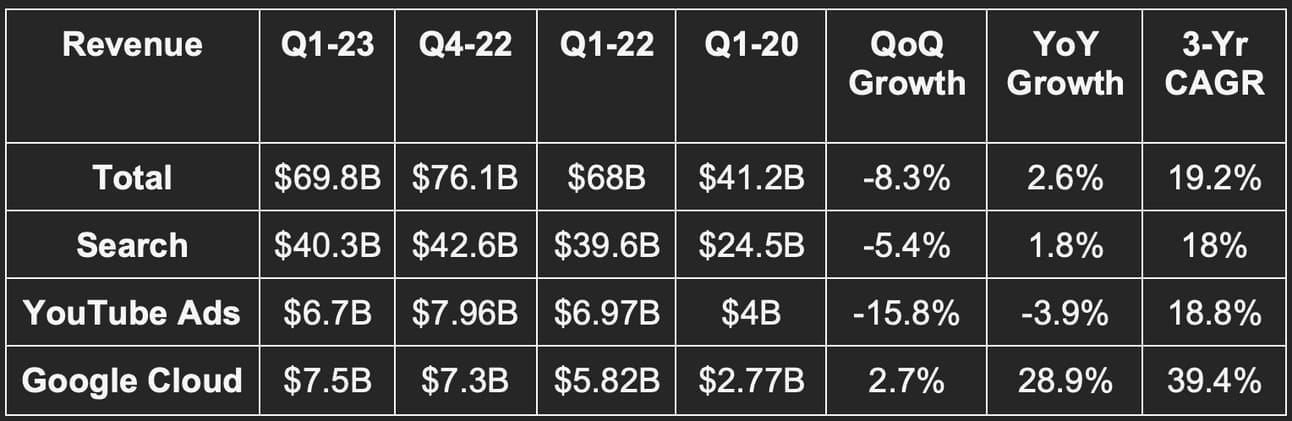
3-yr revenue CAGR of 19.2% compared to 18.2% last quarter and 19.5% 2 quarters ago.
Google Cloud & Accounting:
Google Cloud delivered its first quarter of positive EBIT. This was aided by stripping some operating expenses out of the segment to reallocate to its largest Google Services segment. With this help, the segment reported $191 million in EBIT for a 2.6% margin vs. -16% YoY and beat dollar estimates by well over 100%. Without this help, assuming a roughly $250 million quarterly boost from the change, it posted a -0.8% margin vs. -16% YoY for a nearly 100% beat. Great performance either way.
Annual cloud deal volume has risen 500% since 2020.
Large deals over $250 million have grown by 350% since 2020.
60% of the largest 1,000 companies in the world are Google Cloud Platform (GCP) customers.
13 dedicated System Integrator (SI) programs are now in place to help sell GCP vs. 0 in 2020.
Growth continued to be impacted by ongoing usage optimization to minimize cost amid chaotic macro for its clients.
AI Model Updates:
Released Google Bard, an experimental conversational model in March while updating it several times since with newer tools like code generation aid.
Debuted the Palm API to allow developers to tap into Google’s large language learning models to more easily and quickly build AI apps.
Will combine the Google Brain and DeepMind teams into 1 group. This is expected to accelerate development by consolidating all of its talent with full access to Google’s vast resources.
Performance Max (PMax) conversion tool is now delivering 18% higher conversions at similar advertiser cost. This compares to a 13% boost a little over a year ago as AI investments continue to bear fruit. For Corissia Hotels Group, PMax had boosted their revenue by 323% just 30 days after implementation.
Rolled out in-store sales reporting that integrates perfectly into Google’s online conversion reporting tools. This allows advertisers to measure conversion and returns in both online AND offline settings. Magasin used this new perk to raise omni-channel return on ad spend (ROAS) by 128%.
Google Services:
Advertising Search and other revenue rose 2% YoY largely thanks to the travel and retail segments with finance and media verticals notable weak spots.
Saw “signs of stabilization and performance” for YouTube ads. The in-network ad demand environment was materially weaker with continued spend pullbacks.
Channels uploading YouTube Shorts rose 80% YoY. Monetization continues to improve. Closing the monetization gap between short form and long form video is a key priority for this segment -- much like Reels and Meta.
YouTube delivers 40% higher ROAS vs. linear and 34% higher than other online video per a Nielsen study running from 2020-2022.
5. Microsoft (MSFT) -- Earnings Review
a) Results vs. Expectations
Beat revenue estimates by 3.6% & beat its guidance by 3.7%.
All 3 revenue segments beat with personal computing delivering the largest beat.
Beat EBIT estimates by 9.3% & beat its guidance by 9.3%.
Beat $2.23 EPS estimates by $0.22; Met OCF estimates.
Azure roughly met FXN estimates with 31% YoY growth.
11% commercial bookings growth sharply beat Microsoft guidance of flat YoY growth.
b) Forward Guidance
$55.35 billion revenue guidance beat estimates by 0.8%.
$23.3 billion EBIT guidance beat estimates by 3.1%.
26.5% constant currency Azure growth (so about 25% YoY growth) missed by about 100-200 basis points depending on the source.
c) Balance Sheet
$104 billion in cash & equivalents.
$42 billion in long term debt.
Bought back $5.5 billion in stock vs. $8.8 billion YoY.
d) Call & Release Highlights
Demand Context:
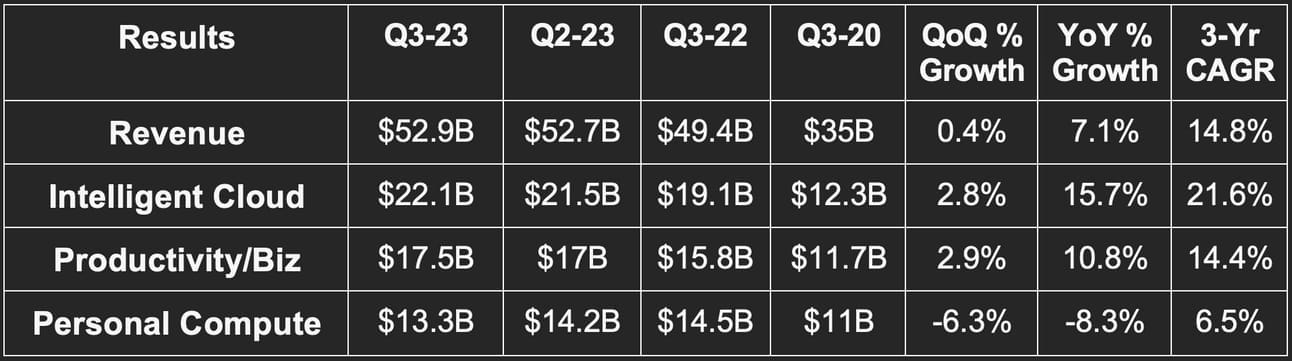
7.1% revenue growth overall was 10% FXN.
Cloud revenue rose 22% YoY and 25% FXN.
10.8% Productivity and Business growth was 15% FXN. Microsoft 365 Consumer Subscribers now total 65.4 million.
Xbox content and search + news advertising were the only personal computing segments that grew YoY. The rest shrank amid poor macro, supply gluts and PC cyclicality. Still, the shrinkage was much better than feared.
Commercial Remaining Performance Obligations (RPO) sits at $196 billion vs. $189 billion QoQ and $155 billion YoY.
“I feel like we are well positioned to continue to take share in so many key places.” -- CFO Amy Hood
Margin Context:
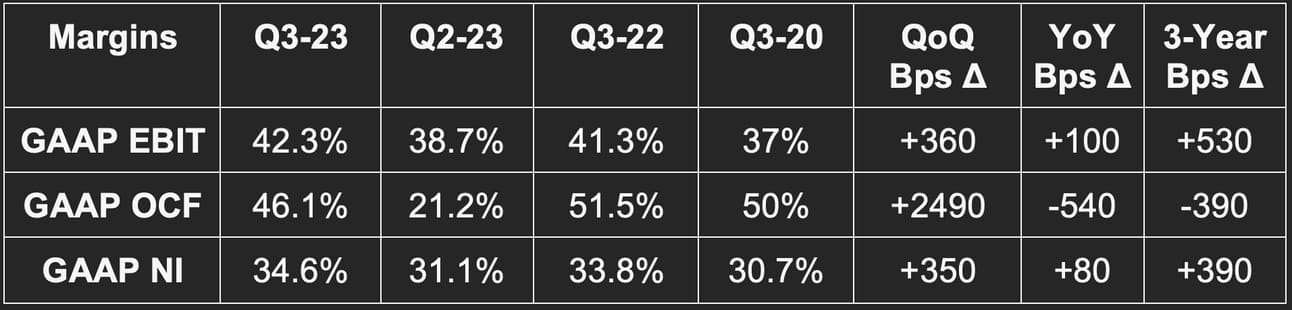
Gross margins were aided by extending the useful life of its data centers last quarter just like with Alphabet.
$2.45 in EPS represents 10% YoY growth (14% FXN).
Temporary R&D provision charges hit cash flows materially this quarter.
What’s Microsoft Copilot?
Copilot is an OpenAI-powered tool pulling from Microsoft’s language learning models to unlock conversational workflows and extensive work automation. As the name would indicate, it’s a copilot for expediting productivity much like ChatGPT has proven to be. It was integrated into GitHub for source code creation where it’s being monetized today. Microsoft fully plans to extend this software building and work companion to the rest of its suite.
Azure:
Azure grew 27% YoY and 31% FXN and “took more market share.”
The integrated Azure and OpenAI service now has 2,500 customers vs. 250 QoQ.
Epic Games started integrating OpenAI algorithms into its software. Shopify and Snap are using it as well. Unilever went “all in on Azure in one of the largest ever cloud migrations in consumer goods.”
Azure Arc (its integration tool to build on Azure) has 15,000 customers up 150% YoY.
Workload usage optimization is ongoing amid poor macro. This is holding back Azure growth but should ease throughout 2023 as customers are unable to just continue endlessly optimizing existing capacity.
GitHub and Developers:
76% of the Fortune 500 now uses GitHub to create software.
10,000 organizations have developers using Copilot just 3 months post launch. These include Coke and GM.
Its low code building Power Platform added Copilot recently and has 33 million monthly active users (MAUs) -- up 50% YoY.
Teams & LinkedIn:
Teams crossed 300 million MAUs vs. about 280 million YoY. Teams “took share across every category.”
Microsoft recently launched a new Teams version with 2x better performance and 50% less memory usage.
Teams phone is delivering clients a 3-year return on investment (ROI) of 140%.
LinkedIn revenue rose 8% YoY and 10% FXN. It has 930 million members with member growth accelerating for 7 straight quarters.
Security:
Took share in all of its major security markets.
600,000 customers have 4+ modules up 35% YoY.
Search:
“Bing now has 100 million+ daily active users. We are winning new customers with Bing Mobile installs up 4x since launch. We took market share in the USA.” -- CEO Satya Nadella
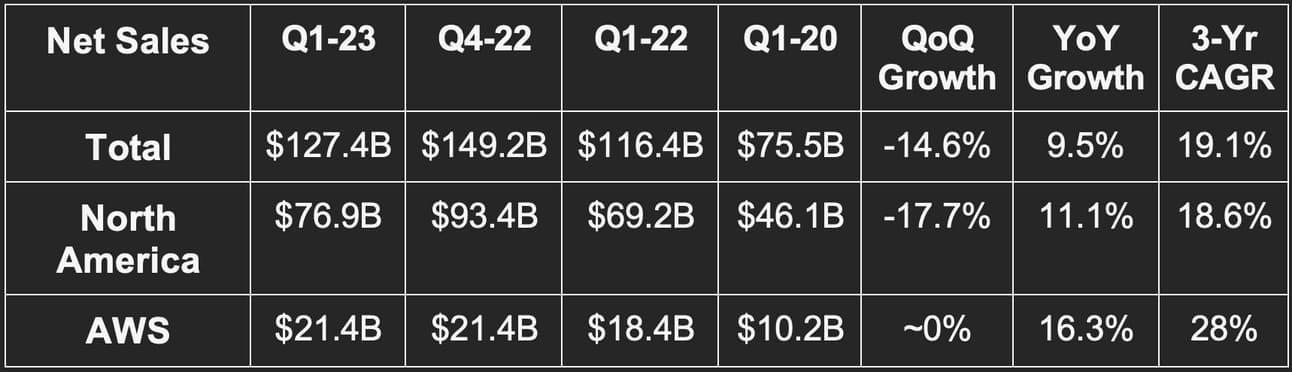
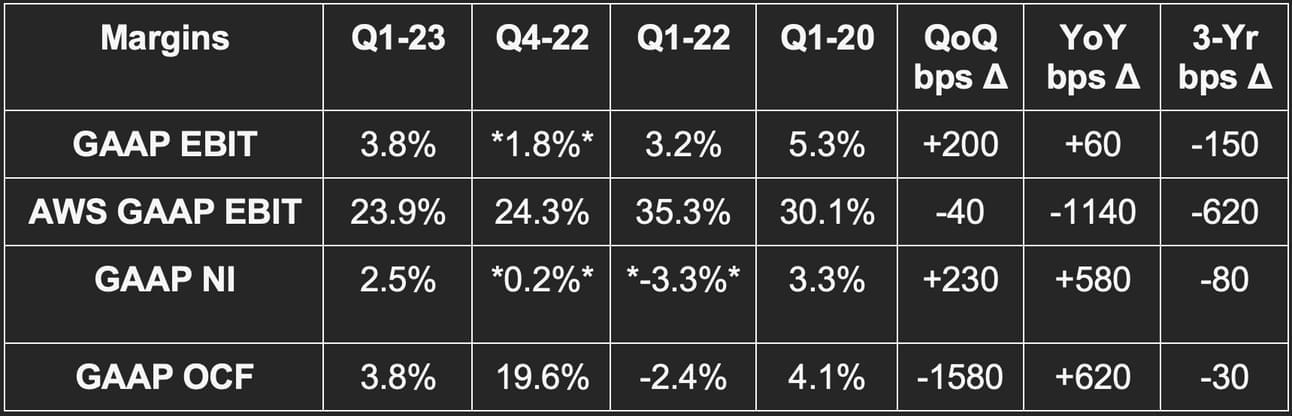
6. Amazon (AMZN) -- Q1 2023 Earnings Review
a) Results vs. Expectations
Beat sales estimates by 1.4% & beat its guidance by 3.2%.
AWS revenue beat estimates by 1.1%.
Beat EBIT estimates by 53% & more than doubled its EBIT guidance.
Beat $0.21 EPS estimates by $0.10.
b) Next Quarter Guidance
Met revenue estimates.
Missed EBIT estimates by 14.8%.
c) Balance Sheet
Roughly $65 billion in cash & equivalents.
Inventory levels were roughly flat QoQ and sit at $34.2 billion.
It has $67.1 billion in long-term debt.
d) Call & Release Highlights
Results Context:
The 19.1% 3-year revenue CAGR compares to 19.5% last quarter and 22% 2 quarters ago.
Ex-restructuring, EBIT margin was 4.2% vs 3.6% QoQ & 3.2% YoY. AWS EBIT margin was 25.2% without this charge.
Amazon fired 9,000 people during the quarter across AWS and Twitch. This is what led to the aforementioned $470 million severance/restructuring charge. $270 million of this was incurred by AWS which hit its segment EBIT margin.
Rivian equity losses continued to hit GAAP net income slightly but the impact was comparatively small vs. the last several quarters.
Cash is King:
Trailing 12 month operating cash flow grew 38% to $54.3 billion. Amazon continues to expect a multi-year build in FCF generation as it moves to a less intense portion of its current working capital cycle. Importantly, Amazon is not cutting costs, but is instead re-allocating costs away from more speculative bets and to AWS and its AI infrastructure capacity and models.
AI:
Most of Jassy’s time on the call was spent talking about AI investments. There are a few layers to the opportunity that he called out and we wanted to cover. First is the compute layer which ties closely into AWS (like most of the AI focus does). Amazon has been investing into its custom ML training chip set (Trainium) for years and sees this training large language models more cheaply and with more scale than what’s on the market today. Inference/prediction for AI app building is another key layer of AI utility. Like Trainium, Amazon has long been at work on building a custom chip for this use case (called Inferentia). Per Jassy, while training is the focus today, inference will take over as new applications are built like Chat GPT.
“The combination of price and performance you get from our chips is differentiated and very significant. We think that a lot of the ML training and inference will run on AWS.” -- CEO Andy Jassy
Somewhat similar to Microsoft Copilot, Amazon is now working on a generative AI tool called CodeWhisperer which automates code creation to expedite application building. Finally, Jassy talked about actual model creation. This takes years and billions of dollars to effectively execute. Amazon sees itself as one of the few companies making the investments to build a foundational set of models to build on top of. It intuitively calls this foundation “Bedrock.” Bedrock (through another tool called Titan) is how developers can pull from Amazon’s base models to customize on top of for more specific use cases. It’s how Amazon hopes to build standardized tools for the industry as AI use cases explode.
Macro:
Easing macro pressures in Europe facilitated the acceleration of international store revenue growth. Macro headwinds remain while consumer budgets continue to prioritize non-discretionary spend… but the backdrop is beginning to brighten. Amazon also called out the significant improvement in supply chain conditions as boosting purchasing and payment patterns and cash flow generation.
Advertising:
Amazon’s advertising revenue grew by 21% (23% FXN) as this segment continues to “buck overall trends.” Sponsored products and brands powered this growth. Amazon sees ample opportunity to increase ad load in things like Amazon Prime and grocery delivery. It’s very early days here for what should be quite high margin revenue.
Outperformance was attributed to Amazon’s world-class e-commerce traffic and ML investments making “ads perform unusually well for customers” per Jassy.
AWS:
Like every other cloud vendor, Amazon cited elongated sales cycles and cloud workload optimization from clients as being a material drag on AWS. Similarly to Microsoft, CEO Andy Jassy spoke on Amazon supporting its customers as they try to optimize as this is not forgone spend, just delayed spend. The structural tailwind, with 90%+ of IT spend still on premise, is fully intact; the short-term headwinds are holding this segment back. New customer pipeline “looks strong” which points to a potential re-acceleration of growth later in the year.
What was worrisome is Amazon telling us that growth slowed from 16% in Q1 to 11% in April. This would represent far faster deceleration than Azure guided to (about 25% growth) early in the week.
Fat Trimming, Margins & Strategy Shifting:
Amazon store and unit sales growth surpassed fulfillment expense and shipping costs as it overhauls its logistics network and cuts unnecessary costs. Amazon built an unprecedented amount of fulfillment capacity during the pandemic era and a last mile network the size of UPS in 2 years. This made operational precision quite difficult. With that demand pull forward ending, Amazon is now focused on morphing its national network into 8, more local regional networks. This will cut miles to fulfill, delivery times and costs. As an aside, this is exactly what Shopify is trying to accomplish through partners with its fulfillment product.
Amazon shuttered Amazon Fabric, Amazon Care and its bookstores recently to focus on higher conviction spend areas. It also cut free delivery for grocery orders over $35.
Key areas of future focus will be AWS and AI along with global expansion, grocery, B2B, entertainment, healthcare and satellites.
3rd party sellers represented 59% of Amazon’s unit sales vs. 55% YoY. This segment is generally more asset light than 1st party sales so this is a small margin tailwind.
Amazon sees a lot more efficiency-based work left to conduct. Its North American marketplace operating margin was 1.2% vs. 4%+ pre-pandemic. It sees itself getting back to that mark over time as it rationalizes the cost base and enjoys faster growth with easier comps and an easier backdrop.
7. CloudFlare (NET) -- Q1 2023 Earnings Review
a) Results vs. Expectations
Barely missed revenue estimates by 0.2% & barely missed its guidance by 0.1%.
Beat EBIT estimates by 62% & beat its guide by 60.3%.
Beat $0.03 EPS estimate by $0.05 & beat its guide by $0.045.
Met 78.7%GPM estimates.
Crushed -$8.3M FCF estimate by $22.2M.
b) Forward Guidance
Next Quarter:
Missed revenue guidance by 4.5%.
Beat EBIT estimate by 44%.
2023:
2023: Missed revenue estimates by 4.2% & lowered its revenue guide by 4%.
Beat EBIT estimates by 29.1% & beat its guide by 33.9%.
Beat $0.16 EPS estimates by $0.18.
Leadership was asked about the timeline to its goal of $5 billion in ARR changing amid the lowered 2023 outlook. It reiterated the long-term revenue guide.
c) Balance Sheet
Share count grew by about 2.1% YoY. Stock compensation was 21.3% of sales and over 400% of free cash flow.
$1.72 billion in cash & equivalents.
$1.4 billion in convertible senior notes; no traditional debt.
d) Call & Release Highlights
More Results Context:
CloudFlare’s 3-year revenue CAGR of 47% compares to 48.4% last quarter and 50.8% 2 quarters ago.
Dollar Based Net Retention Rate (DBNRR) fell to 117% vs. 122% QoQ & 127% YoY. This was due to sales cycle elongation and added budget scrutiny on expansion deals. This was not a matter of elevated churn.
CloudFlare now has 4.92 million developer apps running on its platform -- up 146% over the last 6 months.
CapEx was just 5% of revenue for the quarter. It’s supposed to be about 12% of revenue for the full year which likely means FCF will be lighter in future quarters. This quarter, it initiated a tax planning strategy which reduced its cash taxes and boosted FCF further.
Remaining Performance Obligations (RPO) rose 6% QoQ & 11% YoY to $959 million.
Revenue from AI companies grew 20%+ QoQ.
Go-To-Market:
CloudFlare leadership spoke at length about sales team performance. According to founder/CEO Matthew Prince, the company got complacent with talent quality in 2021. Macro tailwinds and its product suite meant unqualified sales personnel still performed very well. The services sold themselves. Fast-forward to today, and that’s no longer the case. Macro headwinds made the under-performers painfully obvious. It bluntly told investors that it is working on replacing these employees with more capable sales talent. Specifically, it’s firing 100 sales employees and replacing them as we speak. These 100 people represented under 4% of NET’s 2022 new business. Prince was highly critical of his team. Something we don’t see a lot from company executives and something that makes us uncomfortable.
“With the value of hindsight, I think we and most other businesses got a bit soft during the COVID crisis around performance management.” -- Founder/CEO Matthew Prince
The team was asked why it took them so long to uncover this issue. It didn’t. The timing of the news was instead a matter of changing labor market dynamics. The opportunity cost to replace an employee in 2022 was immensely high due to the tightness of labor supply. That has fully reverted with CloudFlare enjoying more job applications in Q1 2023 than it did all of 2021. The company is “committed to making the needed changes to become world class in sales productivity.” It sees its product suite as uniquely differentiated; it sees its go-to-market strategy as poor. Both are requisite pieces of building a sustainably successful business.
“We are not limited by our ability to innovate; we are not limited by pipeline; we are not limited by sales capacity… we are limited by our go-to-market performance.” -- Founder/CEO Matthew Prince
Macro:
Macroeconomic uncertainty accelerated well beyond what CloudFlare expected this quarter. It was perhaps too cavalier in its macro immunity assumptions when it offered its first 2023 guide. That led to it taking its medicine with a painful reset this quarter. We saw the same thing with GitLab last quarter and several other software names 2 quarters ago.
CloudFlare’s largest customer verticals are technology, financial services and e-commerce. These are three of the most challenged sectors in today’s economic backdrop. Furthermore, these are the customers with deposits exposed to recent banking issues. This drama weighed even more on its momentum per leadership. This was the first software company to cite that as a reason for poor results.
As an aside, its network security use cases have unsurprisingly proven to be more durable than its content delivery and distribution products.
The Negatives:
Macro headwinds “surprised” the team. They should have kept that to themselves.
Sales cycle elongated by 27% YoY -- far worse than expected.
Deal closing rates declined more than expected; less expansion deals along with less new logos than expected.
Back-end weighting of new business was well beyond expectations with 50% of its Q1 business closing over the last 14 days of the 90-day period. If this was the only issue, the revenue miss would have been a matter of quarterly timing and the annual guide would not have been lowered as much.
The Positives:
CloudFlare was able to flexibly adjust its cost base amid the revenue shortfall to deliver outperforming operating and cash flow profitability with a record EBIT margin.
New pipeline growth acceleration continued in Q1 2023. It “meaningfully exceeded pipeline plans for the second straight quarter.
Competitive win rates remain at record highs. This is direct evidence of the poor financial results not being a matter of product utility.
Churn rate remains at record lows. Again, this is not why DBNRR fell so sharply.
The main positive we saw from this report is how conservative the 2023 guidance has become. The new guide assumes that sales cycle elongation and close rates do not improve at all through the year. Specifically for Q2, the guidance assumes virtually no new business won from today to the end of the period. The guide only includes closed, guaranteed business. So? If anything but the worst-case scenario shakes out here, there could be upside. The guide offered last quarter was too rosy and optimistic -- if not naive. The guidance offered this quarter shows leadership taking a needed reset. This needs to be the kitchen sink quarter and we think it will. Importantly, it has seen no further macro-related deterioration so far in Q2.
Customer Wins Highlighted:
Fortune 500 media firm expanded from $1.3 million in annual spend to $2.1 million.
A “leading e-commerce firm in Europe” signed a new 3-year, $780,000 deal while displacing other Zero Trust network security competitors.
Fortune 1000 software firm signed a new 3-year, $8.4 million deal. No other competitor was able to meet this company’s regulatory and dynamic global compliance needs.
A Fortune 1000 retailer.
8. Visa (V) & Mastercard (MA) -- Card Rail Earnings & a Consumer Health Gauge
Between Visa and Mastercard, the two financial giants represent over $5 trillion in quarterly transaction volume. This makes them an excellent read-through to the overall health of the consumer.
a) Visa
Results:
Beat revenue estimates by 2.6%; 11% YoY growth beat its guidance by ~200 bps.
Beat EBIT estimates by 2.8%.
Beat $1.97 GAAP EPS estimates by $0.06 & beat $1.99 EPS estimates by $0.10.
Visa Guidance:
Via guided to 10%-11% next quarter revenue growth. This was in-line with consensus estimates calling for 10.6% growth. Growth next quarter will be helped by lapping the impact of exiting its Russia operations.
More Visa Context:
The 11% 3-year revenue CAGR compares to 9.5% last quarter and 8.3% 2 quarters ago.
Total cards rose 7% YoY and 2.7% QoQ to reach 4.23 billion.
It has bought back $5.3 billion in stock year to date (YTD) and has $11.8 billion left on the program. Its year-to-date dividends have grown 17% YoY.
Visa has $19.4 billion in cash & equivalents with $20.6 billion in long term debt.
b) Mastercard
Results:
Beat revenue estimate by 2%; beat ~9% YoY growth guidance by 290 bps.
Beat EBIT estimates by 2.7%.
Beat $2.71 EPS estimates by $0.09; Missed $2.71 GAAP EPS estimate by $0.24.
Mastercard Guidance:
Mastercard guided to roughly 12% growth next quarter vs. estimates calling for 12.9% growth. Like Visa, this will be assisted by lapping the impact of exiting its Russia operations. It also sees full year FXN revenue growth in the low teen percent range vs. roughly 12% as of its previous guide. This would have been 14.5%-15.5% YoY growth without the Russia impact.
More Mastercard Context:
Guided to ~12% next Q revenue growth vs. a 12.9% estimate.
3.16B cards in circulation vs. 3.11B QoQ & 2.90B YoY.
Bought back $2.9B vs. $2.4B QoQ & $2.4B YoY; Dividend grew by 13.8%.
12.8% 3-yr revenue CAGR vs. 9.8% last Q & 8.8% 2 Qs ago.
$6.6B in cash & equivalents; $15.3B in debt ($276M is current).
c) Visa and Mastercard Consumer Commentary
Visa:
Visa saw continued consumer resilience and spend growth throughout Q1. Still, that strength is beginning to fade as of April. So far in this quarter, U.S. payments volume growth slowed from 10% in Q2 to now 6% in Q3. Still relatively healthy, but less so than Q1. Visa expects this growth to remain stable through the quarter.
Visa attributed slowing to the following factors:
January-February benefited from weaker comps related to lapping the Omicron variant. March is when the benefit ended and is when growth began slowing.
Price cuts from U.S. retailers to work through inventory glut.
The end of higher tax refund benefits.
Other items to note include its cross-border travel index improving from an already robust 129 to an even more robust 134 this quarter. Furthermore, entertainment and services payment growth was notably strong but other discretionary spend buckets were weaker as budgets tightened. Finally, Asia travel is back above 2019 levels with China outbound and inbound travel returning quickly.
Mastercard:
Mastercard’s commentary was unsurprisingly similar to Visa’s, but perhaps a bit more upbeat. Its volume growth also was robust during the quarter and began to slow into April for the exact same reasons that Visa cited. Volume growth modestly slowed from 18% YoY to 17% YoY.
According to the company, “consumer spend remains healthy” and its base case assumes this remains the case. Its full year outlook was boosted a bit due to the strong first quarter.
9. Chipotle (CMG) -- Earnings Review
a) Results vs. Expectations
Beat revenue estimates by 2.6%.
Beat EPS estimates by 17.3%.
b) Forward guidance
Chipotle doesn’t offer formal financial guidance. It did, however, reiterate plans to open 255-285 new stores this year. It also told us to expect annual and next quarter comparable sales growth to be in the mid to high single digit range.
c) Balance Sheet
$409 million in cash & equivalents with another $652 million in investments.
No traditional debt; $500 million credit revolver; $3.5 billion in lease liabilities due to the make-up of its business model.
Repurchased $131.6 million in stock with another $282.3 million left on the program. It paid out $20 million in stock-based compensation.
d) Call & Release Highlights
Demand Context:
It now has 33 million rewards program members vs. about 28 million YoY.
Digital sales = 39.3% of food and beverage revenue vs. 37.4% QoQ.
Comparable restaurant sales rose by 10.9% YoY vs. guidance of just high single digit growth.
Opened 41 new locations with 34 having a Chipotlane.
Transaction trends remained strong into April.
Margin Context:
Margins benefitted from a combination of price hikes and avocado disinflation. These factors led to food, beverage and packaging costs being 29.2% of sales vs. 31% YoY. It expects the costs to stay around 29% of revenue next quarter. Leverage was partially offset by inflation across other food groups like dairy and rice.
Labor costs fell from 26.1% of revenue to 24.6% of revenue YoY with that reduction expected to be maintained next quarter.
Final Notes:
Employee turnover metrics were among the “lowest seen in 5 years.”
Updating its digital pickup workflow processes to boost throughput for in-person orders. These updates have worked thus far with testing locations.
Updated its app to alert customers when they’re driving to the wrong pickup locations. This is reducing refund rates early on.
10. Upstart (UPST) -- Auto, Macro & Lending Club
a) Auto
Mercedes-Benz picked Upstart Auto Retail as a digital retail partner for its dealers. It joins 8 other major manufacturers including Honda, Volkswagen, Toyota and Lexus. Upstart Auto retail makes the application process far easier and expedient. It also supposedly sharpens underwriting quality for dealers -- where loans are actually normally issued. This is a positive piece of news to confirm the product actually creates value.
In terms of how needle-moving this will be to near term results, not very. Funding supply for subprime auto loans is extremely limited at this point in time. That limitation will greatly cap volume growth for Upstart’s business segments while it exists. For the long-term potential, this is a positive raising the ceiling of what Upstart Auto Retail can become.
b) Upstart Macro Index (UMI)
Through 2021 and into 2022, Upstart pounded its chest on being immune to macro cycles. Fast forward to today and it now has a Macro index that it uses to inform partners about economic conditions. My how times have changed. The index for March improved a bit but remains in fragile territory. The improvement came from moderating inflation, rising consumer savings levels from “historic February lows” and rising labor force participation. Until this index and the exogenous backdrop improve a lot more (or until it locks in committed long term funding), Upstart’s growth will be handcuffed by a lack of funding supply.
c) LendingClub
LendingClub’s results were very good. LendingClub’s credit demo skews more affluent than Upstart’s. This is not a reliable read through to Upstart’s quarter. It’s a slightly better hint for SoFi’s upcoming results.
d) Cross River
Finally, Cross River received a cease and desist letter from the FDIC on its lending practices. This is one of the main origination conduits for Upstart tapping into capital markets. Luckily, there are many, many Cross Rivers out there. The challenge is getting capital markets to assume the balance sheet risk, not getting a conduit to originate and immediately sell for a small fee and 0 financial risk.
11. Final Market Headlines:
Apple got a positive court ruling on its app store practices and fees being lawful. Still, based on this, it will need to allow apps to plug into alternative payment providers which would allow them to sidestep Apple’s hefty take rate.
Buzzfeed news sadly shuttered its operations this past week. According to the company’s CEO, it didn’t come to terms with mega cap tech names being as aggressively competitive as they’ve proven to be. They didn’t anticipate these players making distribution and app store fees as difficult as they have. Yet another argument for The Trade Desk’s open internet targeting superiority and reporting objectively being desperately needed by the world.
Olo and Adyen are partnering to allow restaurants to “consolidate digital and in-store payments, apply for capital, access faster payment settling and manage cash flow.” Olo Pay customers will gain integrated access to Adyen’s platform capabilities. Eventually, this partnership will include business card issuing.
Uber added Little Caesars to Uber Eats. That’s the 3rd largest pizza chain globally. Pizza, Pizza.
12. Macro
Inflation Data:
Core Personal Consumption Expenditures (PCE) Index was 4.6% YoY in March vs. 4.5% expected and 4.7% last month.
Core PCE Index was 0.3% month over month (MoM) in march. This met estimates and is vs. 0.3% last month.
PCE Index was 0.1% MoM in March vs. 0.3% expected and 0.3% last month.
PCE YoY was 4.2% in March vs. 5.1% last month.
Housing Data:
Building Permits came in at 1.43 million vs. 1.413 million expected and 1.55 million last report.
New Home Sales for March came in at 683,000 vs. 630,000 expected and 623,000 last month.
Pending Home Sales MoM for March shrank 5.2% vs. expectations of 0.5% growth and 0.8% growth last month.
Output Data:
Core Durable Goods Orders MoM for March grew by 0.3% vs. expectations of 0.2% shrinkage and 0.3% shrinkage last month.
Durable Goods Orders MoM for March rose 3.2% vs. expectations of 0.7% growth and -1.2% growth last month.
Q1 GDP grew 1.1% vs. expectations for 2% growth and 2.6% growth last quarter.
Chicago Purchasing Managers Index for April was 48.6 vs. 43.5 expected and 43.8 last month.
Consumer & Employment Data:
Conference Board (CB) Consumer Confidence for April came in at 101.3 vs. 104 expected and 104 last month.
Jobless Claims were reported at 230,000 vs. 248,000 expected and 246,000 last report.
Personal spending was flat MoM for March vs. expectations of -0.1% growth and 0.1% growth last month.
The Michigan Consumer Expectations reading for April was 60.5 vs. 61.8 expected and 60.3 last month.
The Michigan Consumer Sentiment reading for April was 63.5 vs. 63.5 expected and 63.5 last month.
5 Year Breakeven Inflation Fell This Week:
High Yield Option Adjusted Corporate Credit Spreads Improved This Week:
13. My Activity
I added to Uber this week and trimmed a bit of Meta following the earnings spike.
News of the Week (April 24 - 28)
Thanks as always Brad!
I think you said something about format the other week? I like your format, I can see from the heading what’s in there and if I want to skip to certain spots I can. Keep up the good work!