

News of the Week (April 29 - May 3)
News of the Week (April 29 - May 3)
DraftKings; Mercado Libre; Lemonade; Block; Coinbase; BIll.com; Super Micro; AMD; Pinterest; Uber; The Trade Desk; Crowdstrike; Match; Macro; Portfolio

1. DraftKings (DKNG) – Earnings Review
a. Demand
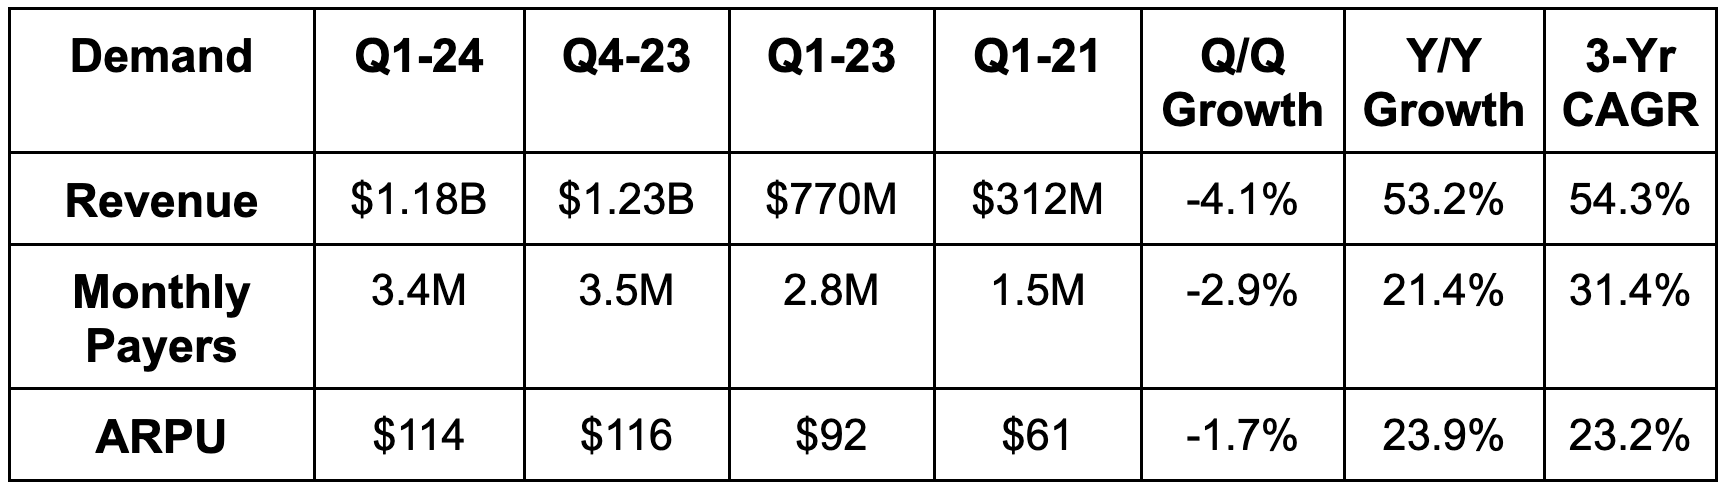
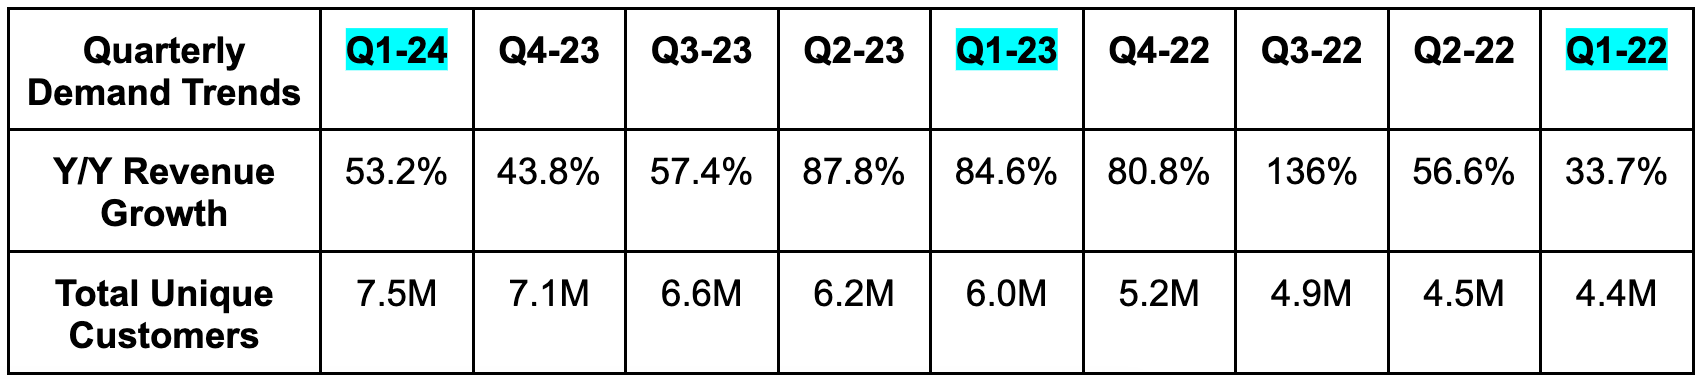
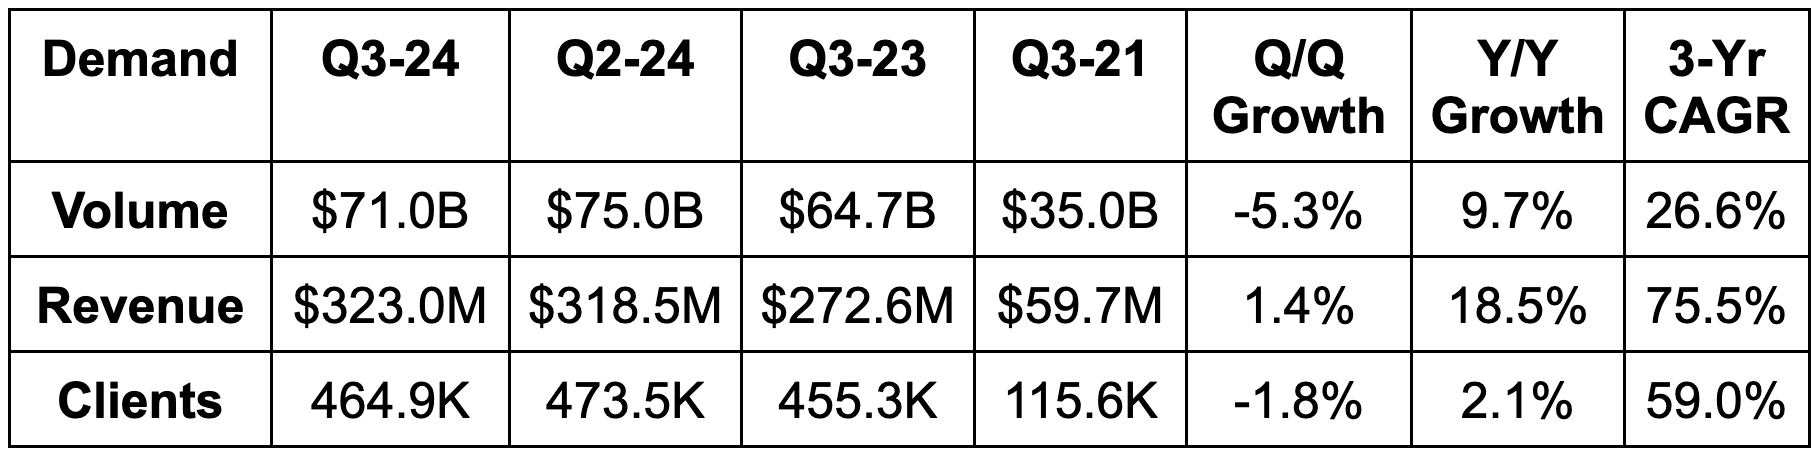
DraftKings met analyst revenue estimates. Its 54.3% 3-year revenue CAGR compares to 56.3% last quarter and 81.2% 2 quarters ago. A lot of DraftKings growth comes from an expanding footprint of legal gambling states. Vitally, its 2018-2022 state cohort is still growing at a 40% Y/Y clip. This indicates a long growth runway, especially considering there’s a large black market market share in the oldest legal states.
b. Profitability & Margins
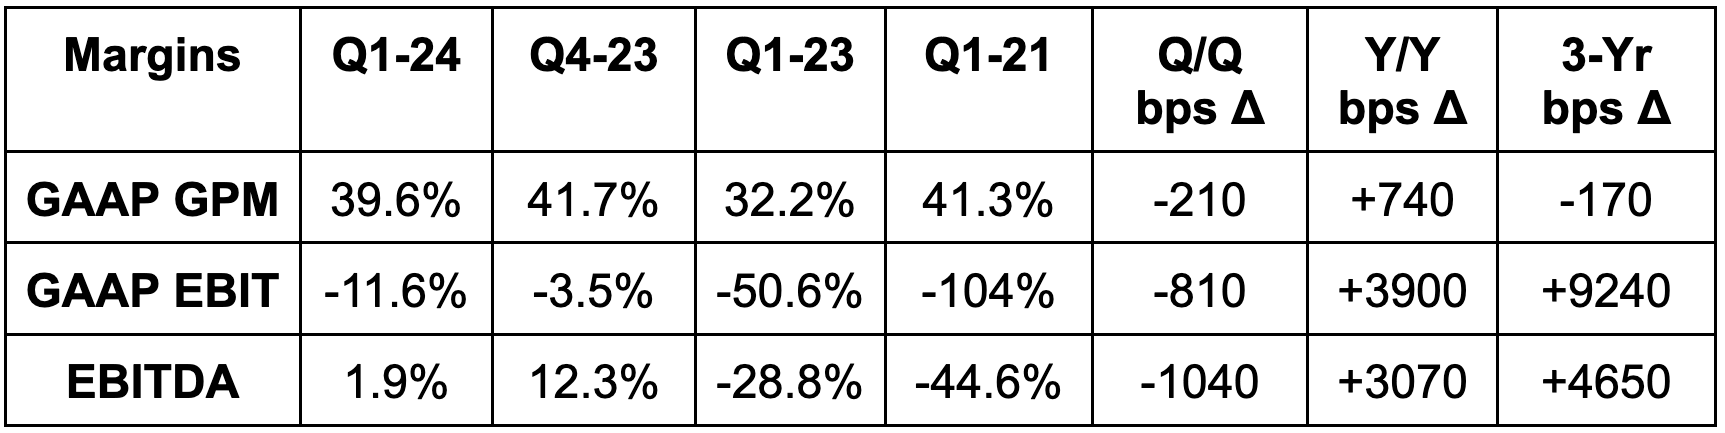
Beat GAAP EBIT estimates slightly.
Beat $4M EBITDA estimates by $18M. It posted a 60% incremental EBITDA margin for the quarter.
Beat -$0.11 EPS estimates by $0.14. Surprise positive EPS quarter.
Missed GAAP GPM estimates.
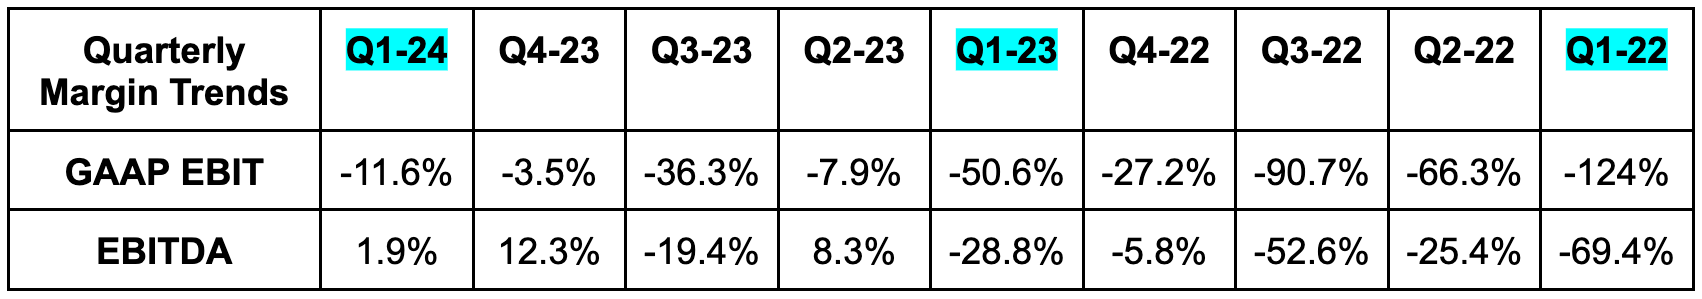
Note that margins for this business are highly seasonal. Focus on Y/Y comps.
c. Balance Sheet
$1.2 billion in cash & equivalents.
$1.25 billion in convertible senior notes.
No traditional debt.
Share count rose by 4.2% Y/Y. Not ideal, not terrible, but still my least favorite part of the great report. The team did cite ramping free cash flow (FCF) confidence as a signal to likely initiate a buyback in the coming quarters.
d. Annual Guidance & Valuation
Guidance does not yet include its Jackpocket online lottery acquisition.
Raised revenue guidance by 2.6%, which beat estimates by 2%.
Raised EBITDA guidance by 4.2%, which beat estimates by 2.8%.
Reiterated 46% adjusted GPM guidance.
Sees $400 million in 2024 FCF generation.
Sees 25% Y/Y revenue growth for Q2 and 30% growth in Q3 and Q4.
Sees $150 million in Q2 EBITDA, $0 in Q3 EBITDA and more than $325 million in Q4 EBITDA. (again, highly seasonal)
DraftKings is currently inflecting to profitability across all relevant metrics. It trades for 94x 2024 earnings, 30x 2025 earnings and 18x 2026 earnings. It trades at a 2024 PEG ratio (using 2-year compounded earnings growth) of 0.75x.
e. Call & Release
A Blue Chip Brand Emerging:
Sports gambling has extremely low switching costs. The products are relatively similar and the opportunity for competitive differentiation is not abundant. That leaves the potential for spending a fortune on customer acquisition just to lose an established customer to another app. Despite this, DraftKings continues to show clear signs that differentiation is present. Sales and marketing spend again declined by 11% Y/Y, while its overall market share of sports and iCasino rose from 27% to 31%. Its customer acquisition cost (CAC) plummeted by another 40% Y/Y. If this product were purely a commodity, pulling all of that off would be close to impossible. DraftKings has achieved this for several quarters in a row. How is this happening?
I think there are several small factors adding up to something more material. First, the brand has better awareness than anyone else in the space besides ESPN and maybe Flutter’s FanDual. Its online gambling footprint is among the most broadly spread in the USA, which enables more efficient marketing and CAC. Its app interface is also (in my view) on par with FanDual’s for the two best in the market.
Its parley options are as broad or broader than anyone’s in the market, which means happier customers and a more profitable DraftKings. Its pricing and modeling algorithms are also well seasoned with more data than most competitors. This allows DraftKings to offer better uptime vs. substitutes, which is highly important for lucrative categories like live betting. Better data also allows DraftKings to personalize the customer experience more granularly while perfecting back-end processes. Competition can easily emulate and copy a front-end interface. It’s much harder to copy back-end optimizations on user experience, hold rate and engagement as those aren’t visible. Finally, its tech stack vertical integration provides a compelling cost edge.
None of these items seem monumental in isolation, but the data is telling me that the combination is forming the beginnings of a moat.
Cost Discipline from Here:
As already mentioned, DKNG just raised profit targets again. It sees more upside to payments leverage than previously assumed and sees ample opportunity for AI-powered efficiency gains. Margins will keep expanding even through expected increases in overall OpEx. This cost growth is a response to improving marketing payback periods, which unlocks more opportunities to spend.
Sources of Outperformance:
Stronger than expected customer acquisition, retention, and engagement all powered the firm’s Q1 outperformance. Its hold rate of 9.8% also beat expectations and led to the firm raising 2024 hold rate assumptions from 10.25% to 10.5%. That’s the byproduct of its more compelling parlay menu, and more average bets per parlay. It sees more upside here in the coming years. For profits, better-than-expected marketing efficiency drove the success. The outperformance during the quarter was despite abnormally favorable gambler outcomes. This cost DKNG $60 million in revenue and $42 million in EBITDA for the full year guide. It raised guidance despite this headwind.
Cross-Selling:
One of the best ways to drive retention and lifetime value is via cross-selling. The main opportunity here will be more states legalizing iCasino, but its proposed Jackpocket acquisition provides another outlet in the lottery market. It will also be able to market its current offering to that firm’s 700,000+ users (with a bit of customer overlap, I’m sure). Cross-selling means more revenue without commensurate customer acquisition costs. It means lower marketing intensity and higher quality revenue. It helps everywhere.
New States, Footprint & Regulation:
The Vermont and North Carolina debuts went very well. CAC was strong and both states will turn EBITDA positive by the second half of this year. That inflection will come much more quickly than for previous states as DraftKings perfects go-to-market.
DraftKings is live in 25 states (49% of population) for sports gambling and 5 states (11% of the population) for iCasino. It’s in Ontario (40% of Canada) for both. There are 9 states (11% of the population) considering sports gambling legalization and 5 states (12% of the population) for iCasino. The rate of sports gambling legalization is set to slow, with just 3 additional states representing the vast majority of the remaining opportunity. Texas, one of the three big stragglers, should vote on legalization in 2025. The need for more tax revenue is only increasing… legalization throughout the nation is all but inevitable.
DKNG’s daily fantasy products are a great way for it to build early market share in states that haven’t legalized. For example, its new Pick 6 product is performing well in Texas and familiarizing bettors with the brand.
Robins was asked about potential tax rate increases in some states. He sees that as possible only in a couple of them and thinks most realize raising rates will simply push more people to the black market. He also thinks the company can offset higher taxes with lower marketing spend, but that negative trade-off could impact demand levels.
f. Take
I thought this quarter was fantastic. Anyone disagreeing is likely just looking at how the stock reacted. There’s nothing in here to fundamentally pick at.
2. Mercado Libre (MELI) – Earnings Review
Mercado Libre is an e-commerce, logistics and payments giant in Latin America with a quickly broadening product offering.
Note that Meli made a series of changes to reporting disclosures starting this quarter. I used the old method of disclosing in the charts for fair comps (with reconciliation included). First, Mercado Pago Interest Income and Expense was moved from below the EBIT line to above it. For its shipping business (Mercado Envios) it changed its position from an agent to a principal. Previously, it netted shipping costs out of gross revenue. Now, it reports revenue as gross revenue and puts shipping expenses in cost of revenue line. Finally, it removed peer-to-peer volume from total payment volume (TPV). I’ll cite the impact of these changes throughout the piece.
a. Demand
Meli crushed revenue estimates by 11.9%. It dealt with violent Agentinian FX headwinds during the quarter, but the team got out in front of this with the street and properly set itself up for another quarter of outperformance. Its 46.4% 3-year revenue CAGR compares to 47.4% Q/Q & 49.7% 2 quarters ago.
Excluding aforementioned changes in reporting disclosures, revenue grew by 30% Y/Y.
Brazil revenue rose by 44% Y/Y excluding changes and 57% Y/Y overall.
Mexico grew by 55% Y/Y excluding changes and 59% Y/Y overall.
Argentina fell by 19% Y/Y excluding changes and fell 22% overall (Hyperinflation & currency devaluing).
Commerce revenue rose by 31% excluding the changes and rose 49% overall.
Fintech rose by 28% excluding the changes and rose by 22% overall.

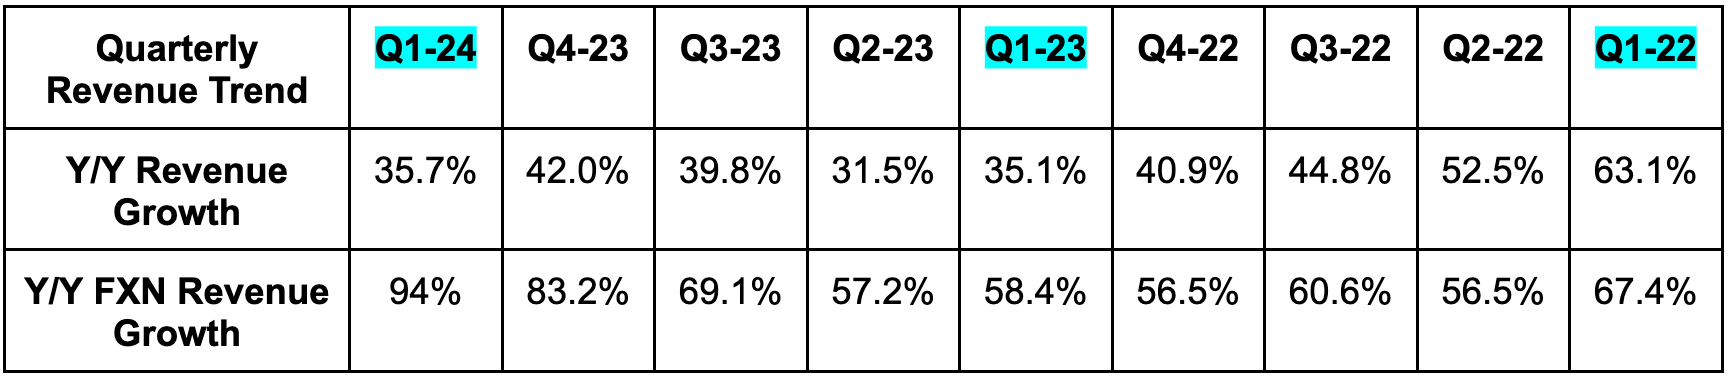
TPV growth and GMV growth were 86% Y/Y and 71% Y/Y FXN respectively.
b. Profitability & Margins
Beat EBIT estimates by 7.9%.
Beat $5.95 EPS estimates by $0.83.
Had I used this new method:
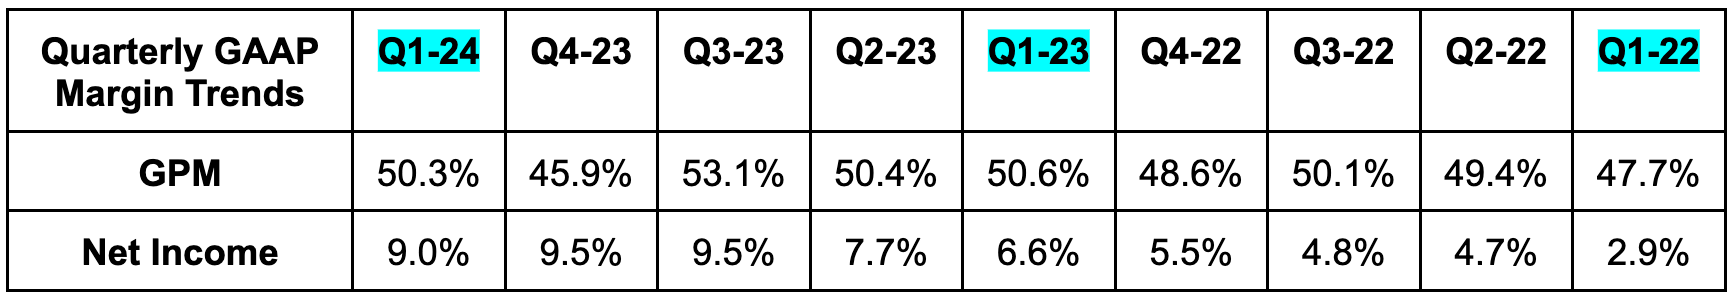
Excluding changes, GPM would have been 46.7% for this quarter vs. 50.7% Y/Y.
Excluding changes, EBIT margin would have been 12.2% vs. 13.1% Y/Y.
Excluding changes, EBIT rose by 44% Y/Y and 26% Y/Y overall.
Excluding changes, net income margin would have been 7.9% vs. 6.3% Y/Y.
Operating leverage was enjoyed across all three operating expense (OpEx) buckets and every single geography besides Argentina.

c. Balance Sheet
$6.2B in cash & equivalents.
$5.3B in debt.
Shares fell 1% Y/Y.
d. Valuation
Meli trades for 49x 2024 GAAP EPS. EPS is expected to grow by 75.8% Y/Y.
e. Call & Release
Argentina:
The FX headwind this quarter was about as pronounced as you will ever see it. While Argentina volume rose by 214% Y/Y, real growth was negative due to foreign exchange. That country is undergoing a painful economic reform as we speak. I actually think that the reform will turn out to be a structural tailwind for MELI as their government slashes regulation and promotes private enterprise growth. It will just take time. Even now, MELI sees pain as a relative boost to its operations there, as it’s able to weather the storm better than its competition can.
Commerce:
MELI continued to enjoy rapid, 30%+ FXN commerce growth in Brazil and Mexico. Items sold growth was also strong at 32% in Brazil and 28% in Mexico. As it scales, the company keeps enjoying happier customers with its Net Promoter Score (NPS) setting new highs. While this is not an irrelevant datapoint, it is somewhat noisy due to the abstract, internally derived nature calculations. 5 different companies can measure it 5 different ways. Conversion rates rose with broadening selection, unique buyers rose by 18%+ across all markets, new cohort retention is strengthening… This segment is rocking. Take rate also continued to rise from 17.8% to 22.0% Y/Y thanks to flat shipping fee changes and advertising. Strong demand and a larger piece of the pie is a great combination.
Debuted split payments to allow customers to purchase goods with more than one payment method.
Mercado Pago’s checkout gateway penetration continues to rise.
Items sold per buyer rose to 7.2 vs. 6.7 Y/Y.
53.5 million unique active buyers vs. 46.1 million Y/Y.
Meli + (loyalty program) delivered expected engagement, volume and retention advantages once again. One newer perk called Meli Delivery Day allows members to select one day of the week to receive free shipments. Uptake here has been stronger than expected, which is weighing on same-day delivery rates and fulfillment contribution margins just a tad. That’s a trade-off the company is more than happy to make.
Logistics:
Late deliveries reached record lows and speed of delivery set record highs despite Meli delivery day. Meli’s fulfillment penetration, which represents the proportion of orders it fulfills itself, rose from 44% to 52% Y/Y. Vitally, cost per order is stable Y/Y as it closes the gap between Meli-fulfilled margins compared to using 3rd parties. Investments to build out the fulfillment network will be relatively stable in 2024 vs. 2023 as it will keep growing the footprint like it’s “business as usual.” These continued investments and more free shipping are why shipping costs rose 60 bps as a percent of GMV Y/Y. It’s happy to use these services as lower margin loss leaders to drive customer delight and more engagement.
Advertising:
Advertising revenue rose 64% Y/Y to reach 1.9% of GMV vs. 1.4% Y/Y. This is high margin revenue and, like for Amazon, proliferation here will be fantastic for overall profitability. It continues to add new formats and grow ad-load, but it’s still early days here. Plenty of growth left to come as it consistently releases targeting algorithm upgrades to juice value per impression. To date, most of this revenue is coming from product advertising, but it sees brand advertising traction rising in the coming years. This quarter, demand for relevant Mexican cross-border placements was the standout.
Fintech:
The Mercado Pago fintech platform is doing very well. User growth accelerated from 32% Y/Y last quarter to 38% Y/Y this quarter. Take rate rose from 3.7% to 4.5% too. Retention, engagement, cross-selling and everything else about this bucket came in strong. Specifically, it saw insurance policies rise from 8.1 million to 11 million and saw overall assets under management (AUM) rise 90% Y/Y. Its savings product launch in Brazil was noted as a key piece of this momentum. That will be going head to head with Nu Bank (and all other banks in the nation).
49 million fintech MAUs vs. 35.6M Y/Y.
Credit Underwriting:
Credit originations rose 71% Y/Y, the overall credit portfolio rose 46% Y/Y to reach $4.4 billion and Meli issued 1.5 million new cards to drive 173% FXN TPV growth. Meli remained encouraged by Brazilian and Mexican credit health and so continues to accelerate growth here.
Net interest margin after losses (NIMAL) is the highly important margin line to focus on. It fell sharply Q/Q to 31.5%, but rose on a Y/Y basis from 30.6%. The sequential decline is also not concerning, as it’s related to credit cards growing as a percent of the total portfolio from 22% to 35% Y/Y. Cards come with lower NIMAL than its lending products.
17.9% 90+ day non-performing loan (NPL) rate vs. 18.7% Q/Q and 28.2% Y/Y (lower is better). Provision coverage was 156% vs. 133% Y/Y (higher is better). The improvements here were helped by writing off a large chunk of delinquent loans last quarter.
9.3% 15-90 day NPL rate vs. 8.2% Q/Q and 7.8% Y/Y. This was hurt by Easter (fewer collections) and also leaning into more originations, which it thinks it’s pricing effectively.
Interestingly, provisions for doubtful accounts rose 70 bps as a percent of total credit revenue. This is partially due to Argentina boasting lower comparative provisions and a mix shift away from that country. Acceleration of originations drove the rest of the rise.
Acquiring (Mercado Pago Checkout):
TPV grew in all regions including Argentina in real terms. Acquiring TPV was $30.6 billion vs. $24.3 billion Y/Y.
Debuted a new Point Smart 2 point of sale (POS) system with longer battery life for larger merchants.
Device-free tap-to-pay solution grew sellers by 63% Y/Y.
Logged online payers rose 35% Y/Y.
f. Take
This was a phenomenal quarter in a uniquely dynamic Latin American operating environment. Like for DraftKings, I do not see anything to pick at. Only continued profitable compounding to praise and shareholders to congratulate. Meli earned every single bit of the 10%+ positive share price reaction. And while we don’t overly focus on these reactions… that doesn’t mean you can’t enjoy them. That is the beauty of long term investing. Thriving company sees its stock rise? Cool, your position is worth more. Thriving company sees its stock fall? Cool, risk/reward is becoming more compelling.
3. Lemonade (LMND) – Earnings Review
Lemonade is an insurance technology company trying to disrupt the gigantic legacy industry. Its tech native infrastructure is used to cut out traditional costs from the model while making claims and onboarding painless processes.
a. Demand
Beat In Force Premium (IFP) guidance by 0.5%. Its 64% 2-year revenue CAGR compares to 67.8% last quarter and 79% two quarters ago.
Beat gross earned premium (GEP) guidance by 2.2%.
Beat revenue estimate by 5.0% & beat guidance by 6.3%. Please note that reserve releases/adjustments helped the revenue beat a bit this quarter as loss rate assumptions improved a tad. This is a nearly identical idea to credit reserve level adjustments for lenders. Ceded reinsurance premium commission favorability and net interest income helped too. Net interest income should become an increasingly important part of this business as the cash pile starts to grow.
A more complete product suite across states is powering the stronger dollar retention gains.
Premium per customer growth was driven by rate increases. It was not driven by a mix shift like it has been in the past, as Lemonade has not leaned into higher premium buckets just yet. Auto is the main example, but this is still true for home insurance too.


b. Margins & Profitability
Beat EBITDA estimates by 17% and beat guidance by 20%.
Comfortably beat GAAP net loss & gross profit margin (GPM) estimates. Different sources have different figures for estimates, but Lemonade beat them all.
OpEx rose by just 2% Y/Y.
Other insurance expenses rose 27% Y/Y as it ramped regulatory requests for premium rate updates.
G&A fell 9% Y/Y due to headcount reductions. R&D fell 4% Y/Y.
Gross margin was also better than expected thanks to loss ratio declines.


c. Balance Sheet
$927M in cash & equivalents; its cash pile fell by just $18M Q/Q as it has rapidly removed any liquidity risk. This is due to strong execution, but also the creative synthetic agent program we frequently discuss (section nine of this article introduces the idea).
No debt.
Diluted shares rose by just 1.3% Y/Y. That is quite modest compared to the rest of the pre-buyback coverage network.
d. Annual Guidance & Valuation
Reiterated IFP guidance.
Slightly raised GEP guidance.
Raised revenue guidance, which beat estimates by 0.5%.
The size of the revenue guidance raise was smaller than the revenue beat. This is due to the aforementioned reserve release that helped results and will not recur throughout the year.
Raised EBITDA guidance, which beat estimates by 4.7%.
Sees 1.1% diluted share growth from now to the end of 2024.
At Lemonade’s investor day in 2022,, it laid out its path to profitability, which it has since accelerated multiple times. But? It hadn’t revised its long term IFP rate of compounding beyond 25% annually. Here’s what Co-CEO Shai Winninger had to say about that this quarter:
“While we're not revising this target today, we may accelerate our [IFP] growth rates as new incremental growth opportunities come along.” – Co-CEO Shai Winninger
Wink, wink.
e. Call & Letter
Proof of an Edge:
For years, Lemonade has been arguing that its tech-native, AI-first, cohesively-designed infrastructure and app form its edge. It has been telling investors that its ability to ingest and utilize the vast sums of data that it receives help it stand out. It has been explaining how legacy incumbent systems are too manual, too siloed and too entrenched for competition to appropriately utilize data scale advantages… with it also being too costly for them to rip and replace systems. And? It has been insisting on this set-up powering immediate claim handling, compelling unit economics, and the beginnings of a giant corporation.
We're starting to see real proof beyond internal NPS claims and asserting that its underwriting models are better. Proofpoint number one is the wonderful loss ratio trends that we’re now seeing play out:
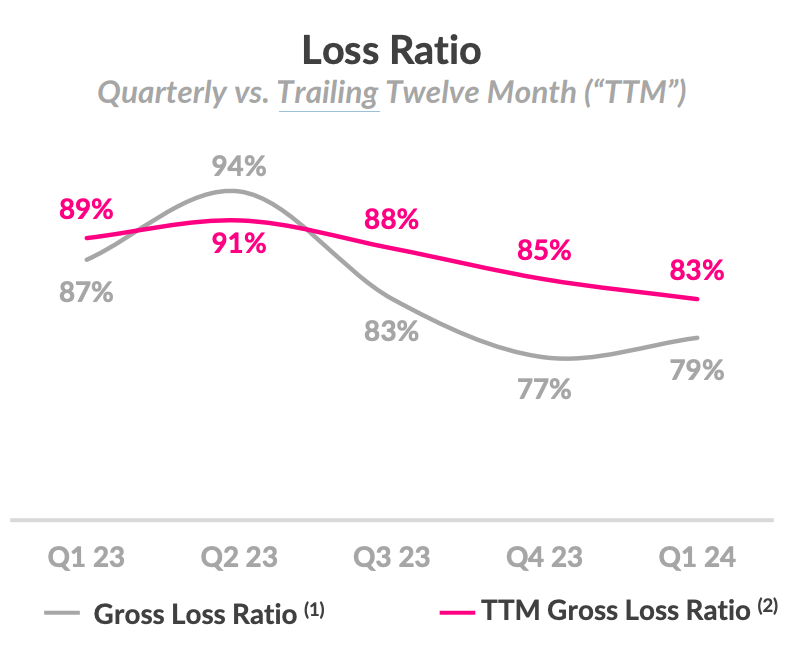
For the chart above, focus on the trailing 12 month improvement more so than the gray line. Weather and catastrophic (CAT) events are seasonal; looking at annualized progress helps to eliminate this noise. The main source of improvement here was encouragingly not CAT event favorability. Instead, it was premium rate filing approvals and its discipline to wait out these approvals before it leaned back into originations. It wasn’t willing to originate cash-burning plans for the sake of growth. With approvals coming in for key states like California, growth opportunities are becoming profitable once again (more on this later). Excluding CAT events, a 63% GLR improved 10 points Y/Y and 9 points Q/Q to offer more proof of this improvement being structural in nature.
Proofpoint number two is a favorable cost to serve vs. others. Insurance is a commodity. Lemonade does stand out within customer service and app interface, but the best way to differentiate within insurance is via cost advantages. Lemonade offered new disclosures showing its advantage in these areas. Loss Adjustment Expense (LAE) measures cost associated with handling claims and operating efficiency. It’s one thing to say Lemonade’s tech-native ecosystem offers cost edges. It’s another thing to show it in LAE. Per Capital IQ, a typical LAE is about 10% for a mature brand with fully realized economies of scale. Lemonade is far from mature, yet boasts an LAE of 7.6% (lower is better). The compelling trend is expected to continue.

This is intuitive. It has no agents to pay perpetual commissions to; its real estate footprint is comparatively tiny.x Its AI-first product suite automates a large chunk of claims and customer service responses… and that automation frees Lemonade to grow its business while avoiding costs scaling in tandem. The margin trend charts above are the evidence as OpEx growth stays near 0% and the business expands. Lemonade is forming a defensible, structural competitive advantage in a sector where that’s tough to pull off.
Where else does an overall cost- to-serve edge help? I’m so glad you asked. It allows Lemonade to rationally undercut competition, boost growth spend or simply harvest more margin from its book of business. It already offers best-in-class rates on renters insurance; lower fixed costs allow Lemonade to rationally pursue these tiny premium plans. That has made Lemonade a share leader for young, first-time U.S. renters. These customers will need much more insurance over time, and Lemonade’s customer delight gives it a great chance of securing that added business.
Net Cash Positive:
Lemonade moved up its schedule to net cash flow from early 2025 to late 2024. Net cash flow is not free cash flow. It benefits heavily from the synthetic agent program (no idea what this means). FCF and EBITDA will likely come in by the end of next year, per the team. They love to set targets that they know they can consistently beat… like every public market team should.
While this isn’t FCF, net cash flow is still highly important. It means the end of consistent cash drain on the balance sheet, and will embolden Lemonade to get more aggressive with growth while harvesting more net interest income.
Growth:
This was the quarterly low point for external growth spend in 2024. That spend will ramp steadily throughout the year as rate update approvals flow in and its unit economics fatten. For Q1, growth spend rose 14% Y/Y to reach $19.8 million. Synthetic agents financed 80% of this. It still incurs the expense on the income statement when synthetic agents foot the bill, but not on the cash flow statement or balance sheet. This is why the net cash flow inflection will come several quarters before the EBITDA inflection.
Premium Rate Filing Approvals:
As a review, inflation stinks for insurers. It means claims are immediately becoming more expensive, while carriers in the U.S. (not Europe) must get regulatory approvals to update premiums. Those approvals flow in quite slowly and lag increasing claim costs. Lemonade now feels like it has “crested the hill” on approvals. The pace is quickly ramping compared to a few quarters ago, and, while it’s still awaiting more progress, a large chunk of it has now been realized. “The worst part” of regulatory delays is now over.
Importantly, it has secured a few vitally needed premium increases in California, which has been the toughest state to grant them. This will allow Lemonade to accelerate originations there, including in home insurance, while many other competitors have pulled out of that market altogether. Great setup. It’s worth noting that some of these regulatory delays were self-inflicted. Lemonade didn’t have the team or systems in place to rapidly file these requests as inflation began to rage. It had to play some catch up, but has committed to not falling behind again. All of the needed assets to keep up with price fluctuations are in place.
“We’ve finally seen rate approvals start to move at a more healthy pace in larger markets.” – Co-CEO Daniel Schreiber
Auto:
Lemonade is still in model perfecting and process fine-tuning mode for auto. It really hasn’t revved the engine (couldn’t resist) here just yet. That should happen in early 2025. Loss ratios are rapidly improving, telematics miles driven are scaling and rate filings are beginning to come. The team was asked if a successful auto business was reliant on 2% inflation. They quickly said “no”. Additionally, they were asked if they’ve seen any worsening in the competitive environment like some others have cited. Again, “no.”
Reinsurance:
Negotiations for upcoming reinsurance contract negotiations are ongoing. I’d think these terms can improve a little bit for Lemonade, considering the more diverse nature of its book and improving loss ratio trends. We’ll see.
f. Take
Flawless quarter. The company continues to manage growth and margins better than any young, $1 billion enterprise should be able to. It’s showing you rapid leverage, moving up profitability targets, accelerating growth, eliminating liquidity concerns… yet still hasn’t leaned back into high return external marketing. At $330 million enterprise value and about 2.0-2.5x 2024 gross profit, this is my favorite moonshot in public markets. If it ever makes any money, it should work very well; signs of that happening are becoming crystal clear. Fantastic, encouraging, conviction-inspiring report. Well done to a team that has taken a remarkable amount of retail criticism/heckling in stride. They took the high road and showed you they mean business.
4. Earnings Roundup – Block (SQ); Coinbase (COIN); BIll.com (BILL); Super Micro (SMCI); AMD (AMD); Pinterest (PINS)
In typical earnings seasons, Block and AMD would’ve been full reviews. This earnings season has been a bit more concentrated than they usually are. With 14 companies in the coverage network reporting this week (7 on Thursday), I simply did not have enough hours in the day. I plan to put together reviews for both after peak earnings (likely mid-may). I also plan to dig into that Starbucks (SBUX) quarter to figure out what the heck happened there. Cutting EPS growth guidance from 18% to 3% is ugly to say the least for the coffee giant.
a. Block (SQ)
Results:
Beat revenue estimates by 2.4%.
Beat EBITDA estimates by 19.9% & beat guidance by 21.6%.
Crushed GAAP EBIT estimates.
Beat $0.73 EPS estimates by $0.12.


Guidance & Valuation:
Raised gross profit guide by 1.5%.
Raised EBITDA guide by 4.9%.
Block trades for 20x EPS and 45x GAAP EBIT. EPS is expected to grow by 81% Y/Y and GAAP EBIT will inflect.
Balance Sheet:
$6.2B in cash & equivalents.
$4.1B in debt.
Diluted shares +2.2% Y/Y.
b. Coinbase (COIN)
Results:
Beat revenue estimate by 22%.
Doubled GAAP EBIT estimate.
Crushed $1 GAAP EPS estimate by $3.40. Coinbase enjoyed a $737 million mark to market gain from its crypto assets. Without this help, it would have beaten by $1.65.


Balance Sheet:
$6.7B in cash.
$4.2B in debt.
Diluted shares +16% Y/Y. This has been a consistently poor trend for Coinbase.
c. Bill.com (BILL)
Results:
Beat revenue estimate by 5.6% & beat guide by 6.3%.
Beat EBIT estimate by 48%.
Beat $0.53 EPS estimate & beat same guide by $0.07.

Q4 2024 Guidance & Valuation:
Revenue beat by 0.6%.
EBIT beat by 9.0%.
EPS missed by $0.09.
Bill trades for 27x EPS and 26x FCF. It is now expected to turn GAAP EPS positive for three more years. EPS is expected to grow by 34% Y/Y with FCF expected to grow by 24% Y/Y.
Balance Sheet:
$1.8B in cash & equivalents.
$966M in notes.
Basic shares -1.1% Y/Y; diluted shares +4.3% Y/Y.
d. Super Micro (SMCI)
A bit of context is needed here. SMCI has trained analysts to expect historically massive beats and raises throughout the last year. That leaves the bar for outperformance ridiculously high. This setup was the polar opposite of Tesla’s. It beat & raised by a still solid amount… it was just a more normal amount.
Results:
Missed estimate & missed same guide by 1.3%.
Beat $5.57 EPS estimate by $0.88 & Beat guide by $0.85.
Beat 15.3% GPM estimate by 30 bps.


Annual Guidance & Valuation:
Raised revenue guide by 2.7%, which beat estimate by 2.1%.
$22 GAAP EPS guidance beat by $2.37.
$23.70 EPS guide beat by $1.85.
SMCI trades for 24x 2024 earnings. Earnings are set to double this year. The firm operates in a cyclical industry. This is the fun part of the cycle. It all comes down to how long this fun part lasts.
Balance Sheet:
$2.12B in cash & equivalents.
$1.86B in debt & notes.
Diluted shares +9% Y/Y (there was an offering).
e. AMD (AMD)
Results:
Beat revenue estimate by 0.4% & beat guide by 1.3%.
Beat 52% GPM estimate & beat same guide by 30 bps.
Met EBIT estimate.
Met EPS estimate.


Next Quarter Guidance & Valuation:
Guidance was exactly in line across the board.
AMD trades for 36x 2024 earnings with earnings expected to grow by 33% Y/Y to reach 2022 levels.
Balance Sheet:
$6B in cash & equivalents; inventory down slightly Y/Y.
$2.5B in total debt.
Share count rose slightly Y/Y.
f. Pinterest (PINS)
Results:
Beat revenue estimate by 5.7% & beat guide by 6.0%.
Beat -$86M GAAP EBIT estimate by $32M.
Beat EBITDA estimate by 54%; beat $0.13 EPS estimate by $0.07.


Guidance & Valuation:
Revenue guidance is 1.8% ahead.
Balance Sheet:
$2.7B in cash & equivalents.
No debt.
Shares fell slightly Y/Y.
5. Uber (UBER) & Domino’s (DPZ) – Domino’s Earnings
Domino’s reporting earnings this week, but here we’ll specifically focus on what they had to say about Uber. The UberEats launch for Domino’s is going well. It’s on track to exit the year with 3% of its revenue coming from the channel and is tracking ahead of long term comp sales targets thanks to this new outlet. The company is pleased with progress and incrementality, yet it is still evaluating precisely how much of this business truly is incremental.
It also talked about a promotional environment in Uber’s marketplace. While that sounds intimidating for Uber at first glance, it isn’t. Domino’s is seeking to extend its marketing dollars through the channel to capture traction within the powerful demand aggregator’s network. That means more sponsored listings in the Eats marketplace, and better affordability to drive transaction volume. There’s a reason why the pizza giant is motivated to spend these dollars. Considering Uber’s demonstrated take rate durability, this bodes well for the company. Not monumental or irrelevant.
6. The Trade Desk (TTD) – Roku (ROKU)
The Trade Desk and Roku are partnering. Roku will plug TTD’s ad-buying platform into its ecosystem to uplift targeting and measurement for marketers. It also includes a data-sharing agreement to sharpen the signal for The Trade Desk’s algorithms. This is one of many votes of confidence in TTD’s platform — and this time from one of the most tech-forward and innovative firms in the space. This is yet another tailwind for streaming advertising. Whether it’s Disney, NBC, Paramount or many others, streamers are lining up to partner with TTD to maximize impression value and fund expensive content spending. And thanks to The Trade Desk’s unmatched return on ad spend (ROAS) for advertisers, buyers are happy to pay the premium.
The result of this formula has been a powerful, cycle-defying structural tailwind that has supported The Trade Desk’s business for several years. And the runway for growth here is still miles-long.
TTD will report earnings next week. I am very confident in the numbers being stellar. I have no idea how the expensive stock will react. And? As long as the data is good, I won’t care.
7. CrowdStrike (CRWD) – Two Mammoth Partners
CrowdStrike and Amazon are deepening an already tight partnership to consolidate AWS’s cybersecurity suite on the Falcon platform. You read that correctly… a king of the public cloud sees CrowdStrike as the ideal endpoint partner to protect their mammoth, rapidly growing infrastructure. Who can blame them?
AWS was already a highly important marketplace partner for CrowdStrike where it just crossed $1 billion in total sales. This not only raises the revenue contribution from Amazon, but is a striking vote of confidence for companies everywhere. And to me, this is one of the most encouraging votes possible.
Like landing large federal government contracts served as a domino for more wins in the public sector… I think this will serve as a domino for accelerated pace of wins in the private sector.
But wait… there’s more. CrowdStrike announced another new, powerful global partnership this week in Tata Group’s Tata Consultancy Services (Ticker TCS). For those who don’t know, Tata is a behemoth in the all important India market. You know… the U.S. ally with the giant, young, growing population and business friendly government. No biggie.
CrowdStrike will now run TCS’s extended managed detection and response (XMDR) suite. XMDR is endpoint protection managed by CRWD’s world-class threat hunting team and augmented with non-endpoint data sources to extend coverage beyond devices and workloads. TCS will also use CrowdStrike’s cloud suite and Security Info and Event Management (SIEM) to help uncover threats. You could not have scripted a better week of partner news for this company.
8. Match Group (MTCH) – Goodbye
I’ve been very close to exiting my Match Group position for a while. Meta and Lulu both fell just short of the targets to justify liquidating MTCH and adding more to those. But I finally pulled the trigger anyway this week. It is compellingly cheap for a share leader of a growing global duopoly. I get why people would disagree and want to stick with it. But to me, its compelling position means results should look much better than they have. Results have instead been quite disappointing. This is even after other consumer internet names found sharp re-accelerations post-pandemic pull forward. I said I would give the new team a year and instead I gave them nearly 18 months. I’ve been very patient to await signs of fundamental life when PayPal and Disney (my other turnaround plays) delivered that life in a small fraction of the time.
Aside from the same top-of-funnel Tinder weakness and that app’s overall decay, I just don’t really have faith in the team anymore. Hinge is a gem, but it can’t carry the entire company on its back. The only “innovation” I’ve seen to improve Tinder has been changing the shape and color of buttons on the app. Yawn. And? Japan now presents yet another headwind that I don’t think this company can handle today. That currency tanking will greatly pressure what makes up roughly 10% of its overall revenue throughout the year. This could still absolutely work, they could still turn things around, and I hope people sticking with it make a lot of money. I just wanted to re-allocate these funds and focus on higher conviction holdings and performing companies in the coverage network. I will no longer be covering this company’s earnings reports, conferences or anything else on it.
8. Fed Meeting
The Federal Reserve maintained their benchmark rate as expected this week. Furthermore, they cut the pace of passive quantitative tightening from $60 billion per month to $25 billion. That was a more dovish cut than expected by $5 billion. That paired surprisingly well with Powell’s press conference. He acknowledged a lack of further progress in inflation data and how that will likely mean higher for longer. Conversely, he was given the opportunity to say another hike was feasible over and over again in the Q&A. You could feel how badly every journalist in that room wanted him to say it. He wouldn’t. He called another hike unlikely and thought policy was clearly restrictive enough as it is. This wasn’t overly surprising, but it was still good to hear as another hike began to creep into pundit expectations. Candidly, the data below screams economic cracks beginning to form and could easily mean a cut is coming sooner than expected. We’ll see.
I will stay laser-focused on these cracks, but as long as the downside risk (in my view) remains a mild recession, they will not impact my process. From purely a stock point of view, mild to moderate slowing or a mild recession means easier policy, less profit discounting and still strong growth for structural winners.
After this and the weak jobs data, 2 rate cuts are again expected in 2024. We’ve gone from 7 cuts expected… to 3 cuts… to maybe a hike… back to 2 cuts in about 6 months. My point? Nobody has any clue when rate cuts will begin or how quickly they will come. All I know is that it’s almost inevitable the next move is a cut and that my holdings are reasonably priced and executing well.
“I was around for Stagflation… I don’t see the stag or the flation.” – Powell
More Macro Data from the Week:
Output Data:
The Chicago Purchasing Managers Index (PMI) for April came in at an ugly 37.9 vs. 44.9 expected and 41.4 last month.
The Manufacturing PMI for April was 50 vs. 49.9 expected and 51.9 last month.
The Institute of Supply Management (ISM) PMI for April was 49.2 vs. 50 expected and 50.3 last month.
The Services PMI for April came in at 51.3 vs. 50.9 expected and 51.7 last month.
ISM Non-Manufacturing Employment for April came in at 45.9 vs. 49 expected and 48.5 last month.
ISM Non-Manufacturing PMI for April came in at 49.4 vs. 52 expected and 51.4 last month.
Inflation Data:
Employment Cost Index rose 1.2% Q/Q in Q1 vs. 1% expected.
The ISM Manufacturing Prices Index for April was 60.9 vs. 55.5 expected and 55.8 last month.
Unit Labor Costs Q/Q for Q1 rose by 4.7% vs. 3.6% expected.
Average Hourly Earnings M/M for April rose by 0.2% vs. 0.3% expected.
Employment and Consumption Data:
Conference Board Consumer Confidence for April came in at an ugly 97 vs. 104 expected and 103.1 last month.
ADP Nonfarm employment change for April was 192,000 vs. 179,000 expected.
JOLTs Job Openings for March were 8.49 million vs. 8.68 million expected.
Initial Jobless Claims were 208,000 vs. 212,000 expected.
Nonfarm Payroll for April came in at 175,000 vs. 238,00 expected.
Private Nonfarm Payroll for April came in at 167,000 vs. 181,000 expected.
9. Portfolio
I used the Match Group sale to add to Nu, SentinelOne, PayPal and Lemonade.

This is an amazing newsletter i always enjoy reading. Thanks for the in depth analysis of draftkings especially. I enjoy playing daily fantasy sports, baseball and football specifically, and have tried all the apps. Draftkings is by far my personal favorite and the only one I’ve used for the past couple of years. I live in Texas so I have to use a shady bookie site for my up or down bets and parleys but as soon as tx realizes they’re missing the revenue boat and legalizes online gambling I’ll move all that business to dkng and i can’t see my being the only one. Big opportunity for growth. I don’t understand the price reaction to earnings but i used it as an opportunity to add and will continue to do so. Long term investment
Regarding DraftKings, what is the impact of a slower economy? It looks like consumer sentiments are deteriorating, would people bet more or less? Thanks.