

News of the Week (August 28 - September 1)
News of the Week (August 28 - September 1)
Lululemon; Salesforce; Okta; SentinelOne; Earnings Round-Up; Shopify; The Trade Desk; Amazon; SoFi; Disney; Macro; Portfolio

Welcome to the hundreds of new readers who have joined us this week. We’re delighted to have you.
1. Lululemon (LULU) – Q2 2023 Earnings Review
a. Demand
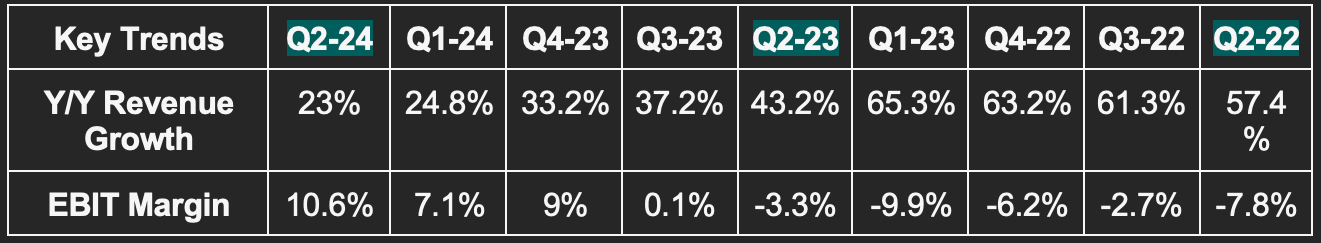
Lululemon beat revenue estimates by 1.8% & beat guidance by 2.6%.

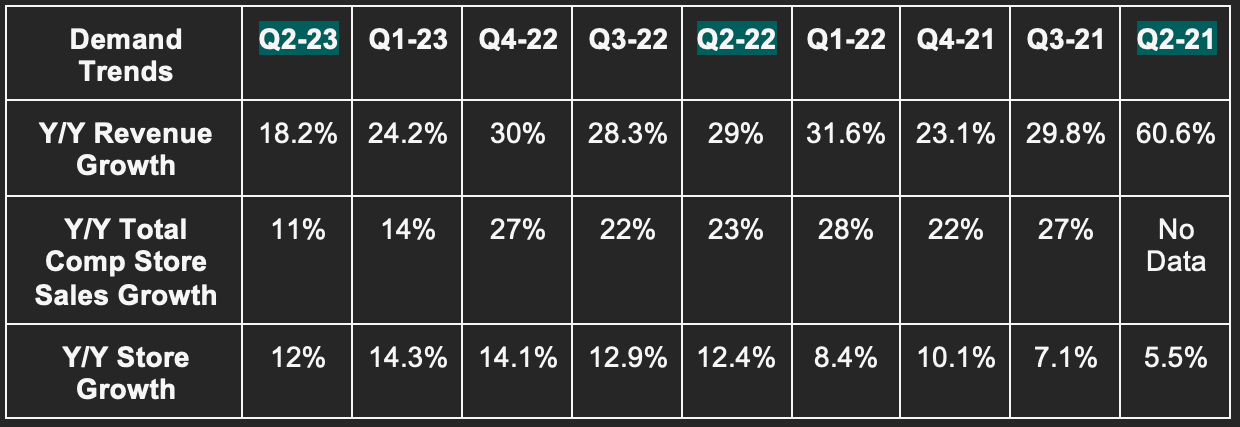
Demand Context:
Still very easy 3-yr comps due to the pandemic. This is why 3 year CAGR is so far ahead of the firm’s long term target of 15% annual growth. That should normalize as comps finish normalizing.
Direct to consumer (DTC) sales = 40% of total vs. 42% Y/Y.
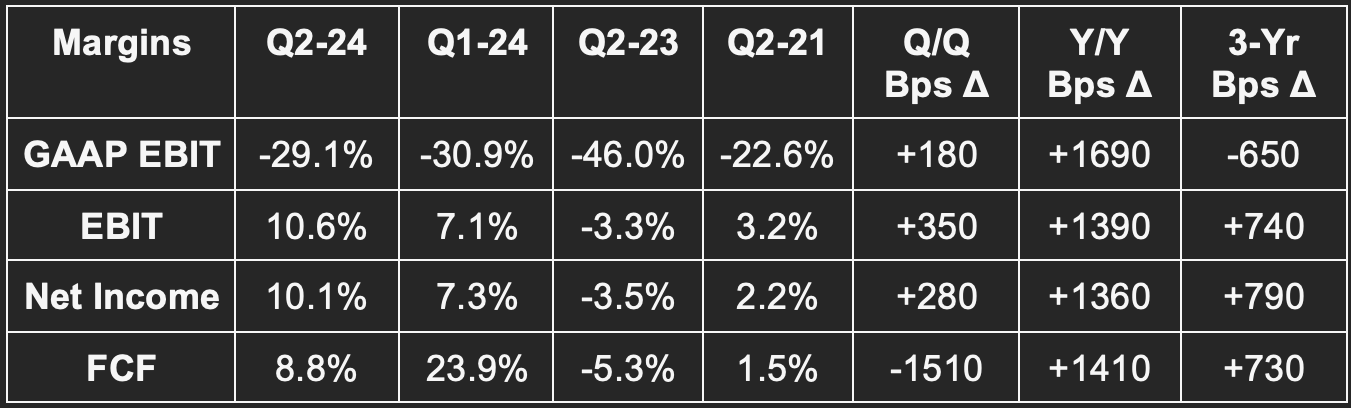
b. Margins
Beat $2.54 GAAP EPS estimates by $0.15 & beat guidance by $0.19.
Beat GAAP EBIT estimates by 4.5%.
Beat 58.6% GAAP GPM estimates by 20 basis points (bps).


Margin Context:
Lulu has generated $331 million in year-to-date free cash flow vs. $327 million all of last year. This is NOT coming from inventory reductions as inventory rose Y/Y and Q/Q. That’s why gross margin continues to expand. You would be hard-pressed to find another player in this space delivering this kind of strength today.
c. Guidance
Raised revenue guidance by 0.7% & beat estimates by 0.4%.
Raised $11.84 GAAP EPS guidance by $0.26 & beat estimates by $0.19. The new EPS guide represents 20.2% Y/Y growth.
Next Q guide was slightly ahead across the board.
Now sees 200 bps of GPM expansion Y/Y vs. 190 basis points last quarter. Air freight relief is the source of the improvement here.
It continues to see 40 basis points of Y/Y EBIT margin leverage for 2023. It’s allocating the pocketed input costs to more growth initiatives within OpEx which is why this wasn’t raised alongside gross margin.
“We remain aware of the uncertainties that exist in the current macro environment and consistent with our approach over the last several years, we continue to be prudent and plan the business for multiple scenarios.” -- CFO Meghan Frank
Next quarter guidance was slightly ahead on demand and profit as well. It sees low double digit inventory growth next quarter. Importantly, it also maintained its long-term targets calling for roughly 15% annual revenue compounding and modest operating leverage through 2026.
d. Balance Sheet
$1.1B in cash & equivalents.
$400 million in available credit revolver capacity.
Inventory rose 13.5% Y/Y and 5% Q/Q. Again, strong free cash flow is not related to inventory liquidation.
Shares fell slightly Y/Y via buybacks.
e. Call & Release Highlights
Thriving:
Lululemon has been a notable standout within a challenged consumer discretionary space in 2023. That narrative continued this quarter with more market share gains (1.3 points of incremental share per Circana data) and pretty much every single product seeing outperforming strength. Women’s, Men’s and Accessories grew by 16%, 15% and 44% Y/Y respectively. Broad-based momentum actually accelerated into Q3 with growth in every major geography including the U.S. accelerating Q/Q thus far. With U.S. revenue growth of 11% Y/Y this quarter vs. 52% internationally, that acceleration note was fantastic to hear.
Core franchises are killing it with its Women’s Softstreme category now “emerging as another core franchise.” ABC pants for Men are still killing it. Makes sense… Those pants rock. The Everywhere Belt Bag continued brisk growth following a strong debut. Its 2 newest men’s collections are exceeding expectations. Everything Lulu sells is selling well… new and old.
Innovation:
Will launch Men’s Footwear next year.
Its new Steady State category for Men uses the exact same fabric as its Scuba franchise. This meant wonderfully affordable innovation which has been met with an extremely positive guess reaction. Just one of many examples of Lulu leveraging fabric innovation for multiple categories and revenue buckets. More revenue generated by already incurred fixed costs is always a wonderful thing.
Going Global:
The store opening in Bangkok was “among the strongest ever” for Lulu in Asia-Pacific (APAC).
Store remodeling in Australia is working well.
Its National Fitness Day event in China was well attended and fulfilled core brand awareness objectives. China revenue rose 61% Y/Y.
The significant savings Lulu is enjoying within air freight is allowing it to further accelerate global brand building and marketing investments. Considering its unaided brand awareness is 25% in the USA, just over 10% in Australia and the U.K. and under 10% everywhere else, there’s a long runway to grow the Lulu brand. This brand building over the last year or so has directly translated into international revenue as a percent of total crossing over 20%. CEO Calvin McDonald sees this approaching 50% over time.
While it will always focus on grassroots marketing, it’s now ready to accelerate its global campaign and large live event cadence.
In Europe, the soft launch with popular e-commerce vendor Zalando this summer went well. That relationship gives it great traffic access in that newer market while maintaining DTC margins for the most part. This is not wholesale revenue.
Final Notes:
Lululemon’s Essentials membership program crossed 12 million this quarter. It launched less than a year ago.
The outperforming sales growth was the main source of 14% Y/Y inventory growth vs. the 20% growth leadership guided to last quarter.
f. Takeaway
Again, 2023 has been a challenging year for consumer discretionary as a category. Based on Lulu’s results, the weakness has not been noticeable as it continues to overcome any and all headwinds. This part of the cycle SHOULD HAVE been very tough for the company, but I suppose it didn’t get the memo. This was a very strong quarter with nothing for me to pick at in the least. Great brand. Great team. Great company. Enough said.
2. Salesforce (CRM) – FY Q2 2024 Earnings Review
a. Results
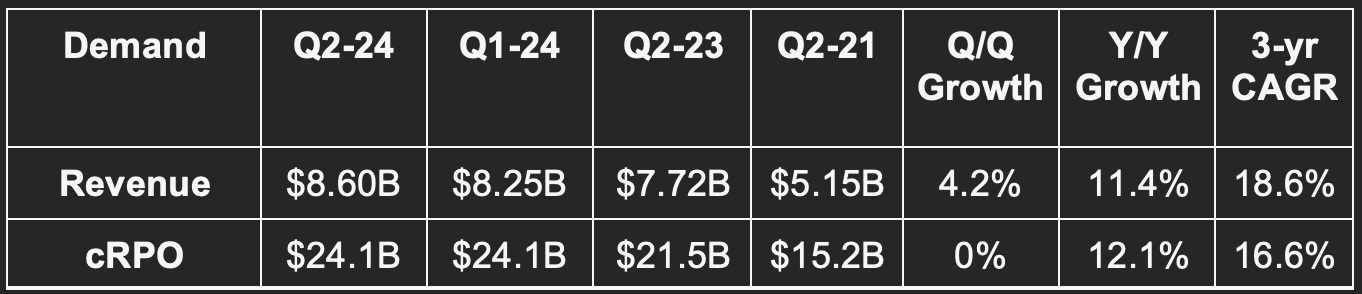
Beat revenue estimate by 0.8% & beat guide by 1%.
Beat current RPO (CRPO) guide by 1.9%.
Beat $0.80 GAAP EPS estimate & same guide by $0.48.
Beat $1.90 EPS estimate & same guide by $0.22.
Roughly doubled free cash flow (FCF) estimate.

b. Fiscal Year 2024 Guidance Updates
Raised revenue guide by 0.4% & beat estimate by 0.2%.
Raised EBIT guide by 7.6% & beat estimate by 7.1%.
Raised GAAP EBIT guide by 10.8%.
Raised $2.68 GAAP EPS guide by $0.83 & beat estimate by $0.81. This includes a $1.11 restructuring charge.
Raised $7.42 EPS guidance by $0.63.
Raised operating cash flow growth guidance from 16.5% Y/Y to 22.5% Y/Y.
Next quarter guidance was also ahead across the board.
c. Balance Sheet
$12.3 billion in cash & equivalents.
$9.4 billion in total debt with $1 billion due within 12 months.
Share count fell by about 1.5% Y/Y via continued buybacks. It has $11.9 billion left on its current $20 billion buyback program. Stock comp is expected to be 8% of revenue this year.
d. Call & Release Highlights
Generative AI:
Einstein is Salesforce’s AI tool to augment the Salesforce CRM platform. It automates data sifting and insight gleaning to reveal valuable patterns to guide decisions. It also comes with language tools to translate and analyze text to uncover sentiment among other things. These tools existed before the generative AI wave, but now they’re getting an upgrade thanks to it. Einstein GPT allows Salesforce clients to plug into language models (including OpenAI’s, Anthropic’s and Cohere’s) to make workflows more productive, intuitive, conversational and automated. It features a low code tool set to reduce the barrier for non-experts to build applications and also boasts expert-level tools to build more complex models and use cases.
Einstein is Salesforce’s generative AI toolkit and its expansive data cloud is the vital complement to those products. As a reminder, the relevant injection of data into AI models is the only way to make these models useful and provides the “generative” learning experience to the software. The more data seasoning, the better. Salesforce has the unique ability to combine its “deeply integrated” data cloud into the rest of its clouds and apps. Its product breadth and vast customer base means this data cloud is wonderfully rich with insight while Einstein ensures that insight can be effectively gleaned and leveraged all from within the Customer 360 (its full suite of clouds) environment.
Having the data cloud, other operational clouds and Einstein in one place means greater efficiency as well. It means customers can access needed, curated data in real-time without costly, non-targeted external querying or the maintenance of siloed data lakes. Salesforce delivers a fully “integrated data architecture.”
“We're moving our customers from having islands of data to having a single source of truth for all of their data.” -- CEO Marc Benioff
Importantly, all of these generative AI tools are accessible in low or no code environments. Meaning that one does not need to be a computer scientist or a coding nerd in order to utilize them. Considering this, Salesforce sees its recipe within the generative AI wave as “democratizing access” to all of the model builders and services.
Along these same lines, Salesforce is adding another (5th) core objective to its operations in becoming the “leading AI customer resource manager.”
Growth by Product Bucket:
12% sales cloud growth vs. 13% Q/Q and 19% Y/Y.
12% service cloud growth vs. 13% Q/Q and 18% Y/Y.
11% Platform & Other growth vs. 12% Q/Q and 56% Y/Y.
10% Marketing & Commerce cloud growth s. 10% Q/Q and 22% Y/Y.
16% Data cloud growth vs. 20% Q/Q and 13% Y/Y.
Continued Customer Traction & Cross-Selling:
90% of the Fortune 100 uses Salesforce as of today and an average of 5 clouds.
Data cloud was in 50% of its largest deals this quarter including expansion deals with KPMG and FedEx.
PenFed is using Einstein to resolve 20% of service inquiries automatically with “incredible return on investment.”
Half of its $1 million deals included MuleSoft. MuleSoft is its integration layer for apps and data sources
5 industry clouds enjoyed 50%+ annual recurring revenue (ARR) growth for the 3rd straight quarter.
Customer wins included JP Morgan, Bayer and the Department of Veterans Affairs.
6 of its 10 largest deals involved 5 or more clouds.
Over the last 5 years, $10 million+ customers have compounded at a 24.6% clip.
18.6% 3-yr revenue CAGR vs. 19.2% Q/Q and 20% 2 Qs ago.
Margins:
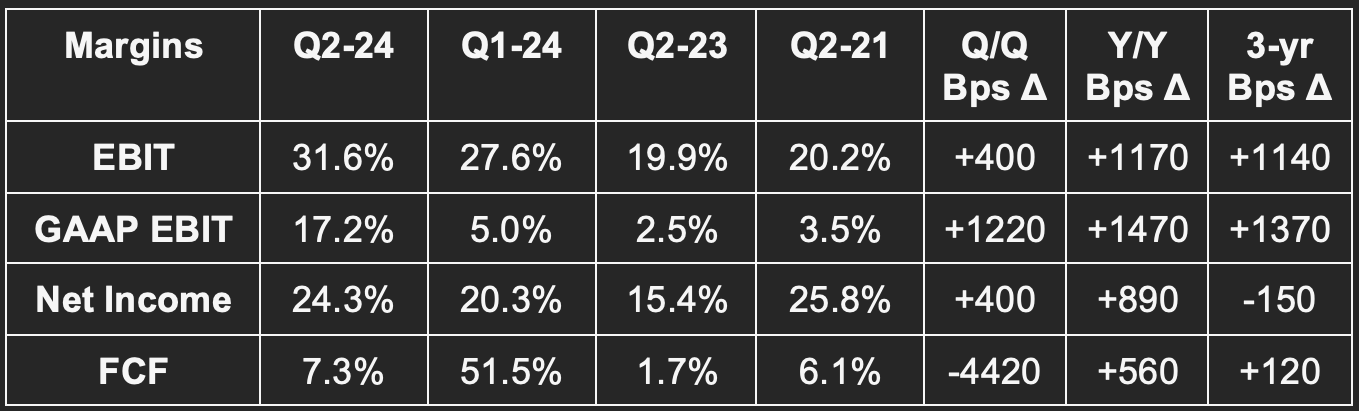
Salesforce reached its 30% EBIT margin target nearly a full year ahead of schedule. It does not expect that to be a one-off event, but a consistent trend with perhaps some expense timing-related volatility in the second half of the year.
Cash flow is being greatly held back by restructuring charges. GAAP EBIT and net income are being slightly held back by these charges.
Macro:
The buying environment remains “measured” while “compression of larger deals” continues and the sales cycle remains elongated. Macro headwinds were in full force this quarter and the company effectively baked those challenges into its guide and overcame them a bit better than expected as well. Revenue attrition remained stable at 8% to show the mission-critical nature of this platform.
Case Study:
Salesforce’s Einstein was added by an existing customer in Schneider Electric. With this product addition, it cut sales closure time by 30% and automated its entire order fulfillment flow.
Downstream:
Salesforce debuted “Salesforce Starter” as a bare bones product kit geared towards small and medium businesses. This reminds me of CrowdStrike’s Falcon Go bundle.
e. Takeaway
More wonderfully boring execution for a company that has listened to shareholders wanting fatter margins and found its groove this year. Its product suite obviously continues to resonate, its fat has been trimmed and its combination of buybacks and vast operating leverage should lead to rapid profit compounding for the foreseeable future. Great company… What else is new?
3. Cybersecurity Earnings – Okta & SentinelOne
As a CrowdStrike shareholder, I’m always interested to see how competition and complements perform relative to its own results. Okta is more of a complement as an identity security broker. SentinelOne is its direct competition.
a. Okta (OKTA)
Results:
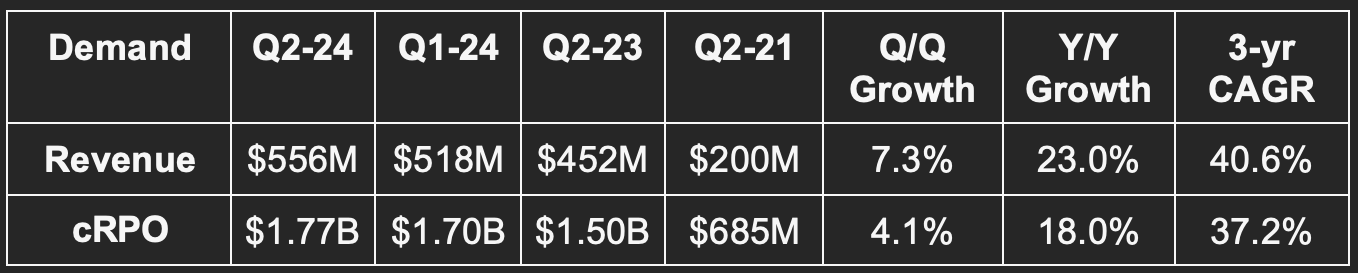
Beat revenue estimate & same guide by 4.1%; Beat cRPO guide by 3.2%.
Beat EBIT estimate by 58% & beat guide by 59.4%.
Beat $0.22 EPS estimate & same guide by $0.12.
Obliterated FCF estimates.
Fiscal Year 2024 Guidance:
Raised revenue guidance & beat same estimate by 1.4% each.
Raised EBIT guidance & beat same estimate by 31% each.
Raised $0.91 EPS guidance & beat same estimate by $0.27 each.
Balance Sheet:
$2.1B in cash & equivalents.
Share count is up 3.4% Y/Y.
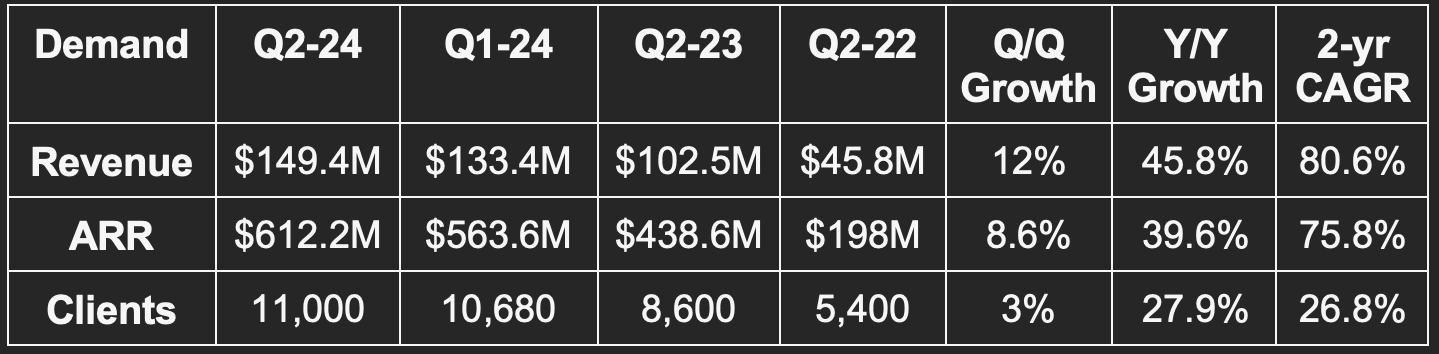
Customer Momentum:
115% dollar based net revenue retention (DBNRR) vs. 117% sequentially and 122% Y/Y.
Gross retention is in the “mid 90% range.” If this means 96% then that’s great. If it means 93% then that’s not a strength. I would love more granularity here, but most companies don’t even report gross retention, so I appreciate that this one does.
18,400 customers vs. 18,050 sequentially.
Customers with an annual contract value over $100,000 came in at 4,205 vs. 4,080 sequentially.
40.6% 3-yr revenue CAGR vs. 41.5% Q/Q & 45.0% 2 Qs ago.
Efficiency:
Okta continues to enjoy meaningful gross margin leverage. This metric rose to 79.8% vs. 78.9% Q/Q and 77.6% for fiscal year 2023 as a whole. This paired with operating expense (OpEx) controls as it prioritizes efficiency and strong collections paved the way for the exploding FCF margin. Its 15% FCF margin guide for the full year shows this strength continuing for the next several months.
Macro:
The highest quality software companies this quarter have spoken about improving macro dynamics. Quality software companies spoke about stabilizing macro headwinds. The lower quality names coincidentally didn’t see any improvement to macro and were hesitant to call out peak headwind intensity. Always interesting how the best microeconomic investment cases magically are better able to overcome macro headwinds. Not a coincidence.
Okta finds itself squarely in the middle of this cohort as its saw headwinds stabilize. It even saw slight improvements in long-term contract appetite, deal size and new logo growth. Pipeline activity, however, continues to skew towards upsells as new logo growth and demand hasn’t yet seen a convincing positive inflection. It continues to be quite cautious in its forward modeling.
Customer Wins:
“One of the largest shipping and transportation lines in Europe” as a new customer.
Global 100 CPG companies as a new customer win.
Ryder Truck Rentals expanded from Okta's Workforce Identity and Customer Identity tools to its Governance product. This has let the client significantly cut its own client base’s onboarding costs.
Secured a record number of $5 million or more annual contracts thanks to strong upsell activity.
It thinks macro headwinds are manifesting mostly in slower customer acquisition. I would have loved to be able to compare this result to CrowdStrike’s new acquisition growth, but CrowdStrike now only discloses that annually. Okta continues to be “enthusiastic about early customer reception for Okta Identity Governance (OIG) and pleasantly surprised at the size of organization that is purchasing it and the range of use cases.” This revenue seems highly incremental as 50%+ of it came from customers not using its lifecycle management tools which are a core part of OIG. Grubhub is now using OIG.
Catering to the Big Boys:
Okta launched Okta for Global 2000 this week. This is more of an a la carte offering allowing large clients to pick and choose which of their assets, workflows and tech stack runs through Okta and in which environment. This reminded me of Shopify’s Commerce Components by Shopify offering which gave its largest clients greater autonomy in picking smaller parts of its product suite and integrating their own legacy processes they wished to keep. This has worked extremely well for Shopify. We’ll see if it can deliver the same boost to Okta’s results.
b. SentinelOne (S)
Results vs. Expectations:
Beat revenue estimate & same guide by 6%.
Beat EBIT estimate by 33% & beat guide by 34%.
Beat GPM estimate by 330 bps & beat guide by 240 bps.

Full Year Guidance:
Raised revenue guide by 1.7% & beat estimate by 1.8%.
Raised EBIT guide by 5.9% & beat estimate by 6.9%.
Raised GPM guide by 150 bps & beat estimate by 160 bps.
Reiterated positive FCF 2H of next calendar year.
Guidance assumes macro headwinds remain stable Q/Q.
Balance Sheet:
$730M in cash & equivalents.
$410M in LT investments.
Share count up 5.7% Y/Y.
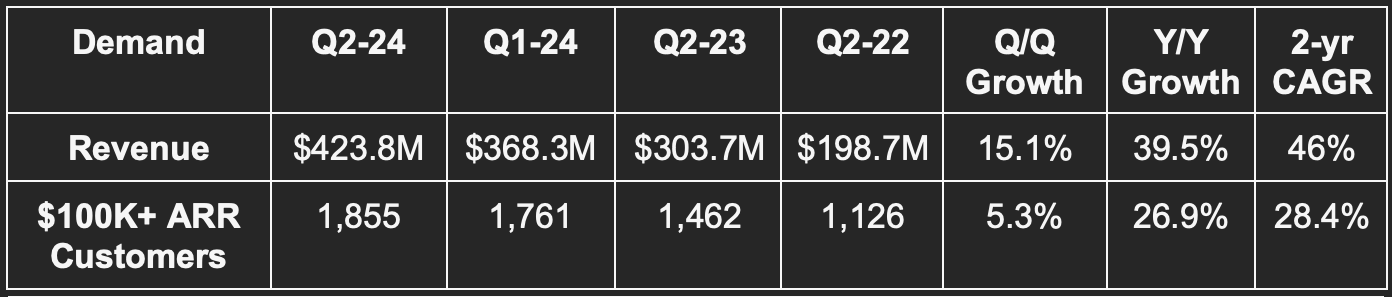
Key Metrics:
994 $100K+ ARR clients vs. 917 Q/Q.
115%+ dollar based net retention rate (DBNRR) vs. 125%+ Q/Q.
80.6% 2-yr revenue CAGR vs. 89% Q/Q & 105% 2 Qs ago.
Rumors:
SentinelOne’s CEO denied rumors that it was exploring a sale. He told investors that SentinelOne’s best path is as an “independent, transparent company.” He further denied the rumor circulating that its Wiz cloud security partnership was ending. It’s simply exiting a resale agreement with Wiz because it wasn’t moving the needle for SentinelOne. The partnership remains intact.
Execution:
Last quarter was an ugly one for SentinelOne. Between the annual recurring revenue (ARR) accounting mishap and the guide down, it left more questions than answers. This quarter, conversely, was strong. It partnered with a big 4 account firm to serve as an independent “validator” of its newly implemented accounting processes and controls. The strong guidance raise this quarter was also something that should have investors here both relieved and encouraged. This was a great bounce-back quarter for the company.
Macro & Competition:
SentinelOne continues to enjoy strong competitive win rates vs. the field. Macro headwinds are still there, but those headwinds did not further intensify Q/Q – they stabilized. Importantly, its backlog is made up of a “healthy mix of new customers and existing relationships. Okta called out a continued skew towards existing client pipeline as new contract appetite remained timid. SentinelOne isn’t experiencing that same phenomenon.
The team had some harsh things to say about Microsoft Defender. It called that tech “riddled with vulnerabilities” and “inadequate.” It sees growing regulatory momentum to demand more from Microsoft security efficacy.
Moving Upstream & Vendor Consolidation:
A key to SentinelOne’s success will be effective expansion into endpoint complements and adjacencies. This will foster cross-selling, higher retention and healthier margins. During the quarter it “secured large customer wins across Federal Agencies, healthcare and technology for its endpoint core… but also for cloud security. The company recently debuted a new line of cloud security tools to better emulate CrowdStrike’s full suite of products. Early and large customer wins are a good sign for its potential traction here. One of these wins displaced 7 point solutions in a 5-module deal. Vendor consolidation and cost cuts are top priorities for C-suites in 2023 and SentinelOne is starting to better meet this motivation head on. Specifically, non-endpoint products made up more than 1/3 of its total bookings this quarter.
4. Earnings Roundup – MongoDB & Broadcom
a. MongoDB (MDB)
Results vs. Expectations:
Beat revenue estimate by 8.4% & beat guide by 8.7%.
Doubled EBIT estimate and EBIT guide.
Doubled EPS estimate & EPS guide; Demolished FCF estimates.
Full year Guidance:
Raised revenue guide by 4.6% & beat estimate by 3.6%.
Raised EBIT guide by 64% & beat estimate by 57%.
Raised $1.49 EPS guide by $0.82 & beat estimate by $0.76.
Next quarter guidance was also comfortably ahead across the board.
Balance Sheet:
$1.9B in cash & equivalents.
$1.14B in convertible senior notes.
Shares up 3.7% Y/Y.
Key Metrics:
46% 2-yr revenue CAGR vs. 42.3% Q/Q & 45.4% 2 Qs ago.
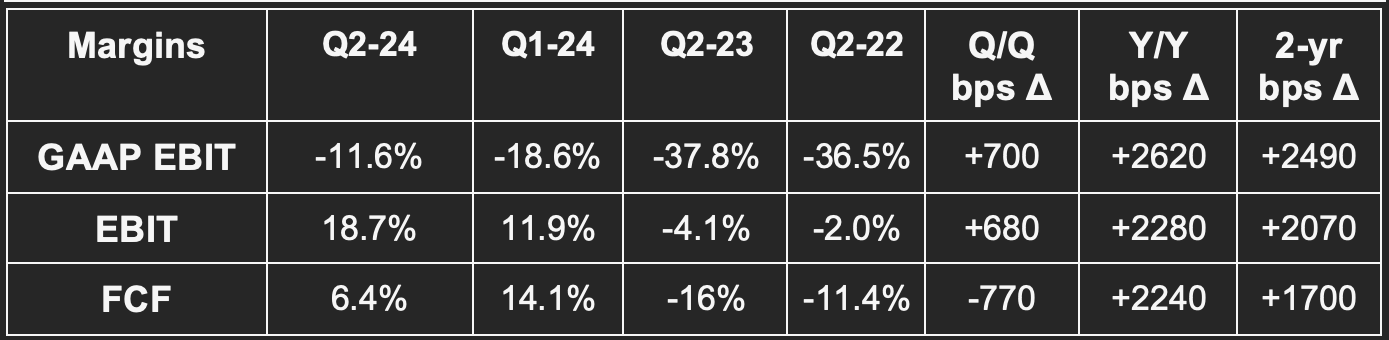
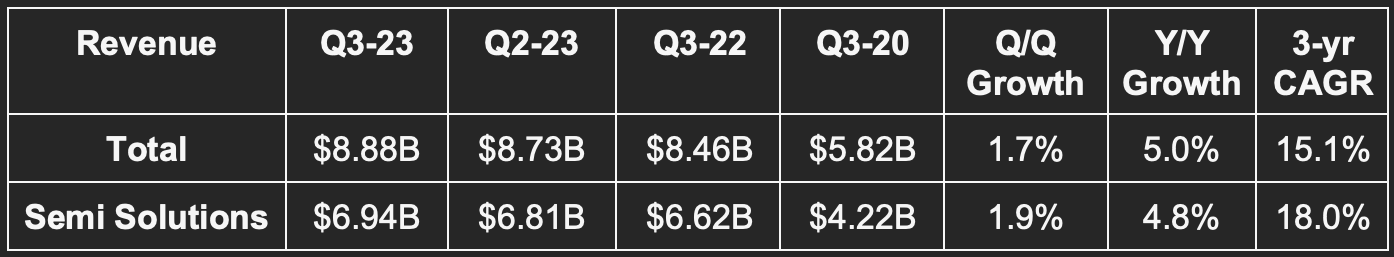
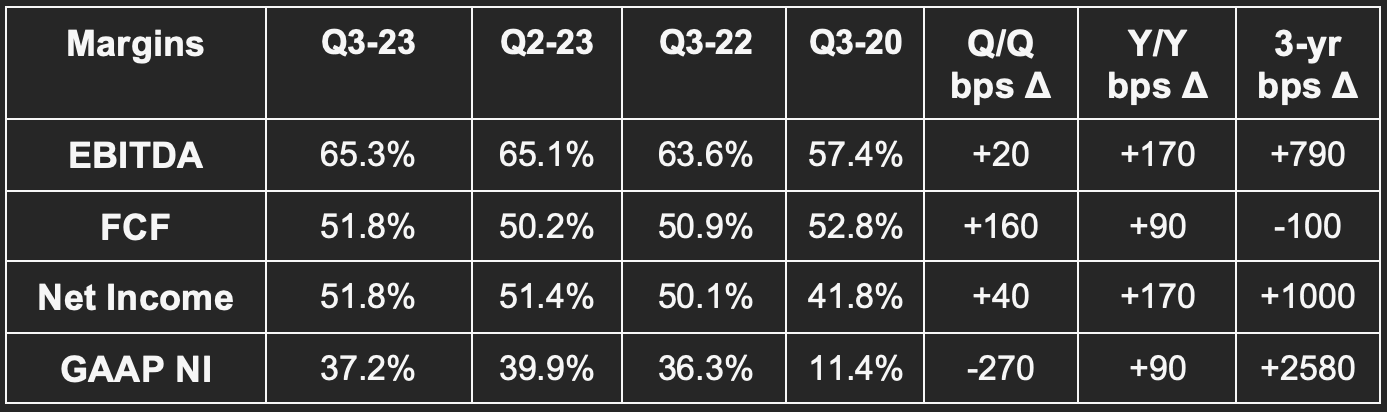
b. Broadcom (AVGO)
Results vs. Expectations:
Beat revenue estimate by 0.1% & beat guide by 0.2%.
Beat EBITDA estimate by 1.5% & beat guide by 0.9%.
Beat $10.43 EPS estimate by $0.11.
Missed $8.16 GAAP EPS estimate by $0.42.
Next Quarter Guidance:
Slightly missed revenue estimate.
Beat EBITDA estimate by 0.6%.
Balance Sheet:
$12B in cash & equivalents.
Inventory down year to date.
$38B in long term debt.
Basic shares down slightly Y/Y; diluted shares flat Y/Y.
Key Metrics:
15.1% 3-yr revenue CAGR vs. 15% Q/Q & 15% 2 Qs ago.
5. Shopify (SHOP) -- Key Integration
After months upon months of lengthy negotiations, pointed warning disclosures and no progress, Shopify and Amazon’s Buy with Prime have finally announced an integration. As a shareholder of both names, I say thank you to Amazon for the great Shopify news.
As a reminder, Amazon Buy with Prime (BwP) is a program allowing Amazon’s merchants to utilize its world-class order fulfillment from their own websites. This allows for great control of brand, data and customer relationships with still the elite service quality that has made Amazon famous. Shopify Fulfillment Network (SFN) was gearing up to compete with BwP until the company thankfully sold the asset to Flexport. Not only was this sale a massive margin tailwind (without much of a hit to revenue), but it likely made this integration partnership a lot more feasible.
In the coming months, Amazon will debut a Shopify app allowing Amazon fulfillment customers to utilize BwP from directly on their Shopify admin and storefront checkout. So? Merchants grant their direct customers who are also Prime Members the ability to enjoy those membership perks (like fast/free fulfillment) from their OWN sites. They keep the same 100% control of brand and data that Shopify always provides while accessing world-class fulfillment. They get the best of both worlds. This is the very first time that Amazon is allowing competing partners like Shopify to do so with shared clients as a vote of confidence in the company’s staying power and competitive positioning in the vast e-commerce market.
I cannot overemphasize how big of a fan I am of Shopify’s handing of SFN in 2023. It realized it was better off focusing on the massive opportunities existing within its current core, and abruptly pivoted when this epiphany set in. It did not compound what was clearly an M&A mistake… it righted the wrong and did so while maintaining an equity stake in Flexport and freeing itself to work with the company owning 40% of North American e-commerce. Shopify got more profitable from this sale… got more focused… and remedied what was becoming a more fragile relationship with Amazon.
Great news.
Shopify also deepened a commerce partnership with TikTok. The two already work closely together so I’m quite interested to see what this development will add to the relationship.
6. The Trade Desk (TTD) -- A Sad Goodbye
Chief Technology Officer and Co-Founder Dave Pickles announced his retirement from The Trade Desk. Dave and Jeff Green have been wildly successful in creating arguably the most successful company in programmatic advertising. Pickles has been seasoning his internal replacement for several quarters, but this is still a large departure. Congratulations to him on a wonderful career. Go enjoy the beach… you earned it and then some.
Between CFO Blake Grayson recently stepping down and this news, the company has had two notable c-suite departures in 2023. Laura Schenkein was a rock-solid internal replacement for Grayson and I’d expect another internal promotion to replace Pickles due to the plethora of talent it has to choose from. In terms of how this changes my view of the company, there is no change. Jeff Green is the most important employee/founder at The Trade Desk by far. If he leaves, then I’ll be concerned.
7. Amazon (AMZN) -- More Margin Levers & M&A
a. More Margin Levers
A consistent Amazon news theme over the last several weeks has been its price and product announcements to foster more operating leverage. The regional fulfillment overhaul, pricing power flexes and AWS re-acceleration are the three big items with ads and 3rd party selling rounding out the near-term tailwinds to its EBIT performance.
This week we got three more developments along these same lines. First, Amazon will raise order value minimums for free shipping (only for non-Prime subscribers) to $35. Secondly, it will lean further into advertising by adding interactive placements across its marketplace and other properties this year. Finally, it partnered with Shopify on the aforementioned BwP integration. This will work to help Amazon more optimally extract the value from its current fulfillment ecosystem while minimizing deadweight loss as capacity needs naturally fluctuate within the static footprint. It would not be doing this if it didn’t have the existing capacity to meet incremental Shopify merchant demand. Clearly it does.
As an interesting aside, Google announced a $30 direct charge for access to some of its generative AI tools. This follows in Microsoft’s footsteps with its own monetization of Copilot within 365. Amazon and Meta are approaching generative AI in a way to uplift existing products but not (at least yet) charge for the upgrades directly. I do think we’ll get to a point when Amazon is ready to directly monetize some products culminating from its Bedrock foundational model and training/inference chip sets. Considering its vast cloud computing scale, effectively doing so would be needle moving to results just like it will be for Microsoft’s $30 per month copilot up-charge.
b. M&A
Amazon announced its intent to buy Fig. Fig makes workflow tools for developers with the team set to be infused into AWS’s talent roster. Deal terms weren’t disclosed but the company is very small and this will not be material to financial results. Maybe it just wanted to acquire some developer talent to replace rumored-to-be disgruntled employees wanting to continue working remotely but not being allowed to do so. Jassy wants everyone back in the office… as he should.
More Headlines:
Jassy wants all employees back in the office and won’t budge. I love this.
EVgo and Amazon announced a new Alexa-based tool to take drivers to charging stations.
8. Visa (V) -- August Spend Data & Raising Fees
Visa continues to see wonderfully stable monthly U.S. volume growth in August. U.S. credit volumes rose 7% Y/Y, while Debit rose 7% Y/Y. Cross-border continues to come back with a vengeance as that segment was 18% Y/Y growth for August.
It also makes me laugh when some like to point to an obscure data point to conclude how the U.S. consumer is doing. Why not just glean insight from the monthly data that the largest card network in the world publish? Doing so is naturally less anecdotal and more reliable. The consumer is fine.
In other news, both Visa and Mastercard will raise their interchange fees.
9. SoFi (SOFI) -- Galileo
DataDInvesting on Twitter shared an interesting SoFi credit suite development. Galileo is now working to roll out installment loans for businesses. This is among SoFi’s first company entrance into B2B banking. It’s unclear if this product will be utilized within the SoFi consumer app or just for Galileo clients. Ideally it will be both. As a self-employed equity analyst who loves the SoFi app, I am patiently waiting for it to expand into business banking so my LLC can become a loyal customer. I am excited at the prospect of collecting 4%+ APY from a reputable firm like this one. At a meeting with Bank of America this past week, their business banking specialist looked me in the eye and told me the APY was a few basis points. She was quite surprised when I began laughing. SoFi can really shine here. We’ll see.
10. Disney (DIS) -- Charter
Disney’s linear TV assets were removed from Charter on Thursday as the two sides have not yet agreed to a renewal. According to reports, Charter extended Disney what it deemed to be a fair offer but Disney wants more. Negotiations will likely continue until each side makes appropriate concessions. Charter relies on great content to attract subscribers. Disney has the number one news entertainment outlet, the number one linear sports brand and a treasure chest of relevant scripted entertainment at its disposal as well. I have a few friends who are Spectrum users and passionate college football fans. They were furious at their lack of access to Utah vs. Florida Thursday Night due to this holdout. That evidence is quite anecdotal, but I’m confident that it is representative. The frustration and pressure on Charter to make concessions will merely grow as the slate heats up this weekend.
Considering this, it’s hard to envision a permanent future in which Charter thrives without this contract. The path would still be there, it would just become much more treacherous. Conversely, Charter is the second largest cable operator in North America. This is an important distribution partner for Disney and one that it obviously wants to maintain.
Both sides make fair arguments. Charter doesn’t believe a large hike to content licensing fees is appropriate given linear’s secular decline. Furthermore, Disney has made it very clear that ESPN will move to direct to consumer in the coming years which would greatly diminish its value as a linear content partner. In Disney’s point of view, it dominates within the two remaining healthy pieces of linear TV: Live news and live sports. ESPN has consistently bucked weak ad trends throughout 2023 and this rare standout does deserve a premium while the content remains on cable. Something will invariably get done. We’ll see what the new deal looks like and how long it takes.
For now, this is simply another negative headline feeding the irrationally poor sentiment Disney has seen as of late. To that I say bring it on. My position is only half full, the turnaround will be a multi-year process, and I’d love to own more shares at even more depressed multiples. I’m selfish, I know.
11. Macro
Inflation Data:
Core Personal Consumption Expenditures (PCE) in July rose 4.2% Y/Y as expected and vs. 4.1% last month. M/M growth was 0.2% as expected vs. 0.2% last month.
PCE in July rose 3.3% as expected and vs. 3% last month. M/M growth was 0.2% as expected vs. 0.2% last month.
Q2 GDP Price Index was 2% vs. 2.2% expected and 4.1% last month.
Average Hourly Earnings M/M for August rose 0.2% vs. 0.3% expected and 0.4% last month.
Consumer/Employment Data:
Conference Board Consumer Confidence for August was 106.1 vs. 116 expected and 114 last month.
JOLTs Job Openings for July were 8.83 million vs. 9.47 million expected and 9.17 million last month.
ADP Non-farm Employment Change for August was 177,000 vs. 195,000 expected and 371,000 last month.
Nonfarm payroll for August rose by 187,000 vs. 170,000 expected and 157,000 last month.
Private nonfarm payroll for August rose by 179,000 vs. 150,000 expected and 155,000 last month.
Pending Home Sales M/M in July rose 0.9% vs. -0.6% expected and 0.4% last month.
Personal Spending M/M for July rose 0.8% vs. 0.7% expected and 0.6% last month.
Institute of Supply Management (ISM) Employment for August was 48.5 vs. 44.2 expected and 44.2 last month.
ISM Manufacturing PMI for August was 47.6 vs. 47 expected and 46.4 last month.
Labor Force Participation Rate for August was 62.8% vs. 62.6% expected and 62.6% last month.
Unemployment was 3.8% vs. 3.5% expected and 3.5% last month.
The last two data points matter dearly for Fed policy cadence. Both show cracks in labor strength with diminishing excess supply. This is a terrible thing for those impacted but a positive for more dovish Fed policy when combined with continued downward inflationary pressures. Hello soft landing.
Output Data:
Preliminary U.S. Q2 GDP was 2.1% vs. 2.4% expected and 2.0% last quarter.
Chicago Purchasing Managers Index (PMI) was 48.7 vs. 44.1 expected and 42.8 last month.
Manufacturing PMI for August was 47.9 vs. 47 expected and 49 last month.
12. Portfolio
No transactions this week.
Our “common heritage”. Never forget that you belong to an economy that allows wealthy people, enjoying first class freedoms, to invest in companies that repeatedly misuse our science, our tax dollars, our highway and healthcare systems, even our sunlight, water, plants, and soils while exploiting our labor, too, all of this only to help sweeten, for instance, a highly addictive drug and package it the into a small, stylish container, then give it a cool name like “Tyson 2.0 Heavy Weight 7000 Puff disposable vape pod system from Mike Tyson” to better guarantee their tobacco industry a new generation of young people dependent on useless products, smoking nicotine every day for the rest of their shortened, lung-crusted lives.