

News of the Week (February 13 - 17)
News of the Week (February 13 - 17)
The Trade Desk; Meta; PayPal; Lemonade; Datadog; Palantir; Applied Materials; Roblox; Macro; My Activity

Today’s piece is powered by Savvy Trader:

Welcome to the 307 new readers who joined us this week. We’re delighted to have you as subscribers & determined to provide as much value & objectivity as possible.
In case you missed it, I published an Airbnb earnings review, a Shopify earnings review and an Upstart earnings review (along with my plans for the troubled position going forward) during the week.
1. The Trade Desk (TTD) -- Q4 2022 Earnings Review
a. Demand
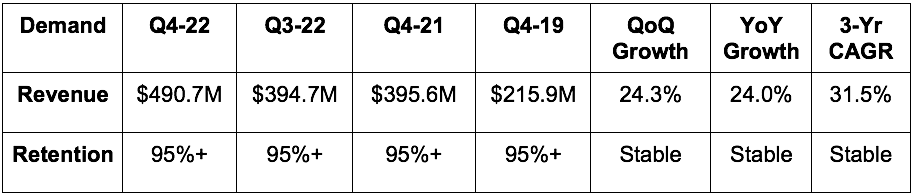
The Trade Desk missed revenue estimates by 0.2% but beat its “at least” revenue guide by 0.1%.

Demand Context:
Client retention has been over 95% for 9 straight years.
The 31.5% 3-yr revenue CAGR compares to 34% last quarter & 33.1% 2 quarters ago.
95% of spend continues to come from highly visible & stable master service agreements.
Connected TV (CTV) rose to roughly 45% of total revenue vs. closer to 40% last quarter as its largest channel continues to be one of its fastest growing channels.
Political spend represented a low single digit percent of total spend during the quarter.
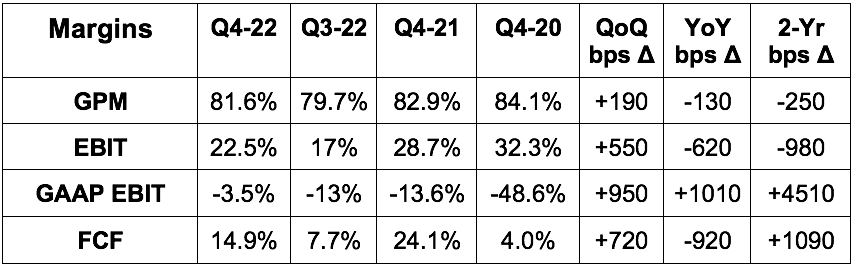
b. Profitability
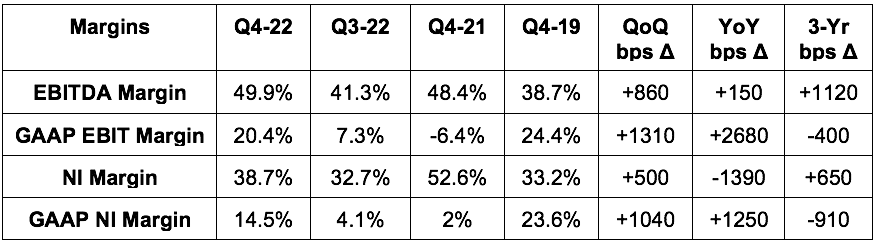
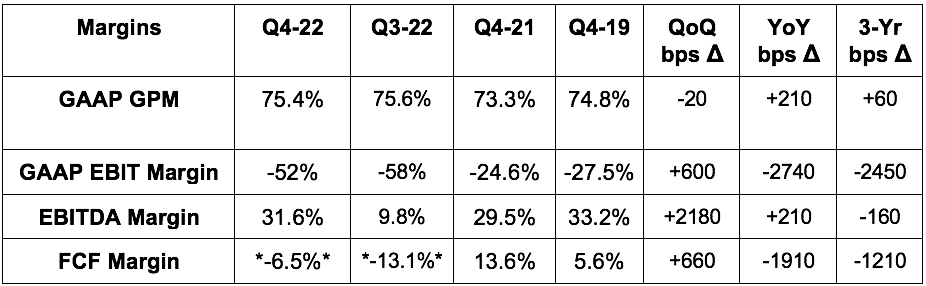
Beat EBITDA estimates by 6.6% & beat its EBITDA guide by 7%.
Beat GAAP EBIT estimates by 9%.
Missed $0.16 GAAP EPS estimates by $0.02.
Beat $0.36 EPS estimates by $0.02.
More Margin Context:
The Trade Desk paid $41 million in taxes vs. realizing a net tax benefit of $34.6 million YoY. Had the firm enjoyed the identical benefit this quarter for normal YoY comps, net income would have been $265.7 million. This would have represented earnings per share (EPS) of $0.53 vs. $0.42 YoY for 26% growth vs. the -9.6% growth it reported. The shrinking EPS was solely a matter of effective tax rate differences -- not operating leverage. That’s why its EBITDA margin expanded nicely YoY.
GAAP margin expansion was significantly aided by less stock comp YoY.
Operating expenses (OpEx) rose 22% YoY as it continues to invest in its team, tech, and product. It never got too excited with cost growth and hiring during the pandemic bubble and so its margins continue to be quite lofty. Revenue growth has led OpEx growth consistently since 2019.
It will continue hiring throughout 2023, although at half the pace it did in 2022.
The Trade Desk spent $50 million in capital expenditures during the quarter to build out its data center footprint.
c. Q1 2023 Guidance
The Trade Desk guides to minimum quarterly revenue (which I would love all of my holdings to practice). Its “at least” revenue guide still slightly beat estimates by 0.2%. Its EBITDA guide beat consensus estimates by 2%.
Leadership told us that the first 6 weeks of Q1 2023 saw consistent demand acceleration throughout. Its December was a “bit slower than normal” but those trends have since fully normalized.
It plans to grow OpEx YoY in 2023 as it continues investing in more profitable growth.
d. Balance Sheet
Announced a new $700 million buyback to offset the $600 million founder package awarded to Jeff Green Q4 2021 in connection with eclipsing all performance benchmarks. I love this decision.
Stock comp was 25% of sales vs. 30% QoQ and 51% YoY when the founder package began vesting. That package will finish vesting by the end of 2023 -- but again now all of that dilution is being offset.
$1.45 billion in cash & equivalents.
$0 debt.
Leadership teased the idea of more M&A going forward.
e. Call & Presentation Notes
On Winning Despite Macro:
The Trade Desk’s report and guidance stood out among ad-tech. While peers cited a cautious ad market and issued underwhelming forward guidance, The Trade Desk encouragingly and convincingly bucked this theme. How? A few reasons. First, its open internet market share lead (on the demand side) gives it an inherent data and targeting advantage.
TTD has virtually all of the largest advertisers in the world feeding 1st party data to its algorithms to combine with ample 3rd party data. This means it can infuse more relevant insight into each impression purchasing decision and can segment individuals in a more precise manner. The result? Vastly bolstered Return On Ad Spend (ROAS). Specifically, for evidence, The Trade Desk cuts booking costs in half, and routinely delivers triple digit ROAS advantages thanks to this edge. As a result of more successful, higher return advertising campaigns, publishers can also enjoy higher impression bid prices so they can lower ad frequency, improve the customer experience and lower churn. It’s truly a win, win.
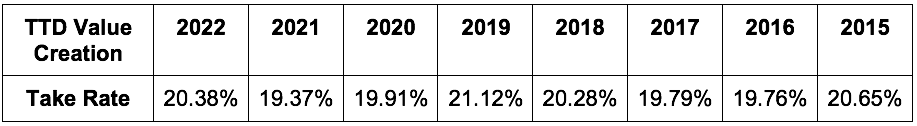
Some complain that The Trade Desk’s take rate is egregious, but considering the incremental, precision-based efficiency it fosters, the rate is well earned. And oh, by the way, that take rate has been consistent for 9 straight years now. So it appears that the world’s largest advertisers and agencies see no issue with it.
It’s all About the Return:
Especially amid poor macro when marketing budgets are being cut and return metrics obsessed over, The Trade Desk delivers in spades. When liquidity is abundant during boom times, marketers are pressured to place more and more dollars to drive growth. This makes them less picky. Well, when budgets are cut, that excess vanishes and selectivity becomes vital. Advertisers are pushed to be more discerning with finite dollars and they gravitate to only higher return placements. So? They’re pushed to The Trade Desk. This is why the firm took more share in 2022 than it did the previous 6 years; that momentum continued into 2023.
TTD’s 24% YoY growth for the quarter compares to a range of -2% to -9% YoY growth for its closest large competitors. Need more evidence? It quadrupled (on a large base) digital advertising growth in 2022 with 32% growth vs. 8% for the sector as a whole.
But there are more reasons for the outperformance. The Trade Desk’s bread and butter is CTV. It dominates this space on the demand side and is enjoying the large tailwind of Netflix, Disney and HBO embracing ads in 2022. This tailwind paired with rapid retail media growth serve as key contributors to its convincing outperformance. New partnerships here with Walmart, Target, Home Depot, Kroger, Meijer and many more continue to support its success. This past quarter it added Tesco & FairPrice (two large international grocers) to the large roster.
It is not fully immune to macro headwinds. It is more insulated than anyone else.
Unified ID 2.0 (UID2):
If The Trade Desk’s software, data scale and superior targeting algorithms are a delicious scoop of vanilla ice cream, UID2 is the chocolate sauce that goes on top. It extends and upgrades the targeting abilities of The Trade Desk by creating an always-on identifier to better understand who is actually behind the impression I’m buying.
Traction here is impressive:
The Trade Desk expects 75% of its gross spend to be UID2-tagged by Q2 2023 vs. 15% as of the end of 2021. Last quarter, the company guided to reaching 50% by Q4 2023 -- so clearly adoption is exceeding its expectations. And per Green, that adoption will allow The Trade Desk to “effectively solve the identity-matching challenge for the entire open internet beyond anything cookies ever accomplished with more privacy and consumer control.” The Trade Desk’s scale already insulated it from Google playing unfairly. This insulates it even further by making 3rd party cookies all but irrelevant for creating impression value.
Encouragingly, UID2 has also already won acceptance from key data infrastructure players like AWS, Snowflake, Salesforce and Adobe. Advertisers can use these integrations to query needed data and upload it into campaigns through TTD’s 1st party on-boarding feature called Galileo.
This merges more consistent identification with an ability for advertisers to easily tap into their lucrative, insight-packed data. Why does this matter? UID2 ensures customer identification. These integrations paired with The Trade Desk’s aggregated data indicate exactly what individual customers want to see.
More UID2 Notes:
UID2 is delivering 12X more relevant audience reach for Disney+ advertisers using it.
Paramount Advertising (Paramount, CBS etc.) integrated with UID2 during the quarter.
UID2 doesn’t directly drive revenue. It simply enhances impression value and uncovers more impression buying opportunities. That, in turn, eventually drives incremental TTD revenue.
Tearing Down the Walled Gardens:
Per Insider Intelligence, 2022 was the first year in which Meta and Google didn’t control more than half of digital advertising.
Green explained that as agencies growing tired of the secretive ways in which Google and Apple report marketing return metrics to advertisers. It’s somewhat of a “take my word for it” approach. This is part of what the Department of Justice recently deemed abusive activity in its new Google lawsuit.
At the same time, these walled gardens are dealing with more formidable competition within channels like CTV and its targeting precision plus honest reporting. And because The Trade Desk does not serve the supply side too, advertisers can be sure their impression purchases are being placed in a zero-bias manner. Google cannot honestly make this same claim but may need to in the future to maintain its dominant share.
All of this led to Green’s prediction that Google and other walled gardens would begin opening up their ecosystems in the coming years. Year after year, I’ve heard Green make bold predictions like this one. Year after year, they’ve come to fruition.
Streaming is Too Fragmented for Walled Garden Proliferation:
Streaming is not set up for walled gardens to thrive like search and social had been. Why? Nobody in streaming has monopoly or duopoly power. So? These more fragmented publishers have more incentive to play fair and plug their inventory into an aggregated bidding ecosystem to enjoy maximum impression prices. That’s the only way they can generate the rates needed to fund their premium content. None have the fire power on their own to create high enough impression value alone. They must collaborate and they must allow open bidding. Because a large chunk of these bids come from TTD clients through its platform, that’s great news for the company.
On a New Forward Market Product:
The Trade Desk will debut its new, “always-on” forward market product this year. Forward (AKA up-front) markets require advertisers to buy massive blocks of impressions once a year with little access to consumer data to guide pricing. Incredibly, up-front markets remain little changed since 1962 when they were created. The Trade Desk is changing that.
“We don't think that we have to compete with anything here other than a 1962 product.” -- Founder/CEO Jeff Green
Perks of this new tool include:
Larger piece of up-front spend for The Trade Desk.
Makes publisher impressions more valuable and advertiser returns higher due to the sheer amount of market inefficiency this resolves.
Allows The Trade Desk to be a better partner for advertisers as they shift from linear to CTV advertising.
On OpenPath:
As a reminder, OpenPath allows opted-in publishers to connect directly to TTD’s demand. This is NOT The Trade Desk working for the supply side. It is, however, The Trade Desk allowing publishers that want to perform their own supply side functions like yield management to do so. Considering most large streamers now own supply side ad-tech firms, this has been well received so far.
OpenPath cuts out a lot of the middlemen and unnecessary fees from the supply chain by blazing this direct line of demand and supply matching. This ability to “clean up the supply chain” should mean less proverbial mouths to feed and so better return metrics and impression prices for stakeholders.
On the Google Antitrust Lawsuit:
“The Department of Justice has clearly done their homework, which I'm encouraged by. I know there's some at Google suggesting that we've been through this 3-4 times before. I do believe that this is fundamentally different. And part of that is just because of how detailed I think the case is… We will win regardless of the outcome. We’ve won in an unfair market. Imagine what we can do with more fairness” -- Founder/CEO Jeff Green
As a reminder, the DOJ is suing Google over its involvement in both the supply and demand side of ad-tech. They claim it unfairly pushes advertisers to un-optimal impressions for its own gain because it makes more profit when those impressions are matched with its own supply or certain partners. Other complaints involve it reporting return metrics in intentionally opaque ways
f. My Take
This was a standout quarter. The Trade Desk fetches a valuation premium vs. all other ad tech names -- and for good reason. It has the scale, leadership and execution track record to insulate it from mega caps while providing the best returns in the open internet. The evidence is the rapid share gains and gaudy margins. I did trim a little bit of the position following the post-earnings pop as valuation is candidly getting stretched over the short term. For the long term, the runway is near-endless and its ability to capitalize is objectively clear.
2. Meta Platforms (META) -- The Year of Efficiency Continues
The Financial Times reported this past weekend that Meta Platforms will implement more job cuts in March. The firm still sees headcount bloat and a large cohort of remaining employees “getting paid to do nothing.” I know many of us have seen the viral videos of mega-cap tech employees walking us through their work days of luxurious meals and accommodations but no productivity.
Considering this, I wholeheartedly support the move and unfortunately see it as the correct decision. The impacted workers will enter a historically good job market (outside of tech) for finding new work and Meta will continue delivering incremental cost savings to feed its bottom line. If the last earnings call was any indication, these cuts could involve middle management layers that Zuck talked about removing to streamline decision making. If this is the case, payroll savings could be even more meaningful than with the first round of cuts.
This is the “year of efficiency” and it is clear that leadership continues to think they can trim more fat and do “more with less.” (what a cliché that term has become over the last year) Just a few quarters ago, it seemed as though Zuckerberg was unwilling to appease investors and markets while moving full speed ahead with investment plans. My how things have changed for the better. For now, this round of planned layoffs is leading to 2023 budget delays and mumblings of frustration from teams within Meta as they wait for spend approvals.
Other Meta News:
Marne Levine resigned from her role as the company’s Chief Business Officer. She had been with the company for 13 years.
Instagram halted its live shopping product as it continues to refine its commerce strategy.
Meta seems to be launching a competitor to Discord via its planned “Broadcast Chat Channels.” Mimicry is the most sincere form of flattery… and it’s good business.
Tencent is cutting its VR hardware program as it turns bearish on the space. This is concerning, but many institutions like McKinsey have called the Metaverse a more than $1 trillion market opportunity. Maybe Tencent just saw themselves falling too far behind.
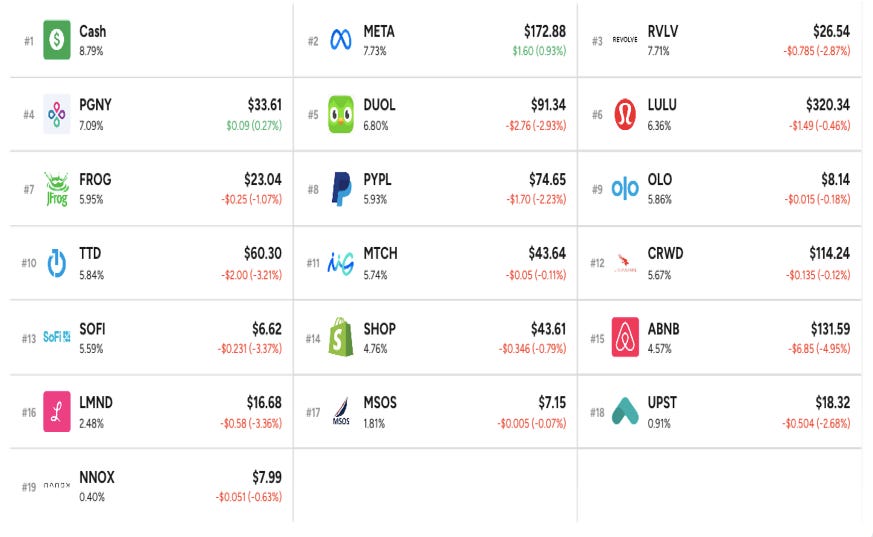
Savvy Trader is the only place where readers can view my current, complete holdings. It allows me to seamlessly re-create my portfolio, alert subscribers of transactions with real-time SMS and email notifications, include context-rich comments explaining why each transaction took place AND track my performance vs. benchmarks. Simply put: It elevates my transparency in a way that’s wildly convenient for me and you. What’s not to like?
Interested in building your own portfolio? You can do so for free here. Creators can charge a fee for subscriber access or offer it for free like I do. This is objectively a value-creating product, and I’m sure you’ll agree.
There’s a reason why my up-to-date portfolio is only visible through this link.

3. PayPal (PYPL) -- Crypto, a Case Study & an Insider Buy
a) Giant Eagle
PayPal released a new merchant case study involving Giant Eagle and its 494 U.S. locations. The large grocery chain was the first in its space to integrate both PayPal and Venmo as brick and mortar payment options. These payment methods are yielding higher repeat purchase rates and a boost to average order value (AOV) vs. alternatives along with shorter time to check out.
b) Crypto
Rumors are swirling that PayPal plans to launch a stable coin in the future. The troubled crypto space has seen countless examples of firms (including stable coins like Basis and Reserve) imploding over the last 18 months as excess liquidity abruptly vanished. Still, PayPal is not FTX or Binance and has carefully built and fortified global regulatory relationships over multiple decades. It’s easy to see how regulators would be more open to a stable coin from a vendor like this vs. a no-track record start-up. Still, this is just a rumor and even if it quickly comes to fruition, it’s unclear how it would impact PayPal’s financial results. Crypto is a microscopic portion of its total payment volume (TPV) today.
c) Insider Buy
Retiring CEO Dan Schulman bought about $2 million in stock via an open market purchase on Friday. This represents a 7% addition to his stake and around 1% of his total net worth.
4. Lemonade (LMND) -- France
BNP Paribas Cardif is partnering with Lemonade on renters/personal belongings insurance in France. This large cap European investment banking institution has well over $2 trillion in assets under management and will lean on Lemonade’s technology stack to modernize its insurance offerings to better cater to younger generations. Great sign. The program will enable BNP Paribas Cardif’s clients to secure policies and submit claims within seconds from any device. This can be done through its own website or the Lemonade app.
As part of this new arrangement, “BNP Paribas Cardif will propose this fully-digital product to its distribution partners” while Lemonade can use the incumbent’s 50 years of insurance data and pristine brand reputation. I love this method of global expansion for Lemonade. Its user interface, software and convenience-fostering automation are its differentiators. It’s very expensive to try and build a new book of business from scratch in each market (like we’ve seen in the U.S.). Considering this, why not merge its software-based strengths with a massive base of premiums to season its underwriting models and provide immediate traction? Good decision.
I’ve said it before and I’ll say it again: Lemonade remains a hated stock, but an executing company. It’s easy to rip on this firm when looking at the stock chart -- but it’s not its fault that markets gave it a sales multiple of 80X amid peak bubble mania. Leadership has consistently reiterated and even accelerated its path to profit timeline, has rapidly emerged as the renter insurance share leader in the U.S. among first time buyers and is enjoying brisk new product growth as well. There’s a reason why the Chief Claims Officer of USAA left his role there for a parallel move to Lemonade. If it keeps executing like it has over the last few years, the stock will surely take care of itself eventually. For now, it remains a small part of my portfolio, but I have no plans to make it any smaller like I’ve recently done with Upstart.
5. Datadog (DDOG) -- Earnings Snapshot:
a) Results vs. Expectations
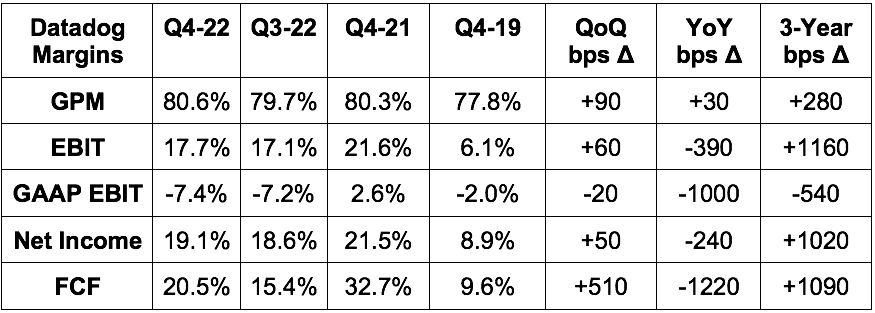
Beat revenue estimates by 4.7% & beat its guide by 5%.
Beat EBIT estimates by 43% & beat its guide by 43.3%.
Beat $.19 EPS estimates by $.07 & beat its guide by $.07.
Missed FCF estimates by 3.2%
Beat GPM estimates by 120 bps.
b) Balance Sheet
Stock comp was 21.7% of 2022 sales vs. 15.9% of sales in 2021.
Note that it acquired CoScreen, Hdiv, Seekret and Cloudcraft in 2022 which are in the 2022 comp number but not 2021.
Stock comp was 116% of free cash flow for the quarter.
Roughly $1.9 billion in cash & equivalents.
$738 million in convertible senior notes.
c) Forward 2023 Guidance
Datadog missed forward revenue estimates like many other software companies did. It was, however, a bit underwhelming to see profit estimates materially miss as well. Others saw revenue shortfalls in connection with prioritizing profits and in tandem with raising those profit estimates. Specifically for 2023:
Revenue missed estimates by 4.6%.
EBIT missed estimates by 18%.
EPS missed $1.13 estimates by $0.07 & so net income missed by 6.2%.
d) Call & Release Highlights
Results Context:
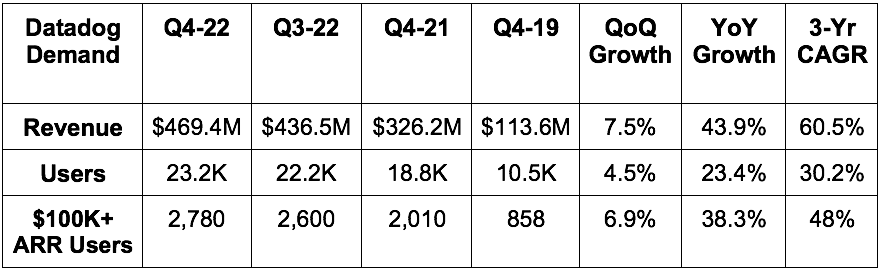
Dollar Based Net Retention has remained 130%+ for the last several years. This measures a customer cohort's revenue generation vs. that same cohort in the YoY period.
Gross retention remained in the “mid to high 90% range.”
Users contributing $1 million or more in annual ARR rose 46.7% YoY to 317.
The sales pipeline remains “healthy” as its new logo and cross-selling growth were both strong in Q4. It’s also “pleased” with initial product uptake despite the weak guide.
Datadog has 37% of the Fortune 500 as customers vs. 30% YoY.
Product, Customer & Partner News:
Integrated with Amazon Security Lake.
Debuted Universal Service Monitoring. This “detects micro-services across a firm’s environment for instant visibility into their health and dependencies.”
Highlighted 5, 7-figure annual recurring revenue (ARR) deals (one with a Federal Agency) landed during the quarter.
One of these new customers is expecting savings of $1 million in OpEx after 12 months.
Another one of these wins was a large-cap insurance company. Datadog is expected to generate a 115% 12-month return on investment for this new client.
Macro:
Like every other cloud company, Datadog is enduring a cloud usage optimization trend that is expected to be a material growth headwind throughout 2023. It plans to continue hiring and growing OpEx in 2023, but at a slower pace due to the uncertain backdrop. Still, it expects OpEx to grow roughly 30-32% YoY which is significantly faster than the 24% revenue growth implied in its guidance. The long term secular tailwinds remain firmly in place, but the short term outlook -- as evidenced by the 2023 guide -- is fragile due to macro.
It did add that the first few weeks of 2023 were off to a good start, but wanted to be “prudent” with its guidance rather than getting too excited with recent developments. If I had a dollar for every time I’ve heard the word “prudent” during this earnings season…
“In forming our guidance, we continue to use conservative assumptions compared to historical periods… We are incorporating an expectation for seasonally weaker growth in the Q1 due to the subdued growth in the month of December that creates a lower growth trajectory to start the year. While customers continue to expand with us, we are assuming that cloud optimization continues to affect our expansion in 2023. -- CFO David Obstler
6. Palantir (PLTR) -- Q4 Earnings Snapshot
a) Results vs. Expectations
Beat revenue estimates by 0.7% & beat its guide by 1%.
Beat non-GAAP EBIT estimates by 44.6% & beat its guide by 43%.
Beat $0.03 EPS estimates by $0.01.
Beat ($0.03) GAAP EPS estimates by $0.04. This was its first quarter of GAAP profitability which was aided by mark to market gains on equity investments.
Beat adjusted GPM estimates by 160 basis points.
b) Balance Sheet
Stock comp = 25.4% of sales vs. 29.2% QoQ & 35.0% YoY. Stock comp was 170% of FCF during the quarter.
$2.6 billion in cash & equivalents.
No traditional debt and $950 million in untapped credit capacity.
c) Forward 2023 Guide
Missed sales estimates by 1.3%.
Beat EBIT estimates by 10%.
Guided to positive GAAP Net Income for 2023 vs. expectations of a small loss. It’s unclear if this is operating leverage kicking in or continued benefits from mark-to-market equity investment valuation gains like this past quarter.
“I just met with the commercial team and see 40%+ commercial growth in the U.S. for 2023.” -- Founder/CEO Alex Karp
Leadership added that it expects U.S. commercial growth to reaccelerate in 2023 as well via 79% growth in new customers and a record quarter for trial conversion.
d) Call & Release Highlights
Results Context:
Commercial revenue grew 11% YoY to $215 million while government revenue grew 23% YoY to $293 million.
Net dollar retention was 115% in 2022 vs. 131% in 2021.
Commercial customers grew 41% YoY while revenue contribution from its largest 20 commercial customers grew 13% YoY to $49 million on average.
It signed 55 $1 million deals, 11 $5 million deals and 5 $10 million deals during the quarter.
Billings rose 21% YoY to $1.80 billion. This is a decent gauge of near future revenue growth, so it’s encouraging to see it outpacing this quarter’s revenue growth.
31.4% commercial revenue compounding since calendar 2020.
32.4% government revenue compounding since calendar 2020.
It ended the year with a $3.7 billion deal backlog.
Won Toyota and Cardinal Health as new clients during the quarter.
GAAP EBIT progress was credited to “disciplined spending and the normalization of stock comp after becoming a public company.”
Macro:
Palantir called out revenue and deal value growth weakness from the companies in its investment portfolio as the most pressing exogenous tailwind facing the firm. Considering government revenue is its largest channel, it’s less prone to macro-based weakness than companies more skewed to the private sector.
Palantir will continue to hire, but at a slower place in 2023 vs. 2022 (noticing a theme?).
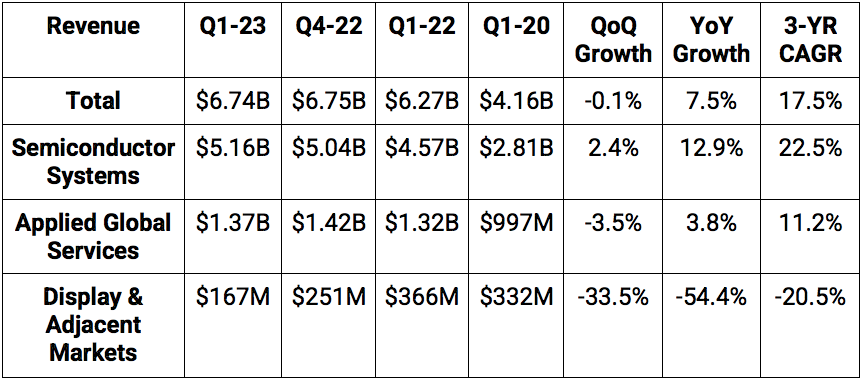
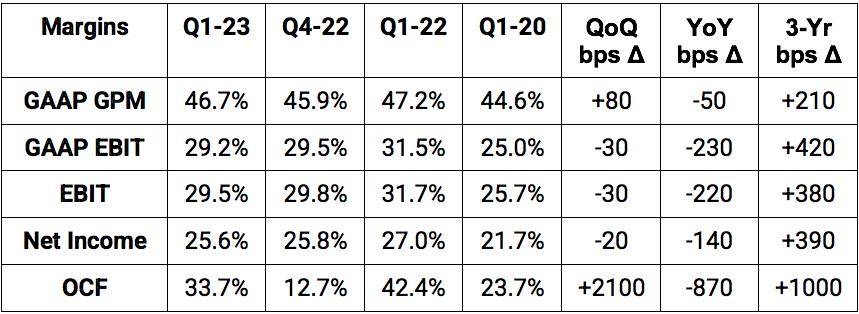
7. Applied Materials (AMAT) -- Fiscal Year Q1 2023 Earnings Snapshot
a) Results vs. Expectations
Beat revenue estimates by 1.2% and beat its revenue guide by 0.6%.
Guidance included the expected impact of recently updated U.S. semiconductor export restrictions.
Beat non-GAAP EBIT estimates by 3.1%.
Beat $1.90 GAAP EPS estimates by $0.12.
Beat $1.92 EPS estimates by $0.11 & beat its guide by $0.10.
b) Balance Sheet
$4.05 billion in cash, equivalents & short term investments.
Inventory rose by a modest 2.0% YoY.
$5.46 billion in long term debt and $200 million in current debt.
Bought back $250 million in stock vs. $1.5 billion QoQ & $1.8 billion YoY. Buyback cadence is slowing. It also paid out another $220 million in dividends.
c) Q2 2023 Forward Guide
Beat revenue estimates by 0.8%. This includes an anticipated impact from ongoing supply chain issues and a $250 million headwind from a recent cybersecurity incident for MKS Instruments -- one of its suppliers.
Beat $1.76 EPS estimates by $0.08.
d) Call & Release Highlights
Macro:
The company was a bit more optimistic about the near-term picture than some of the competition this past quarter. It did cite consumer technology demand slowdowns, but also said AI, automotive and industrial markets were offsetting this weakness & then some. It also boasted surprisingly resilient backlog strength which hints at durable forward-looking demand.
Near term, customers are trimming incremental capacity plans, but “they remain fully committed to strategic investments in advanced nodes to win next generation tech leadership.” The most positive part of the relatively strong report was its commentary on the Integrated Color and Advanced Process Control System (ICAPS) demand environment. It now sees spending here growing YoY vs. expecting flat to slightly down spend as of last quarter.
Over and over again on the call, leadership reiterated that it was positioned to “outperform the market in 2023” as macro headwinds rage on. Still, it did assure investors it would continue to prioritize better productivity. It is restricting hiring to key areas and slowing OpEx growth in most areas besides R&D.
Results Context:
For an idea of how strong this report was vs. competition, analyst revenue and profit estimates for AMAT for next year actually rose slightly following the report. For Lam Research (direct wafer fabrication competition), revenue estimates fell by 10% with profit estimates lowered by 15.7%. For KLA Corporation (wafer, inspection and metrology competitor), analysts lowered revenue assumptions for 2023 by 4.8% and profit estimates by 9.1%.
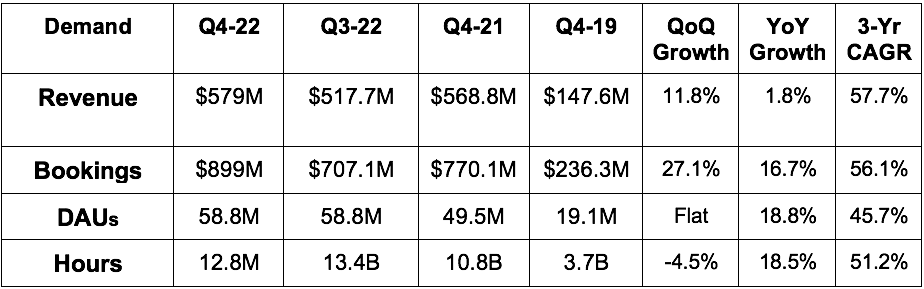
8. Roblox (RBLX) -- Q4 Earnings Snapshot
a) Results vs. Expectations
Beat bookings estimates by 2.6%.
Beat EBITDA estimates by 78%; Beat EBIT estimates of ($330M) by 8.7%
Beat ($.54) EPS estimates by $0.08.
Missed GPM estimates by 60 bps.
*Sharply missed $18M FCF estimates by $56M. This was due to acquired property and equipment which counts as CapEx. This is also being influenced by current data center projects and real estate expansion. For evidence, operating cash flow (OCF) was $119.2 million for the quarter representing a 20.6% margin.*
b) Balance Sheet
$3B in cash & equivalents.
$988M in long term debt.
c) Forward Guide
Roblox doesn’t guide to full quarterly results. It does, however, consistently give us color into how the first part of the current quarter is going. For the month of January:
Revenue was roughly $215 million for 23% YoY growth (200 basis point FX headwind).
Bookings were roughly $270 million for 20% YoY growth. (300 basis point FX headwind).
DAUs rose 19% YoY to 65 million, hours engaged rose 19% YoY to 5 billion.
“We expect to continue to report net losses for the foreseeable future even as we anticipate generating cash from operations.” -- Shareholder Letter
d) Call & Release Highlights
Roblox will no longer publish monthly metrics starting in April 2023. That will mark 2 years of it reporting these metrics since going public and it thinks that has offered sufficient context for modeling seasonality in its business. It wants to “take the long view” and sees reporting progress every 30 days as contradicting that aim.
Results Context:
Revenue growth trails bookings growth because it “defers most of the expected revenue over the estimated paying user’s life.” It continues to extend this estimated life which leads to longer and more dispersed periods of revenue recognition. Please note that this was the main reason for gross margin expansion as well.
User growth was highest among 17-24 year-olds. This age cohort represents 22% of Roblox’s DAUs and 23% of hours spent on the platform.
Europe was the strongest region for user growth at 24% YoY vs. 21% in APAC and still a lofty 19% in North America.
Monthly Unique Payers rose 14% YoY to 13.4 million with average bookings per payer rising 3% YoY to $22.31 despite FX headwinds.
Bookings for 2022 rose 5.4% YoY to $2.9 billion; revenue rose 16% in 2022 to $2.2 billion.
Net losses are continuing to grow “due to higher expenses required to support growth and also deferring more revenue to later quarters.” This helps gross margin but hurts operating and net margin.
Active Developers on the platform rose 33% YoY.
Signed The NFL, FIFA, Elton John and Mariah Carey as new content partners for 2023.
Macro:
Roblox continued to hire throughout 2022 with plans to do so in 2023.
Sign-ups, frequency, engagement & monetization continue to consistently grow beyond the pandemic pull-forward.
9. Macro
a) Key Data from the Week
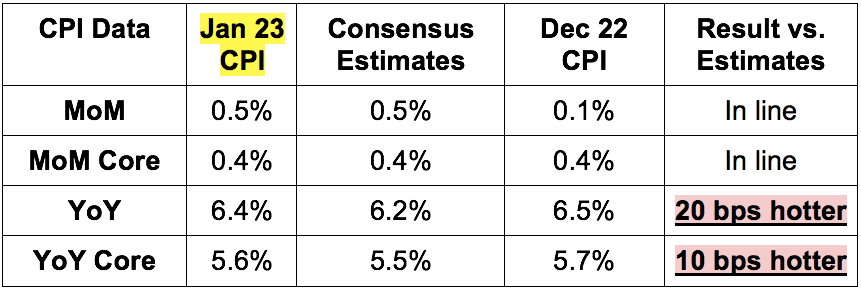
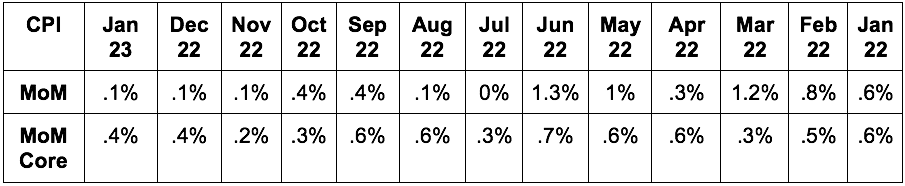
CPI Data
More Inflation Data:
Core MoM PPI was 0.5% vs. 0.3% expected and 0.3% last month.
MoM PPI was 0.7% vs. 0.4% expected and -0.2% last month.
Export Price Index MoM for January was 0.8% vs. -0.2% expected.
Import Price Index MoM for January was -0.2% as expected.
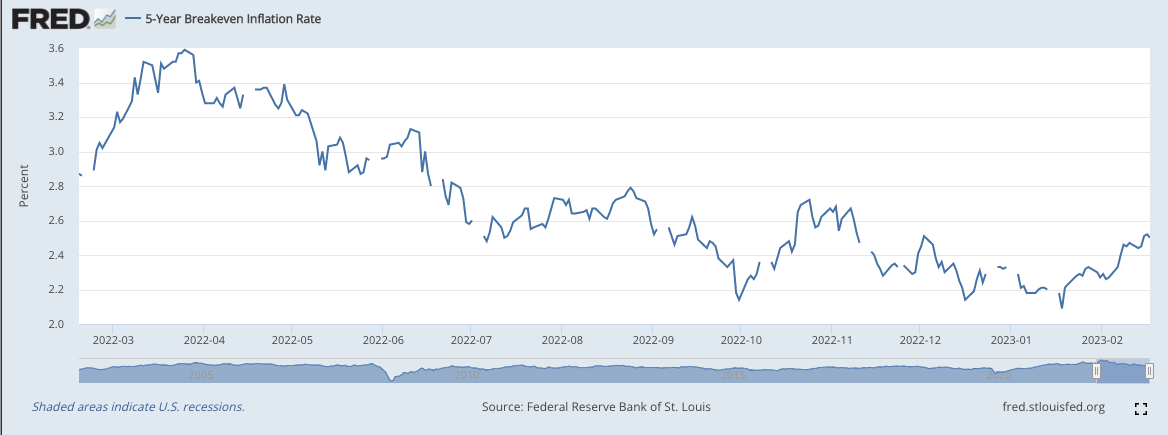
5-year breakeven inflation ticked down a bit this past week:
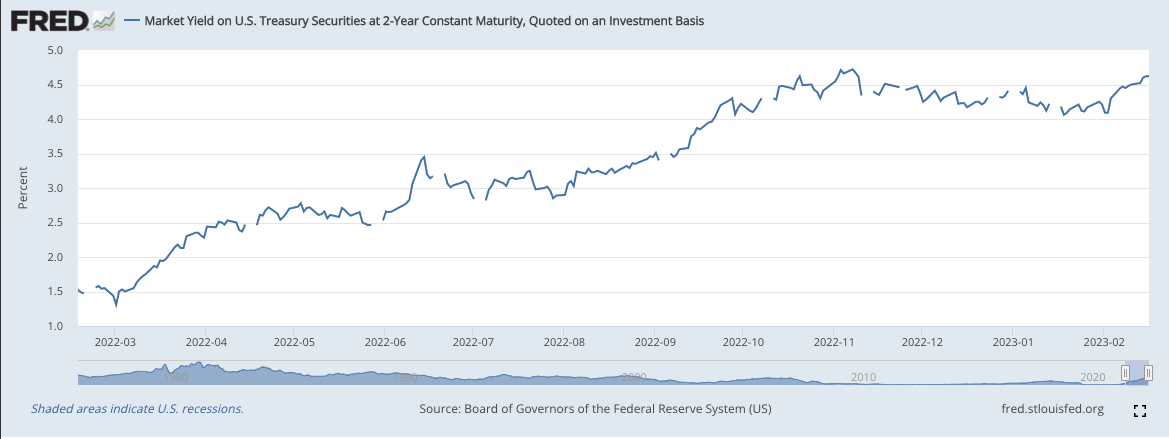
The 2-year yield raced back to 52 week highs and deepened its inversion with the 10-year yield. That inversion is being greatly amplified by quantitative tightening:
Consumer & Employment Data:
Core retail sales rose 2.3% MoM in January vs. 0.8% growth expected and -0.9% growth last month.
Real sales rose 3% MoM in January vs. 1.8% growth expected and -1.1% growth last month.
Initial Jobless Claims continue to be better than expected. They came in at 194,000 for the month vs. expectations of 200,000.
Economic Output Data:
NY Empire State Manufacturing Index for February was -5.8. This actually beat expectations of -18 and compares to -32.9 last month.
Philadelphia’s Fed Manufacturing Index reading was -24.3 for February vs. -7.4 expected and -8.9 last month.
Industrial Production MoM in January was flat vs. expectations of 0.5% growth and -1% growth last month.
Business inventories rose 0.3% MoM in December as expected.
January Building Permits (forward looking indicator) of 1.339M vs. 1.350M expected. Housing starts also slightly missed.
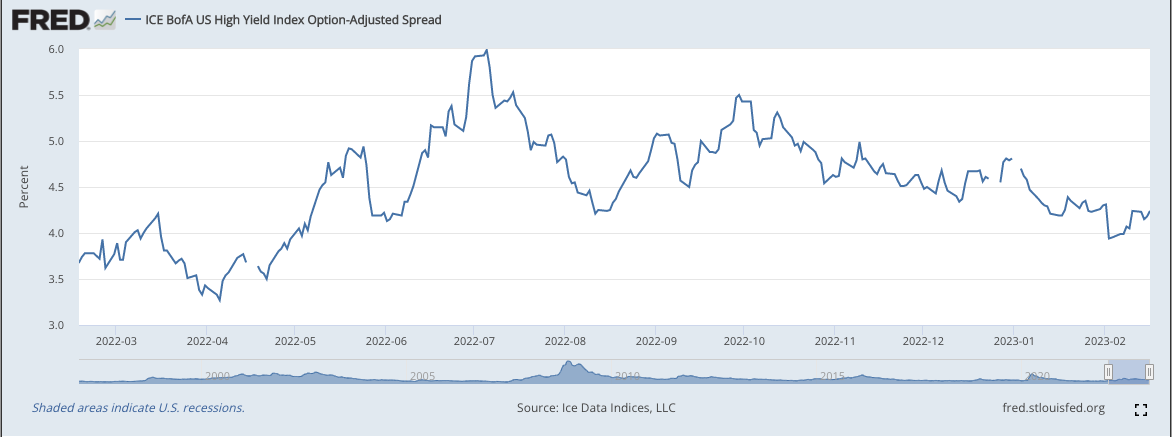
High Yield Option Adjusted Corporate Credit Spreads unfortunately ticked higher during the week:
b) Level-Setting the Data
Inflationary data from the week wasn’t alarmingly bearish, but it was hotter than the trends we’ve seen since late last year. One month is not enough to mark a trend, but it will likely force me to take a more cautious approach to portfolio and cash management if that trend continues for a few months.
As of now, I still expect another 25-50 basis points of rate hikes, I still expect a long pause starting in the 2nd quarter of the year and I still remain 91% invested at the moment. Despite the disappointing readings this week, inflation and economic output data are still cooling faster than the employment market is weakening. I’ve said it before and I’ll say it again: This bodes well for giving the Fed permission to pause in the near future rather than runaway inflation forcing it to hike us beyond a mild recession (my base case) and into a depression.
10. My Activity
I trimmed 50% of my Upstart stake following its earnings report. My thought process was published in the mid-week earnings review and can be found here.
I trimmed 9% of my Duolingo stake. After aggressively averaging in all the way down and the stock price’s subsequent recovery, it quickly became my largest holding. But still, it’s 2 years away from GAAP profitability and trades for about 100X optimistic 2023 EBITDA estimates. The still hawkish macro environment, its lack of income statement profitability and the lofty multiple led to this decision. It remains one of my largest holdings.
I trimmed 11% of my stake in The Trade Desk after the large pop following its earnings report. This was also a matter of the multiple rapidly becoming quite extended. I wanted to take some easy profits.
I see a growing probability of me starting new positions in Uber and Google in the coming weeks or months. Stay tuned.
While I do fully consider myself a long term investor, I am an active long term investor. As I’ve said in the past, I consider about 33% of each position to be more tradable around multiple expansion or contraction. As things get extended, I’ll trim. As things get overly pessimistic, I’ll add. And I’ll do so while always staying predominately invested. This is what I have found works well for me.
Great stuff as always, Brad! I know you exited PENN but any interest still out there in sports betting stocks? In particular wondering if you've ever reviewed league data rights holders such as Genius Sports (GENI) or Sportradar (SRAD)?
on TTD -everything is great and great tailiwinds but
"Announced a new $700 million buyback to offset the $600 million founder package awarded to Jeff Green Q4 2021 in connection with eclipsing all performance benchmarks. I love this decision."
Stock comp was 25% of sales vs. 30% QoQ and 51% YoY when the founder package began vesting. That package will finish vesting by the end of 2023 -- but again now all of that dilution is being offset "
The dilution offset costs real money to the shareholders . it is hardly a partnership a la Buffett when the SBC is so egregious . This company will do well but share holders will not benefit much due to wedge created by the SBC