

News of the Week (February 19 - 23)
News of the Week (February 19 - 23)
Palo Alto; CrowdStrike; Mercado Libre; Nu Holdings; Block; Walmart; Home Depot; Intuit; Progyny; Macro; Portfolio

Today’s Piece is Powered By My Friends at BBAE:

1. Palo Alto (PANW) & CrowdStrike (CRWD) – PANW Earnings Review & CRWD/Cybersecurity Implications
Palo Alto is a cyber security company competing across endpoint, cloud and network use cases. Most of its platform is made up of integrated M&A while it competes with pretty much everyone besides identity brokers in the space. The network security suite is called Strata; the endpoint security suite is called Cortex; the cloud security suite is called Prisma.
a. Demand
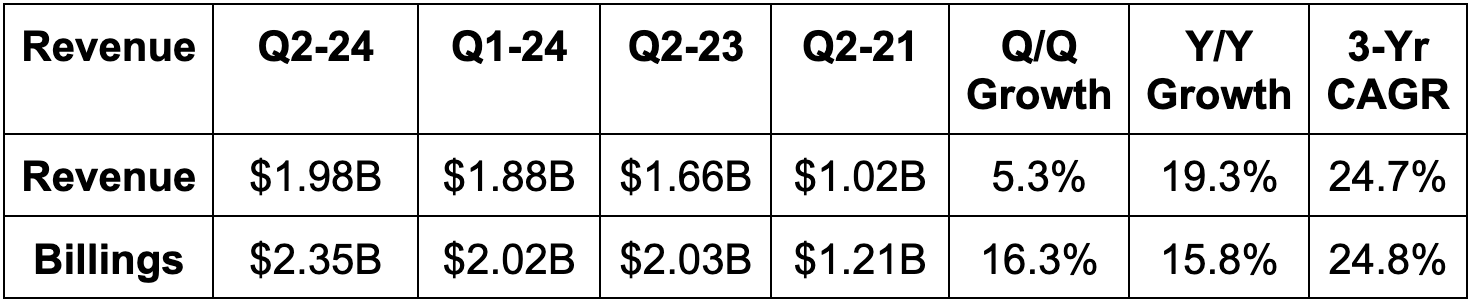
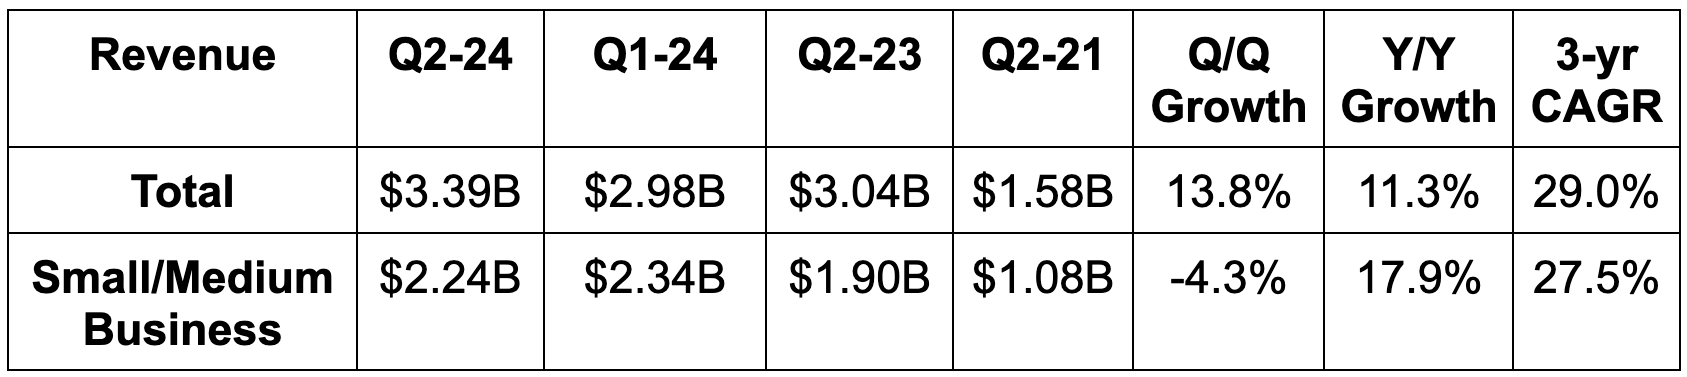
Palo Alto missed billings guidance by 0.4%. It met revenue estimates and met its same revenue guidance.

b. Profitability
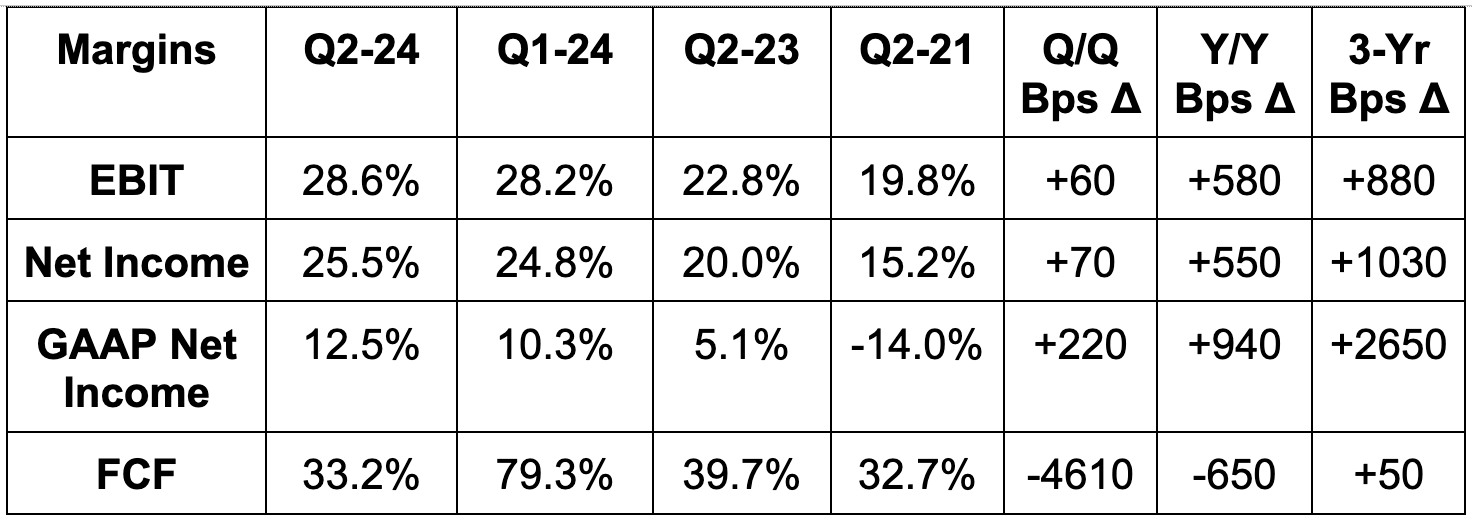
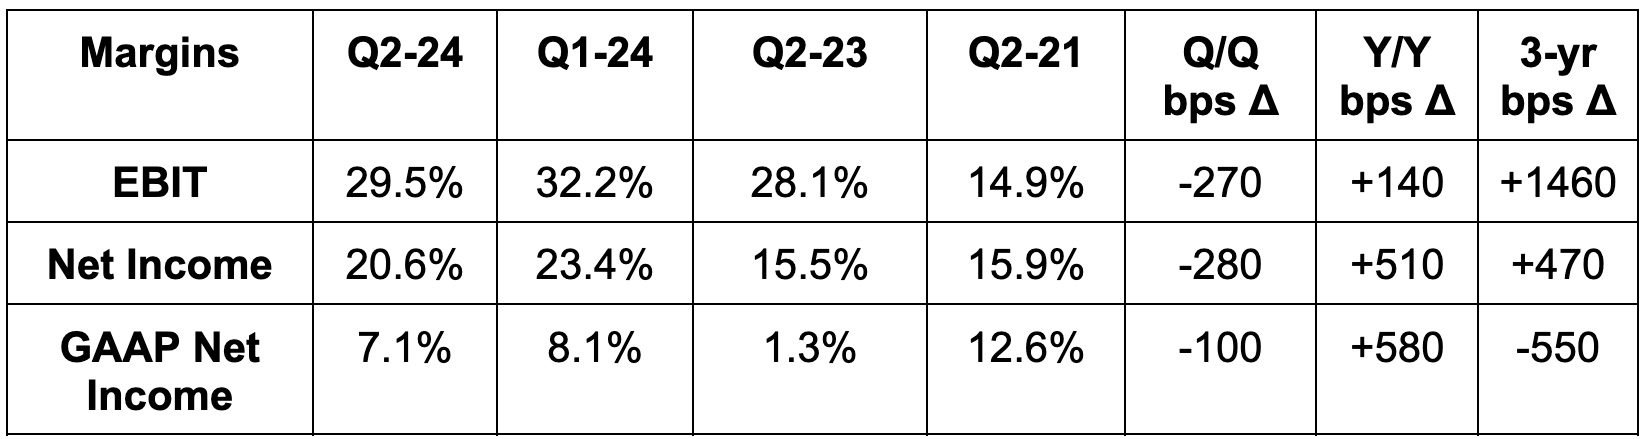
Beat EBIT (operating income) estimates by 10.6%.
Beat free cash flow (FCF) estimates by 3.7%.
Beat $1.30 earnings per share (EPS) estimates & beat its same guidance by $0.16 each.
GAAP net income for Q2 2024 excludes a one-time, $1.5 billion tax benefit. EPS rose 39% Y/Y without this tax help.

c. Balance Sheet
$3.3 billion in cash & equivalents.
$3.6 billion in long term investments.
$1.82 billion in convertible senior notes. No traditional debt.
Diluted share count rose by 8.9% Y/Y. This must slow down.
d. Annual Guidance & Valuation
For Palo Alto’s fiscal year (FY) 2024, it lowered billings guidance by 5.6%. I’ll explain the reasoning for this in the next section. It also lowered revenue guidance by 2.4%, which missed estimates by 2.6%. Conversely, it raised EBIT margin guidance by 50 bps, which beat estimates by 45 bps. Finally, it slightly raised EPS guidance to $5.50, which met estimates.
Palo Alto now expects to fall short of the 3 year demand targets it set just 6 months ago. It still expects to meet the profit targets.
The firm trades for 47x FY 2024 EPS and 28x FY 2024 FCF. EPS is expected to grow by 24.2% Y/Y while FCF is expected to grow by 16.7% Y/Y.
e. Call & Release Highlights
Platformization:
The theme of 2023 software earnings was the power of the platform (i.e. multiple integrated services). As I’ve discussed repeatedly, software vendors able to displace more point solutions, drive better product cohesion, deliver superior efficacy and lower cost are standing out. ServiceNow was a great example from this current season. This quarter told us that Palo Alto has more work to do in its journey of turning Cortex + Prisma + Strata into a unified, interoperable platform. Palo Alto is changing its go-to-market approach to accelerate what it calls “platformization.” This simply refers to cross-selling more of its products to clients to displace other vendors. Customers of more than 1 of its 3 platforms deliver a a 5x value boost while users of all 3 generate a 40x value boost. Cross-selling is deeply positive for Palo Alto’s business, so it’s getting more intentional about driving that trend.
Up until this quarter, it had been assuming that customers will “platformize” at their own pace. It was basically waiting for competing contracts to expire before trying to cross-sell (why?). Now, Palo Alto will get more aggressive by pursuing those customers before expiration to tee them up for more expedient up-selling. As part of this, it will offer things like free trials to signed future customers until contracts with other vendors expire. That, it thinks, will allow it to deliver proof-of-concept and easier platformization upon contract extension. This also means Palto Alto will “share in the customer’s platformization risk” via forgoing revenue for a period of time. Ideally, this wouldn’t be necessary and it could deliver that proof of concept as part of its request for proposal (RFP) responses. I guess that’s not feasible. This change will lead to billings weakness over the next 12-18 months, with growth expected to accelerate afterwards as comps normalize.
Weakness in the product/hardware revenue bucket intensified the billings guidance weakness. Palo Alto cited “competitors rolling back price increases” and participating in “rogue pricing behavior.” I’m confident that leadership was talking about Fortinet, as it told us this behavior was coming mainly from legacy vendors on the product side (so probably firewalls). This “rogueness” is yet another reason why Palo Alto wants to drive platformization. It thinks cross-selling the rest of its product suite within network security separates it from Fortinet and others.
Leadership talked about “spending fatigue” within cybersecurity as companies push back against adding more products without realizing a positive return on investment (ROI). Platform-powered vendor consolidation is how to deliver the positive ROI they’re increasingly demanding.
“Despite many demand drivers, we’re beginning to notice customers face spending fatigue in cybersecurity. This is new. Adding incremental point products is not driving better outcomes. There’s more focus on ROI from more clients.” – Founder/CEO Nikesh Arora
These were 2 of the 3 reasons why billings guidance was so disappointing.
Public Sector Weakness:
Public sector weakness was the 3rd material source of the billings guidance shortfall. Palo Alto is struggling to close important U.S. federal government contracts. This started in Q1 and worsened this quarter. It thinks this trend will continue in Q3 and Q4. CEO Nikesh Arora blamed this on a miscalculated revenue ramp from a large program. It fully staffed up for this business, which didn’t “materialize at the pace or spending levels expected.” Arora told us that updated guidance takes a “very cautious” approach to how this program will ramp going forward. Hopefully that means PANW is gearing up for an easy quarter of under promise, over deliver.
Billings for this current quarter were in line despite these headwinds. That was related to “having to make up the billings number with shipping some non-product backlog,” per the team.
Next-Gen Thriving:
Next-Gen Security (NGS) annual recurring revenue (ARR) was the standout for Palo Alto this quarter. It doesn’t expect the go-to-market change to impact growth here all that much. It reiterated the NGS portion of its 3 year targets offered last August and didn’t cite any macro or selling headwinds for this category. It also guided to annual NGS growth of 34.5% this year. It sees NGS growing significantly as a % of total revenue; that will boost recurring revenue above 90% of total over time.
Within Network, its secure access service edge (SASE) next-gen product grew by 50%+ for the 5th straight quarter. Next-gen cloud security also enjoyed its highest new contract volume in over a year with 3+ module customers rising 60% Y/Y. 30% of its new SASE customers are brand new to the company, which shows this product becoming a solid lead gen for new clients along with being a compelling up-sell candidate.
SASE combines network security tools (like URL filtering and data loss prevention) to prevent unauthorized access, network abuse and to promote broad hygiene visibility. It’s a large chunk of its “Zero Trust” offering. Zero Trust means requiring more consistent verification after a device or user enters an environment. This ensures a bad actor cannot breach the most vulnerable piece of a tech stack and move throughout it unchecked thereafter. Zero Trust is an imperative aspect of its platformization approach within network to win vs. legacy firewall players (who lack an effective Zero Trust approach).
In endpoint, Extended Security Intelligence and Automation Management (XSIAM) was a large driver of the biggest contracts secured during the period. XSIAM users within Cortex deliver 5x higher lifetime value to PANW vs. non-users. XSIAM is similar to CrowdStrike’s and SentinelOne’s extended detection and response (XDR) products. It infuses 3rd party data sources (beyond the endpoint) into the endpoint protection process to uplevel security and aid remediation. XSIAM bookings overall again neared $100 million for the period.
NGS powered 36% spending growth Y/Y within its 10 largest customers. It also facilitated 22% Y/Y remaining performance obligation (RPO) growth. The legacy pieces of this model are struggling; the disruptive piece of this model is working.
AI:
Palo Alto is in alpha or beta testing for its planned GenAI products. When I heard that, all I could think was “what took you so long?” CrowdStrike is already gearing up to directly monetize its Charlotte AI security assistant. ServiceNow has already debuted assistants and its Vancouver platform. CloudFlare has already debuted compelling updates to its Workers AI platform. SentinelOne is already monetizing GenAI tools too. Palo Alto should be going faster here. It has the scaled 1st party data source, the talent and the balance sheet to carve its niche within this monstrous opportunity. So, go faster.
It sees a couple of opportunities in GenAI. All of them center around demand for cloud-based app, traffic and data security proliferating. This proliferation will naturally prop up demand for products like Palo Alto’s. It also has copilots in beta testing to automate mundane and tedious security tasks.
f. Take & Implications for CrowdStrike & Other Cybersecurity Disruptors
This was a good quarter and a poor guide. The excuses used to explain the shortfall create new and significant execution uncertainty for Palo Alto. The company has been a remarkably consistent performer for years, and this broke that trend. One quarter shouldn’t be enough to ruin an investment case for bulls, but if I were a shareholder, this would be on a somewhat tighter leash going forward.
With that said, I think these struggles are more specific to Palo Alto rather than evidence of broader sector weakness for the disruptors in the space. I’ll frame this conversation around CrowdStrike, but I think the same idea applies to SentinelOne and also Cloudflare and Zscaler despite those two being in network security where the aforementioned discounting is occurring. So why am I not yet concerned?
First, the federal market weakness is specific to Palo Alto. The challenges that began to creep up last quarter were not at all felt by CrowdStrike. CrowdStrike, conversely, talked up robust public sector activity as contributing to its positive results.
Next, the pricing pressures hurting Palo Alto are not within Next-Gen Security. NGS performed very well. The call made it clear that this is being felt within hardware and firewall-based revenue. Cloudflare told us nothing about pricing pressures hurting its network security business a couple of weeks ago. Fortinet has been the fundamental straggler talking about difficult market conditions. I’m confident that’s where the “rogue pricing” and competitive headwinds are coming from. That is irrelevant for CrowdStrike and the others I’ve mentioned.
Furthermore, if PANW is skating to where the puck is going by pushing to build a more cohesive platform, it’s skating to CrowdStrike. CrowdStrike routinely displaces 10+ point solutions thanks to its end-to-end cloud and endpoint security platform (called Falcon). Macro headwinds have been a tailwind for CrowdStrike’s market share gains. Why? Because of the superior value that it provides and the heightened need to seek out strong investment returns when the backdrop sours. Hints can be frequently found in the long list of Microsoft, SentinelOne and Palo Alto displacements it secures year after year and its soaring market share.
Falcon operates under one interface, one light-weight agent and with all-but-endless 3rd party integrations. This means customers can basically have whatever they want in the Falcon ecosystem. CrowdStrike IS the overarching platform in these categories outside of network security. It then frequently works with Zscaler on the network security side to conjoin product suites in big deals and emulate Palo Alto’s 3-pronged platform.
But wait, there’s more. Palo Alto cited a pressing need to improve managed breach remediation for customers. CrowdStrike’s aggregate product bucket enjoys what most see as a material tech lead vs. the field in remediation. That lead is perhaps the largest in managed detection and response (MDR) where CrowdStrike meshes its massive data set, Falcon Threat Graph and world-class threat hunters to remove the headache from client cleanups. That’s an important pillar in Palo Alto’s platformization push, and CrowdStrike is (in my view) well ahead there.
All of the cited factors result in CrowdStrike’s unmatched recipe for growth, scale, margin, leverage and market opportunity. That’s the financial byproduct of its product suite. CrowdStrike the company is a gem and the Palo Alto report does nothing to change my subjective view there. Still, CRWD expensive! Some would say very expensive. The numbers should be very good when it reports next month. The stock could easily shrug off the positive data and healthily digest recently explosive gains. Regardless, I do not expect the results to change anything about my point of view.
2. Latin American Earnings Season – Mercado Libre & NuBank
a. Mercado Libre (MELI)
Demand:
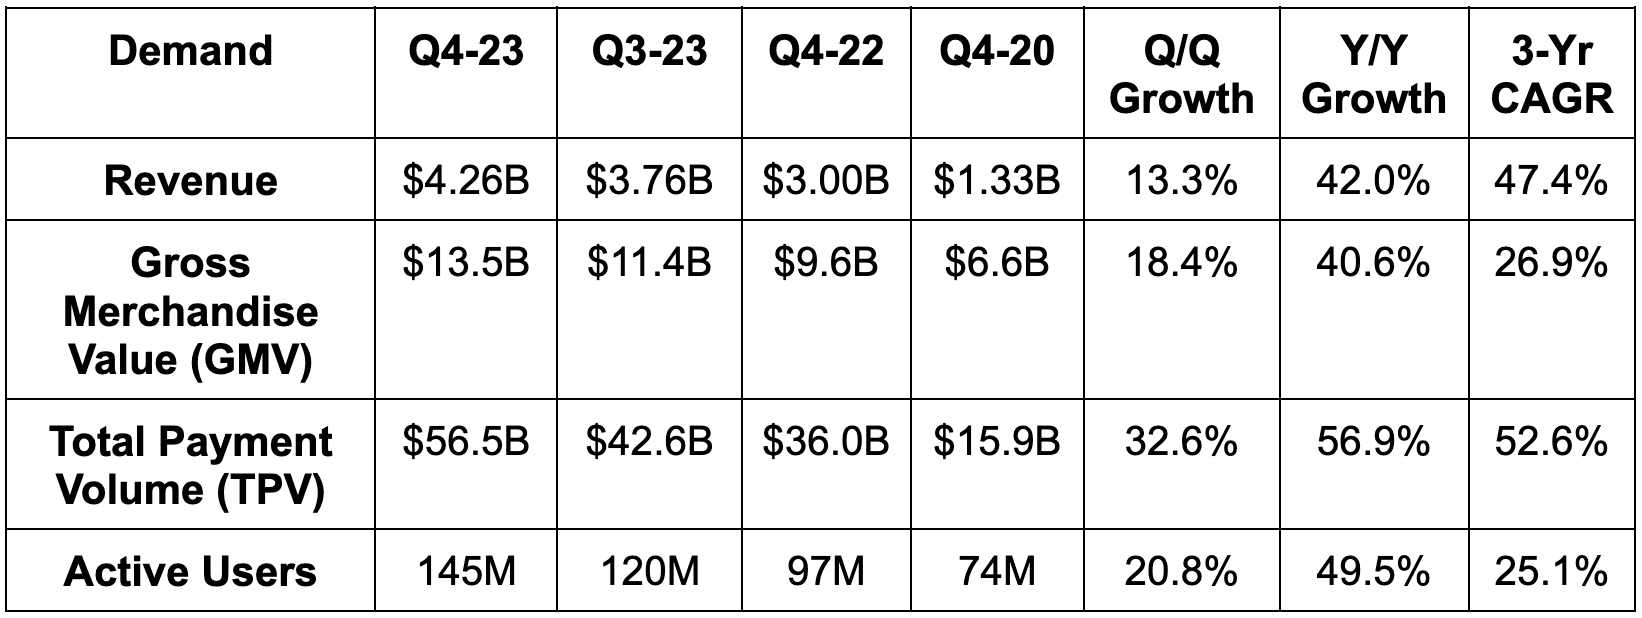
Mercado Libre beat consensus revenue estimates by 3.1%. Foreign exchange neutral (FXN) revenue growth was 83% Y/Y and constant currency revenue was its fastest in over a year. FXN gross merchandise value (GMV) rose by 79% Y/Y.
Profitability:
The firm sharply missed GAAP EBIT expectations by about 60% and GAAP net income expectations by about 50%. More context is needed here. The GAAP “misses” include $351 million in charges related to legal proceedings and tax disputes. It thinks it will lose the related hearings, so the company incurred the provision charges. Despite this being tax related, the costs were incurred in the cost of revenue and OpEx buckets. That is why it impacted GAAP EBIT so heavily and not just GAAP net income (because GAAP net income is after tax and GAAP EBIT is pre-tax).
Excluding this one time hit, EBIT missed by 12.1% and rose by 78% Y/Y for a 13.4% margin. Net income of $165 million would have been $383 million for a 12.1% margin. That represents GAAP EPS of $7.56 vs. expectations of $6.96. Excluding the one-time hits, margin expansion was despite higher rates of free shipping (discussed below), capacity expansion investments, more first party selling (lower margin but strategic) and postponed price hikes in Brazil.
Balance Sheet:
$6 billion in cash & equivalents.
$5.3 billion in debt.
Share count fell slightly Y/Y.
Valuation:
MELI trades for 57x expected 2024 earnings and 34x expected 2024 FCF. EPS is expected to grow by 46% Y/Y and FCF is expected to shrink by 20% Y/Y.
Call & Release Highlights:
Commerce for Consumers:
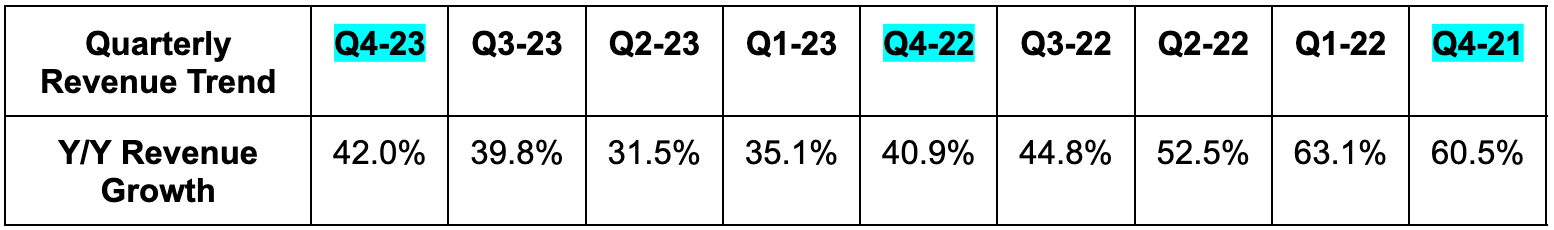
MELI delivered its fastest FXN commerce revenue growth rate in over a year as it continues to rapidly take share in all markets. Unique buyer growth rose to its fastest clip since the pandemic; items sold growth accelerated to 29% in Q4 for the fastest rate of growth since 2021. I guess you might say it was a good quarter… and you’d be right. Acceleration across key performance indicators and key geographies was enjoyed across the board.
To leadership, this illustrates their strategy working and the several years of investments leading to improving user value. It’s the continued formation of a deepening competitive moat. Most of those improvements on the customer side are small & subtle in nature, but aggregate to form something truly unique to the region. As part of its Meli+ loyalty program, for example, it recently added a new option to schedule shipments on a set day each week for free fulfillment. This led to free shipping proportions setting new records in Brazil and Mexico as traction for the program and perk builds. As an aside, this led to the small Q/Q decline in take rate, which is a trade-off that leadership is happy to make. The effect of these tweaks working can be seen in orders per unique buyer, which rose from 7 to 7.6 Y/Y.
Interestingly, MELI is greatly leaning into 1st party GMV. It wants to vertically integrate more of its marketplace and more of its supply chain. It thinks this will allow it to offer better service and unleash more flexibility to enhance consumer value as it rounds out a superapp. Improved pricing, selection and inventory picking algorithms are resolving previous internal bottlenecks that prevented 1st party proliferation. And? 1st party GMV rose by 85% FXN Y/Y. As part of this evolution, Meli is finding growing success within consumer electronics – the largest e-commerce category in Latin America. The 1st party algorithm investments and better supplier relationships led to 140% FXN growth for the category in Brazil this quarter. That’s despite consumer electronics growth in that market for Q4 being negative overall.
Commerce for Merchants:
MELI continues to roll out 3rd party seller tools as it pursues both 1st and 3rd party GMV growth. It launched a new affiliate program and short-form video clips to juice seller traffic and conversion. Both debuts are working as expected. Furthermore, improved delivery timeline accuracy is boosting 3rd party merchant conversion further. That means more revenue and profit for MELI. Win, win.
Meli added 50,000 new advertisers to its network in 2023. Most are self-service, but it recently debuted new tech to manage more of the targeting and reporting for larger buyers. Advertising revenue was above 70% FXN for the 7th straight quarter.
Logistics/Fulfillment:
MELI is now delivering 52% of orders same or next day vs. 54% Q/Q & 51% Y/Y. The sequential decline was due to consumers choosing slower, cheaper options and more deliveries to regions further away from its fulfillment centers.
It continues to build out new capacity in Brazil and Mexico. In Brazil, this led to its internally serviced fulfillment rate rising from almost 40% to almost 50% Y/Y. Mexico capacity additions helped ease fulfillment bottlenecks that it had been dealing with there.
Total Payment Volume (TPV):
MELI splits TPV into three buckets. Acquiring TPV is payments processed for merchants; Digital Account TPV is payment volume within MELI’s mobile wallets (bill pay, peer-to-peer etc.); Off-platform TPV is volume from other merchant sites utilizing Mercado Pago as the checkout gateway. There is overlap between off-platform and acquiring TPV. Acquiring TPV rose 104% Y/Y FXN while digital account TPV rose 259% Y/Y FXN and off-platform TPV accelerated across every single market.
MELI thinks it’s one of the largest acquirers in LatAm today.
QR processing is thriving in Argentina; point of sale (POS) processing is thriving in Mexico.
In Brazil, it’s seeing greenshoots from its previous reorganization of its POS go-to-market. Investment payback periods are shrinking, which should let it get aggressive with nurturing Brazilian POS volume.
Financial Services:
MercadoLibre’s interest earning consumer accounts doubled Y/Y to reach 30 million. Growth was rapid in all regions. It sees this as a wonderful top-of-funnel for future cross-selling. MELi can offer a compelling savings yield to delight customers, get them into the ecosystem and then monetize with all of the other products the firm provides. It’s willing to use this high-yield savings account as a lower margin lead generator to boost highly engaged new accounts. This is clearly playing out in every market as it enjoys a TPV uplift that directly correlates with account growth. It just launched this high yield savings product in Chile. All in all, MELI has 53.1 million fintech active users vs. 43.7 million Y/Y and 30 million wallet payers vs. 23.3 million Y/Y.
Credit/Lending:
As described last quarter, the company entered 2023 “cautiously optimistic that problems with Brazilian credit when first launching the card in 2021” were resolved. It wrapped up 2023 with “hard data to support that optimism.” It has extensive customer data profiles to know its base better than others can. It’s beginning to prove that it has the tech to effectively flex this advantage. Despite the acceptance rate boost following fine tuning its underwriting, delinquencies are stable and its newest cohorts are performing very well. In Mexico, where it debuted the card this year, credit performance is good early on. Overall TPV growth for this product bucket accelerated throughout the year as it got more aggressive in Brazil and enjoyed the Mexico launch. Its overall credit portfolio rose from $2.8 billion to $3.8 billion Y/Y while credit card users rose 95% Y/Y to 20 million. It continues to underwrite better than others and continues to be among the low cost providers as well. This is how its net interest margin after losses sits at a lofty 39.8% vs. 39.0% Y/Y.
“We are confident that our proprietary data will be a major competitive advantage as we build this product over the coming years… 2023 is a testament to our ecosystemic competitive advantage in distribution and underwriting, our cautious risk management and geographic diversification.” – Shareholder letter
Key credit metric trends:
15-90 day non-performing loan (NPL) rate was 8.2% vs. 7.6% Q/Q & 8.4% Y/Y. Lower is better.
90+ day NPL rate was 18.7% vs. 20.3% Q/Q & 29.6% Y/Y. The Y/Y fall was helped by shedding a large chunk of 270+ day non-performing loans.
Provision coverage (percent allowance for doubtful accounts / NPL rate) for 15+ day NPL loans rose from 102% to 107% Y/Y and from 131% to 153% for 90+ day NPL loans (helped by shedding 270+ day delinquent loans).
$3.63 billion in credit card receivables vs. $2.95 billion Y/Y.
$2.63 billion in loans receivable vs. $1.70 billion Y/Y.
Argentina:
Argentina has been plagued by hyper-inflation in recent quarters. That is greatly impacting economic activity and life there for its citizens. Under new leadership, the government has turned its deep, deep deficit into a surplus. It’s slashing regulation and promoting pro-business agendas. Regardless of what you think of this politically, it should be a strong positive for MELI’s growth and profitability in that country looking ahead.
Take:
This was a solid quarter. The EBIT miss isn’t ideal, but this firm doesn’t offer quarterly guidance and exists in markets that American analysts like myself don’t understand nearly as well as the U.S. I can’t call the misses (ex-charges) irrelevant, but I can call continued rapid compounding and margin expansion much more important. It keeps taking more market share; it keeps successfully launching products; it keeps making more money; it keeps pleasantly surprising me in its ability to effectively underwrite credit. It just keeps executing. I see what the stock price did after the report. If I were a shareholder, I’d be a lot more excited by the results than disappointed by the share price reaction.
b. Nu Holdings
Nu is a digital financial services giant in Brazil, with operations quickly expanding into Mexico and Colombia.
Demand:
NU beat revenue estimates by 2.5%.
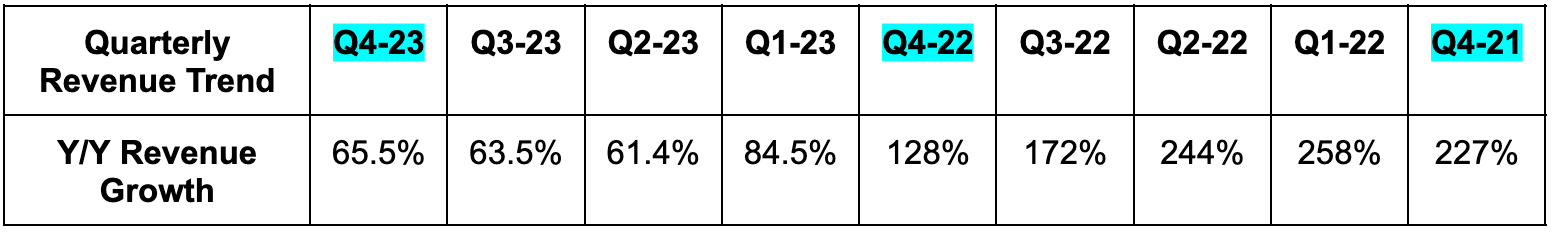
Its 94.2% 2-year revenue CAGR compares to 111% Q/Q & 136% 2 quarters ago.
Revenue rose by 57% Y/Y FXN.
Interest income & financial instrument revenue rose 69% Y/Y FXN to $1.95 billion.
Fee & commission income rose 21% Y/Y FXN to $454 million.
Revenue per active customer rose 23% Y/Y FXN to reach $10.60.

Profitability:
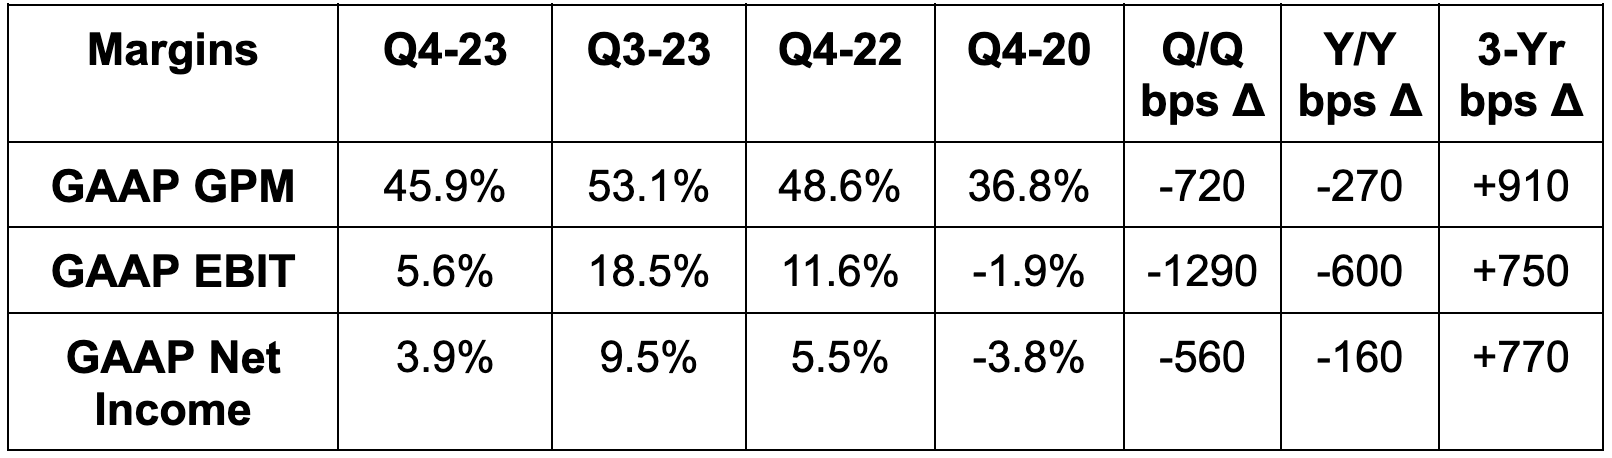
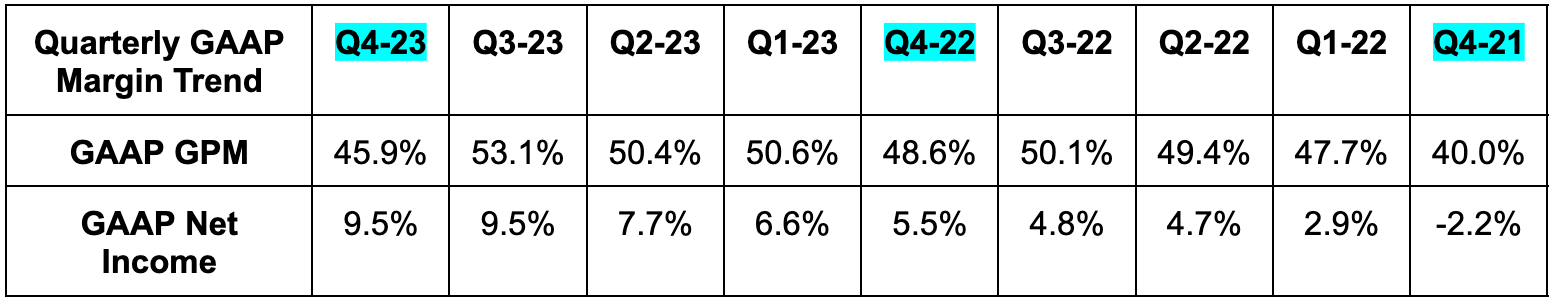
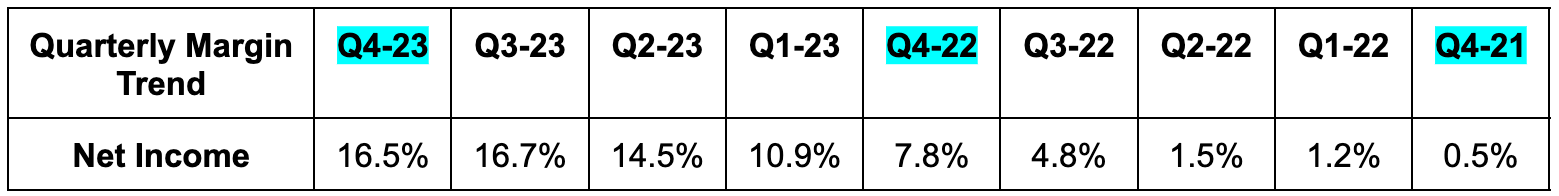
Beat 43.9% GAAP GPM estimates by 360 bps.
Missed net income estimates by 1.5%.

Balance Sheet:
$6 billion in cash & equivalents.
$1.14 billion in debt.
Diluted shares rose 3.9% Y/Y; basic shares rose 1.3% Y/Y.
Valuation:
NU trades for 24x expected 2024 EPS. EPS is expected to grow by 70% Y/Y.
Call & Release Highlights:
Growing like a weed:
NU now has 78 million monthly active customers, which rose 27% Y/Y. Importantly, rapid customer growth is coinciding with rising engagement rates, further feeding the growth engine. 83.1% of total customers are active vs. 81.9% Y/Y. Revenue per active user overall rose to $10.60 vs. $8.20 Y/Y. 61% of these active users also call NuBank their primary banking account (PBA), which directly props up customer lifetime value vs. non-PBA customers. Cost to serve borrowers remains stable and near industry lows of $0.90. That’s a key piece of NuBank’s competitive edge – merging more product cross-selling and a larger network effect with being the low cost provider of commoditized financial services.
Newer cohorts are consistently utilizing more & more products and are contributing more & more revenue. Specifically by product, credit card customers rose 21% Y/Y to nearly 41 million; investment customers rose 103% Y/Y to 15 million; NuAccounts (bank accounts) rose 31% Y/Y to nearly 69 million; unsecured personal lending customers rose 40% Y/Y to cross 7 million.
93.5% of its customers are Brazilian, where it calls 53% of that entire population its customer base vs. 51% Q/Q. It took the firm just 9 years to get there. In Mexico, it’s already adding customers at a 1 million per quarterly pace (+24% sequentially). It’s only been in that market for 3 years, yet already has 5.2 million customers.
Credit Trends & Health:
NU continues to shift its credit receivables portfolio to interest earning assets. Its interest earning portfolio (IEP) rose by 91% Y/Y FXN vs. 49% FXN growth for the overall receivables base. That outpacing growth led to IEP reaching 23% of the total asset base vs. 12% Y/Y. This is facilitating an explosion in net interest income, with “ample room for more balance sheet optimization ahead.” That optimization will directly support growth rates until it reaches capital ratio limits. But that likely won’t happen any time soon. NuBank’s Capital Adequacy Ratios (CARs) are about 2x the legal minimum. This doesn’t even consider that NuBank is owned by Nu Holdings, which has another $2.4 billion in excess cash to allocate if needed. There’s no balance sheet bottleneck here. Its loan-to-deposit ratio improved from 35% to 34% Q/Q as it accelerated deposit growth to 38% Y/Y FX.
Overall credit growth was strong with the portfolio rising to $18.2 billion vs. $11.3 billion Y/Y. This was powered by credit card and personal loan expansion across all markets. Notably in Brazil, increasing PIX adoption and traffic are creating a nice demand surge. PIX is the country’s real time payment system, which is used by 35% of Nu’s active Brazilian credit card customers. This accelerates velocity of money, modernizes the Brazilian monetary system and should be a tailwind for NU.
Notably, NuBank has been “expanding the risk profile for newer cohorts” as it becomes more confident in its underwriting models. This led to credit allowance expense doubling Y/Y, which was in line with expectations and is a concession the team is willing to make. Overall, metrics are still in great shape:
Credit loss allowance expense as a percent of the portfolio fell to 3.3% vs. 4.1% Q/Q & 3.7% Y/Y.
15-90 day NPL rate of 4.1% vs. 4.2% Q/Q & 3.7% Y/Y.
90+ day NPL rate of 6.1% vs. 6.1% Q/Q & 5.2% Y/Y.
Brazilian Regulatory Notes:
NU increased discounting intensity for debt repayment negotiations under Brazil’s sponsored program (called Desenrola). This, paired with more collection initiatives stemming from the regulation, was the source of NIM falling Q/Q. Without this hit, NIM was 19.2%. Importantly, risk-adjusted NIM, which accounts for this item, rose Q/Q from 9.0% to 10.2%.
Brazil also capped interchange rates on prepaid cards in April 2023. This was a headwind for its fee & commission revenue bucket.
Costs & Margins:
Nu’s cost of financial and transaction services fell from 60% of revenue to 52% of revenue Y/Y. It continues to find ample fixed cost leverage as revenues rapidly compound. OpEx overall rose by 24% Y/Y FXN (partially via the new debt collection program in Brazil) and fell from 31% of revenue to 24% Y/Y for the same reason.
As briefly alluded to, its cost to operate is becoming a real moat. Its customer acquisition cost of $7 and quarterly cost to serve of $0.90 pair very nicely with quarterly revenue per user of $10.60. This means its growth spend is basically immediately profitable. It also has an 85% lower cost to serve vs. incumbents and its cost of risk is 15% lower than average in Brazil. It’s easy to see these edges being emulated in Mexico and Colombia as it scales in those markets. It’s hard to differentiate in financial services outside of a higher savings yield or better product interfaces; this is how to durably differentiate. The margin explosion being seen is the result of this promising development.
Take:
If a company posting these results was domiciled in the U.S., it would be a no-brainer part of the portfolio. I’ve been very impressed by Nu’s results since I started following along. This quarter was more of the same and forces me to consider the investment case here. NU is at the top of my watchlist and I plan to spend the next few weeks researching Latin American economics. I need to learn more about that region before I’m comfortable enough to own anything there. Risks to this bull case are a lot different than for a CrowdStrike or a Disney. There are foreign exchange, political, geopolitical, sovereign inflation and other considerations. Regardless, this was a wonderful quarter chalked full of rapid compounding, more market share gains, expedient operating leverage and credit health durability. Congratulations to shareholders. There’s a NU sheriff in town.
Looking for a better investment platform? Enter BBAE. The product speaks for itself. The Town Square copy trading tool allows you to emulate Wall Street’s finest. Its curated stock themes (under BBAE Discover) inspire new ideas, and its valuable technical and fundamental research tools guide you through key concepts.
BBAE is the broker dedicated to giving investors what matters to us. No gimmicks, no charms, no confetti, and never any pressure to trade. This is THE broker for long-term investors. Oh… and it’s offering generous deposit bonuses of up to $400. Check it out here. You’ll be glad you did.
3. Block (SQ) – Earnings Review
a. Demand
Block beat revenue estimates by 1.1%. Its 21.6% 3-year revenue CAGR compares to 20.7% Q/Q & 42.2% 2 quarters ago. Gross payment volume (GPV) missed expectations by 2.4%.
Transaction-based revenue rose 8% Y/Y to $1.6 billion.
Subscription & Services revenue rose 24% Y/Y to $1.62 billion.


b. Profitability
Beat EBITDA estimate by 25.7% & beat guide by 27.7%.
Beat gross profit guide by 3%.
Missed $0.57 EPS estimate by $0.12.
Transaction based gross profit as a % of GPV was 1.13% vs. 1.12% Q/Q & 1.14% Y/Y.


c. Balance Sheet
$5.9 billion in cash & equivalents. $7.7 billion in total liquidity.
$4.1 billion in debt.
Diluted shares rose 6.2% Y/Y. Repurchased $157 million in stock during the period.
d. Guidance & Valuation
Q1 EBITDA guidance was 12.4% better than expected. It also raised its annual EBITDA guide by 9.6%, which also beat estimates by 9.6%. This was an “at least'' guide, meaning 9.6% is the minimum beat. It guided to 17% Y/Y gross profit growth as well. Finally, it raised its adjusted EBIT guide by 31.0%. This was also an “at least'' guide. It remains committed to reaching a revenue growth + EBIT margin level above 40 (rule of 40?) by 2026.
Block trades for 24x 2024 expected earnings. Earnings are expected to grow by 74% Y/Y.
e. Call & Letter Highlights
Getting Leaner:
Starting last quarter, Block embarked on a mission to streamline its cost base & get leaner. It capped its headcount at 12,000 and expects to stay under that level for not months, but years to come. It reorganized teams under clearer engineering, product, design and sales functions. It cut its real estate footprint, eliminated discretionary spending and saw operating expenses (ex-impairment and restructuring) rise by just 6% Y/Y. Sales & marketing spend fell Y/Y as well.
The other piece of this restructuring was accelerating the pace of engineering & design innovation. Square had been long known as a leader in those categories, but thinks it’s falling behind and “wants to lead here again.” Sounds a lot like PayPal, although Square’s lagging innovation issue isn’t nearly as pronounced. To re-establish leadership here, it brought Robert Andersen back to lead both Square and Cash App design. He was the first lead designer of both when the products had the reputation of being best-in-class.
Cash App the Bank:
Cash app is tweaking its path a bit in two areas. First, it will now pursue U.S. households earning up to $150,000 annually compared to $100,000 previously. It thinks its product suite can cater to a more affluent consumer than it had assumed in the past. A big part of that will be strengthening its peer-to-peer network to better cater to entire families (not just the parents).
Secondly, it will tighten and accelerate its focus to be its consumer base’s primary banking account (PBA). It will do so in several ways. It wants to build customer trust through improved safety, security and service with better fraud management and system reliability. Next, Cash App plans to round out its financial services suite to better emulate legacy banking. It has many of these products already (and a newly introduced 4.5% yield savings account) but will “close the product gap” in the future with wire transfers, check deposits and bill pay. It will also add subscription management, spending reports and credit building support. As an example of how impactful these launches can be, its separate debut of overdraft coverage immediately led to an acceleration in direct deposit growth.
Why does it want to be the bank? A few reasons. Just 2 million cash app monthly transacting actives have set up direct monthly paycheck deposits. Conversely, its cash app card has 23 million monthly transacting actives, representing 41% of its total base of 56 million. When its cash app card users start utilizing direct deposit, spending levels through Block 6x vs. non-users. This matters a lot, which is why Block is emphasizing monetization of current users over new user growth and geographic expansion. Its biggest and most profitable opportunity is within the customers it has already won.
Interestingly, Block added consumer onboarding friction this year to create more intentional user growth. This move also increased touchpoints for direct deposit cross-selling to accelerate its PBA path.
More Cash App Updates:
To create more actionably useful products, it also wants tighter integration of its Afterpay buy now, pay later (BNPL) product into Cash App. This will also allow Cash App to utilize the merchant base that Afterpay provides to facilitate more deal discovery, savings and unique value for its consumer app.
Cash App doesn’t just want to be your bank, it wants to be the next-gen social bank. This sounds a lot like emulating SoFi’s (AKA Social Finance’s) business model for non-ultra prime credit consumers. Afterpay and Square merchants going forward will get more profile customization to target local customers with relevant promotions. This again sounds eerily similar to what Venmo is currently trying to do. It should create a low acquisition cost channel of new customers for Block to provide incrementally unique merchant value. It should also make Block a bigger player in ecommerce. Cash App Pay (checkout accelerator) monthly active users are up 3x in just 6 months to offer signs of progress here.
Finally, Cash App Borrow funded $3.6 billion in short-term loans for 74% Y/Y growth. This coincided with just 13% Y/Y growth in transaction, loan and consumer receivables losses. Loss rates for Cash App Borrow are consistent with historical ranges and under 3%.
Cash App revenue of $3.91 billion rose by 31% Y/Y (20% Y/Y growth excluding Bitcoin revenue).
Cash App gross profit of $1.18 billion rose 25% Y/Y.
Cash App GPV actually fell 13% Y/Y.
Encouragingly, gross profit retention rates are positive for all annual cohorts. This means customers are sticking with Cash App and utilizing it more & more over time.
Cash App is enjoying a 600% return on investment over 3 years for its pre-2022 cohorts. Its 2022 and 2023 cohorts have an average payback period of less than 1 year.
Cash App inflows per user rose 8% Y/Y to $1,137.
Square:
Square’s pay as you go model is now live. This allows merchants to enjoy free hardware with slightly higher payment processing fees. That concession lowers upfront costs associated with starting a business. Its restaurant essentials bundle is also live. This combines its restaurant product, payroll and a few other tools for a flat fee. It expects this to accelerate traction in winning large restaurant chains. In other news, Square revamped its two referral programs to make incentives more compelling and more broadly available to existing customers. Finally, Square, like everyone else, launched an automated GenAI tool for automated customer support. This will cut OpEx for both Block supporting its merchants and those same merchants supporting their own customers.
Notably, it called out weaker consumer demand in the USA as slowing its merchant base’s growth.
Square revenue of $1.81 billion rose 12% Y/Y.
Square gross profit of $828 million rose 18% Y/Y.
Square GPV of $53.5 billion rose 10% Y/Y.
Encouragingly, gross profit retention rates are positive for all annual cohorts. This means customers are sticking with Square and utilizing it more & more over time.
Square is enjoying a 3x return on investment for its pre-2022 cohorts within 4 years. Its 2022 and 2023 cohorts have an average payback period of 6-7 quarters.
Loss rates for Square Loans and Square GPV were stable and consistent with historical ranges. Its BNPL losses were 1% of GMV, which is also stable.
f. Take
This was an excellent quarter. Jack Dorsey and Block are growing up. They’re focusing, streamlining cost bloat, accelerating product innovation and fixating on slowing the pace of dilution. Block is finally taking care of shareholders and these results mark the beginning of what I think will be an explosive profit inflection. Like Shopify, Meta and Uber in 2022 or Airbnb in 2021, there is so much low hanging cost cutting fruit to enjoy without impacting top line growth. This company is now determined to devour that fruit. Encouraging.
4. Earnings Roundup
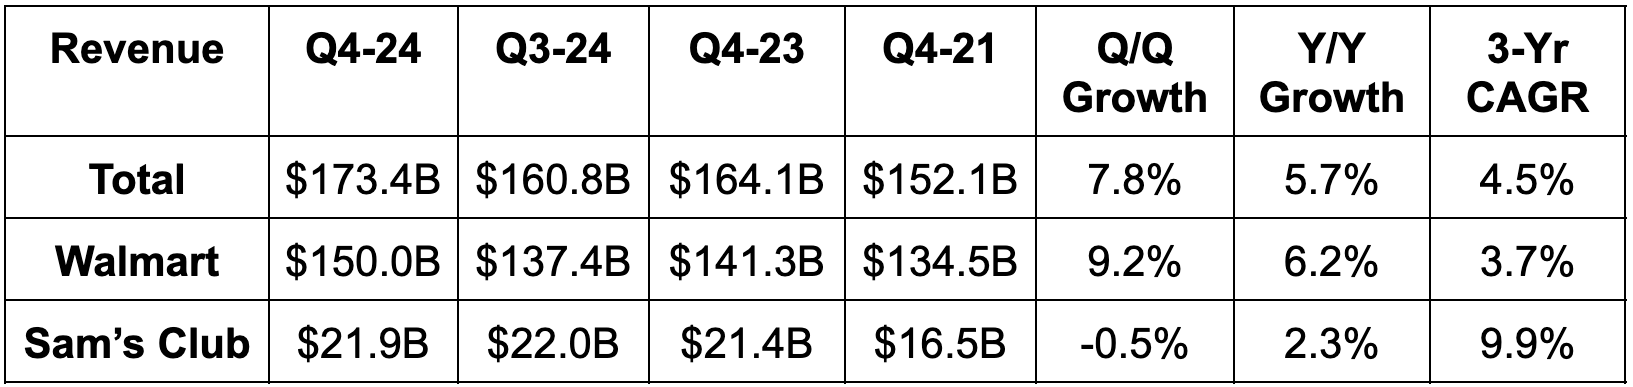
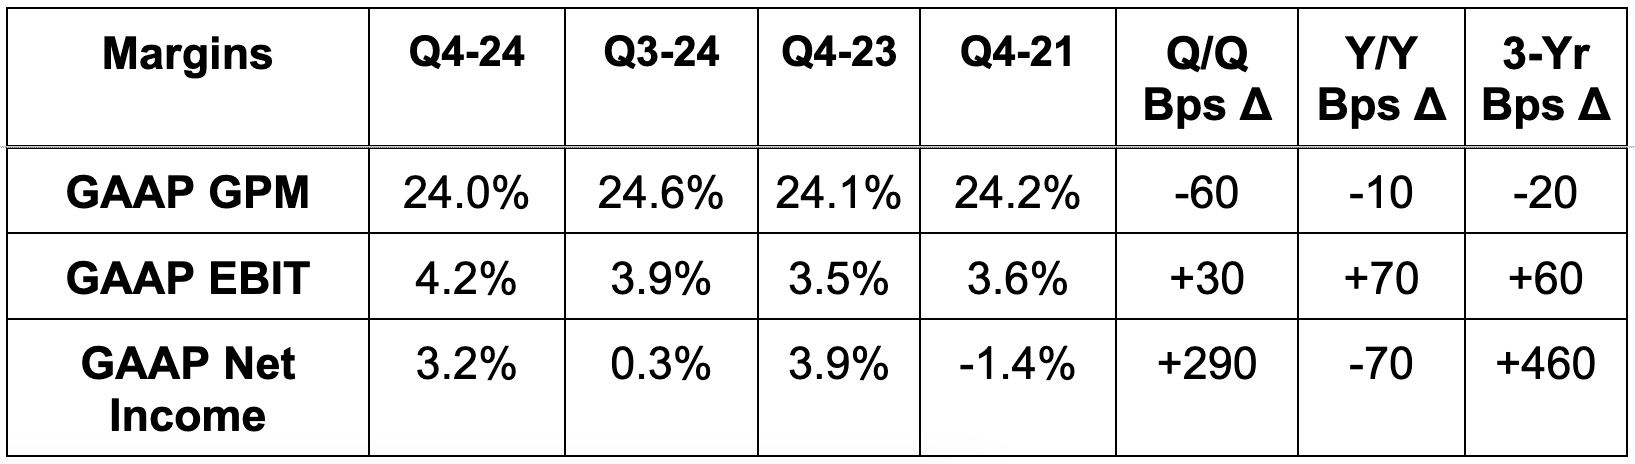
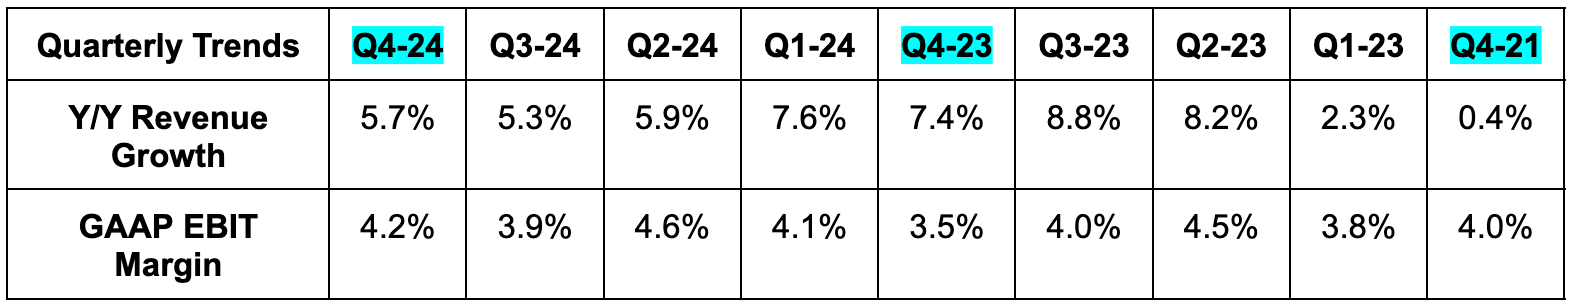
a. Walmart (WMT)
Results:
Beat revenue estimate by 1.5%.
eCommerce revenue rose 23% Y/Y.
Advertising revenue rose 33% Y/Y. Walmart Connect (its demand side platform run by The Trade Desk) enjoyed 22% Y/Y growth.
Beat EBIT estimate by 7%.
Beat 23.3% GPM estimate by 70 bps.
Beat $1.64 GAAP EPS estimate by $0.39.
6.6% trailing 12-month return on assets vs. 4.6% Y/Y.
Balance Sheet:
$9.9 billion in cash & equivalents. It will purchase Vizio for $2.3 billion to deepen its advertising presence.
$55 billion in inventory.
$46.9 billion in debt.
Share count fell slightly Y/Y.
Annual Guidance & Valuation:
Missed $7.08 EPS estimate by $0.17.
Guided to 3.5% FXN Y/Y revenue growth & 5% FXN Y/Y EBIT growth.
Walmart trades for 25x 2024 EPS. EPS is expected to grow by 6.2% Y/Y.
b. The Home Depot (HD)
Results:
Beat revenue estimate by 0.3%.
Met GAAP GPM estimate.
Met EBIT estimate.
Beat $2.78 GAAP EPS estimate by $0.04.


Balance Sheet:
$3.8 billion in cash & equivalents.
$21 billion in inventory.
$44 billion in debt.
Share count fell 2.4% Y/Y.
Annual Guidance & Valuation:
1% Y/Y revenue growth guide slightly missed 1.6% growth estimates.
14.1% EBIT margin guide slightly missed 14.2% margin estimates.
c. Intuit (INTU)
Results:
Met revenue guidance & met its revenue estimate.
Beat EBIT estimate by 12%.
Beat $2.31 EPS estimate by $0.32.
Doubled $0.63 GAAP EPS estimate.

Balance Sheet:
$1.5 billion in cash & equivalents.
$6 billion in debt.
Share count rose slightly Y/Y.
Annual Guidance Updates & Valuation:
Intuit reiterated every piece of its fiscal year 2024 guidance. Analysts were expecting small raises across the board.
Intuit trades for 38x next 12 month (NTM) earnings and 33x NTM FCF. This year, earnings are expected to grow by 5.0% with FCF expected to grow by -0.6%.
5. Progyny (PGNY) – Regulation
The Alabama Supreme Court ruled last week that embryos are considered children. This week, the news led to University Systems and other clinics like The Center for Reproductive Medicine pausing IVF treatments as they weighed the decision. There’s a lot of confusion about the legality of IVF treatments in that state and there will be appeals to this ruling. That confusion will resolve itself over time.
I’m not here to talk about politics. I will let you form your own opinion about the news. I’m here to discuss potential implications for Progyny and its fertility benefits business. A couple years ago, Dobbs. v. Jackson Women’s Health Organization overturned Roe vs. Wade. There were 13 states with “Trigger Laws'' that meant abortion became illegal following this decision. Abortion doesn’t directly restrict fertility treatment. Still, this news gives those 13 states more flexibility to define embryos used in IVF treatments as human beings. Non-viable and extra embryos are routinely discarded, which technically can be considered abortion and banned. Alabama’s ruling could easily lead to an IVF ban, which is a large piece of Progyny’s business.
This all sounds intimidating, but more context is needed. Of those 13 states with potential IVF bans, Texas is the only densely populated one. It has already mandated the legality of IVF treatments, so this is a non-issue there. The other 12 states represent 3% of total fertility treatment volume in the USA. Alabama makes up well under 0.5% of total USA volume. No other state in the group has made a similar ruling. Furthermore, the best clinics in the U.S. are concentrated on the coasts. Fertility tourism to pursue treatment from these best-in-class clinics is already common. When prospective parents from the southeast are traveling, they’re traveling to New York or California… not Alabama. So? From the maximum 3% volume hit, a large chunk will simply travel somewhere else for treatment. It’s hard to believe that passionate parents with deep employee benefits won’t spend $500 on a plane ticket to realize their family building goals.
All of this is to say that the potential maximum hit to this business is 3% of volume, the current maximum hit to this business is less than 0.5% of volume and the actual hit to this business will be immaterial. I chatted with my contacts at the company to confirm that this is the case.
6. PayPal (PYPL) — 2024 Guide
There was a lot of confusion stemming from PayPal’s 2024 EPS guidance of $5.10. The company will begin including stock compensation in non-GAAP EPS starting in 2024, but it was a bit unclear when that would start to impact its EPS. I finally heard back from the company. The $5.10 2024 EPS guide (which is identical to 2023) still includes the stock compensation charge. It will begin to exclude the charge starting in Q1 2024, which is when EPS will take a hit and apples-to-apples comps will be thrown off. This means EPS growth on an apples-to-apples basis will be 0% in 2024.
Why is PayPal making this change? They say it’s for better transparency and considering stock comp is a real part of their operations. I think there’s truth to this, but I also think there’s more to it. I think the new team plans to aggressively trim headcount over time and slow the pace of hiring. I think it sees a seamless path to greatly reducing the stock comp number. So? Why not include it in non-GAAP EPS at the start of your tenure to boost overall long term earnings growth even more.
7. Market Headlines
Meta’s Mark Zuckerberg made a rare trip to Korea this week to meet with Samsung’s chairman and President Yoon Suk Yeol. He hasn’t been to the country in over a decade, and this is leading many to assume there are new AI-related partnerships soon coming. We’ll see.
Meta and Microsoft have formally asked the European Commission to reject Apple’s new app store proposal discussed 2 weeks ago.
Uber Eats started autonomous food deliveries in Japan through a Mitsubishi partnership.
Super Micro announced and priced a $1.5 billion convertible notes offering. There’s no regular interest expense associated with the deal.
8. Macro
Employment & Housing Data:
Initial Jobless Claims were 201,000. This compares to 217,000 expected and 213,000 last report.
Existing Home Sales for January came in at 4 million. This compares to 3.96 million expected and 3.98 million last month.
Output Data:
Manufacturing Purchasing Managers Index (PMI) for February was 51.1. This compares to 50.5 expected and 50.7 last month.
The S&P Global Composite PMI for February was 51.4. This compares to 51.8 expected and 52 last month.
The Services PMI from February was 51.3. This compares to 52.4 expected and 52.5 last month.
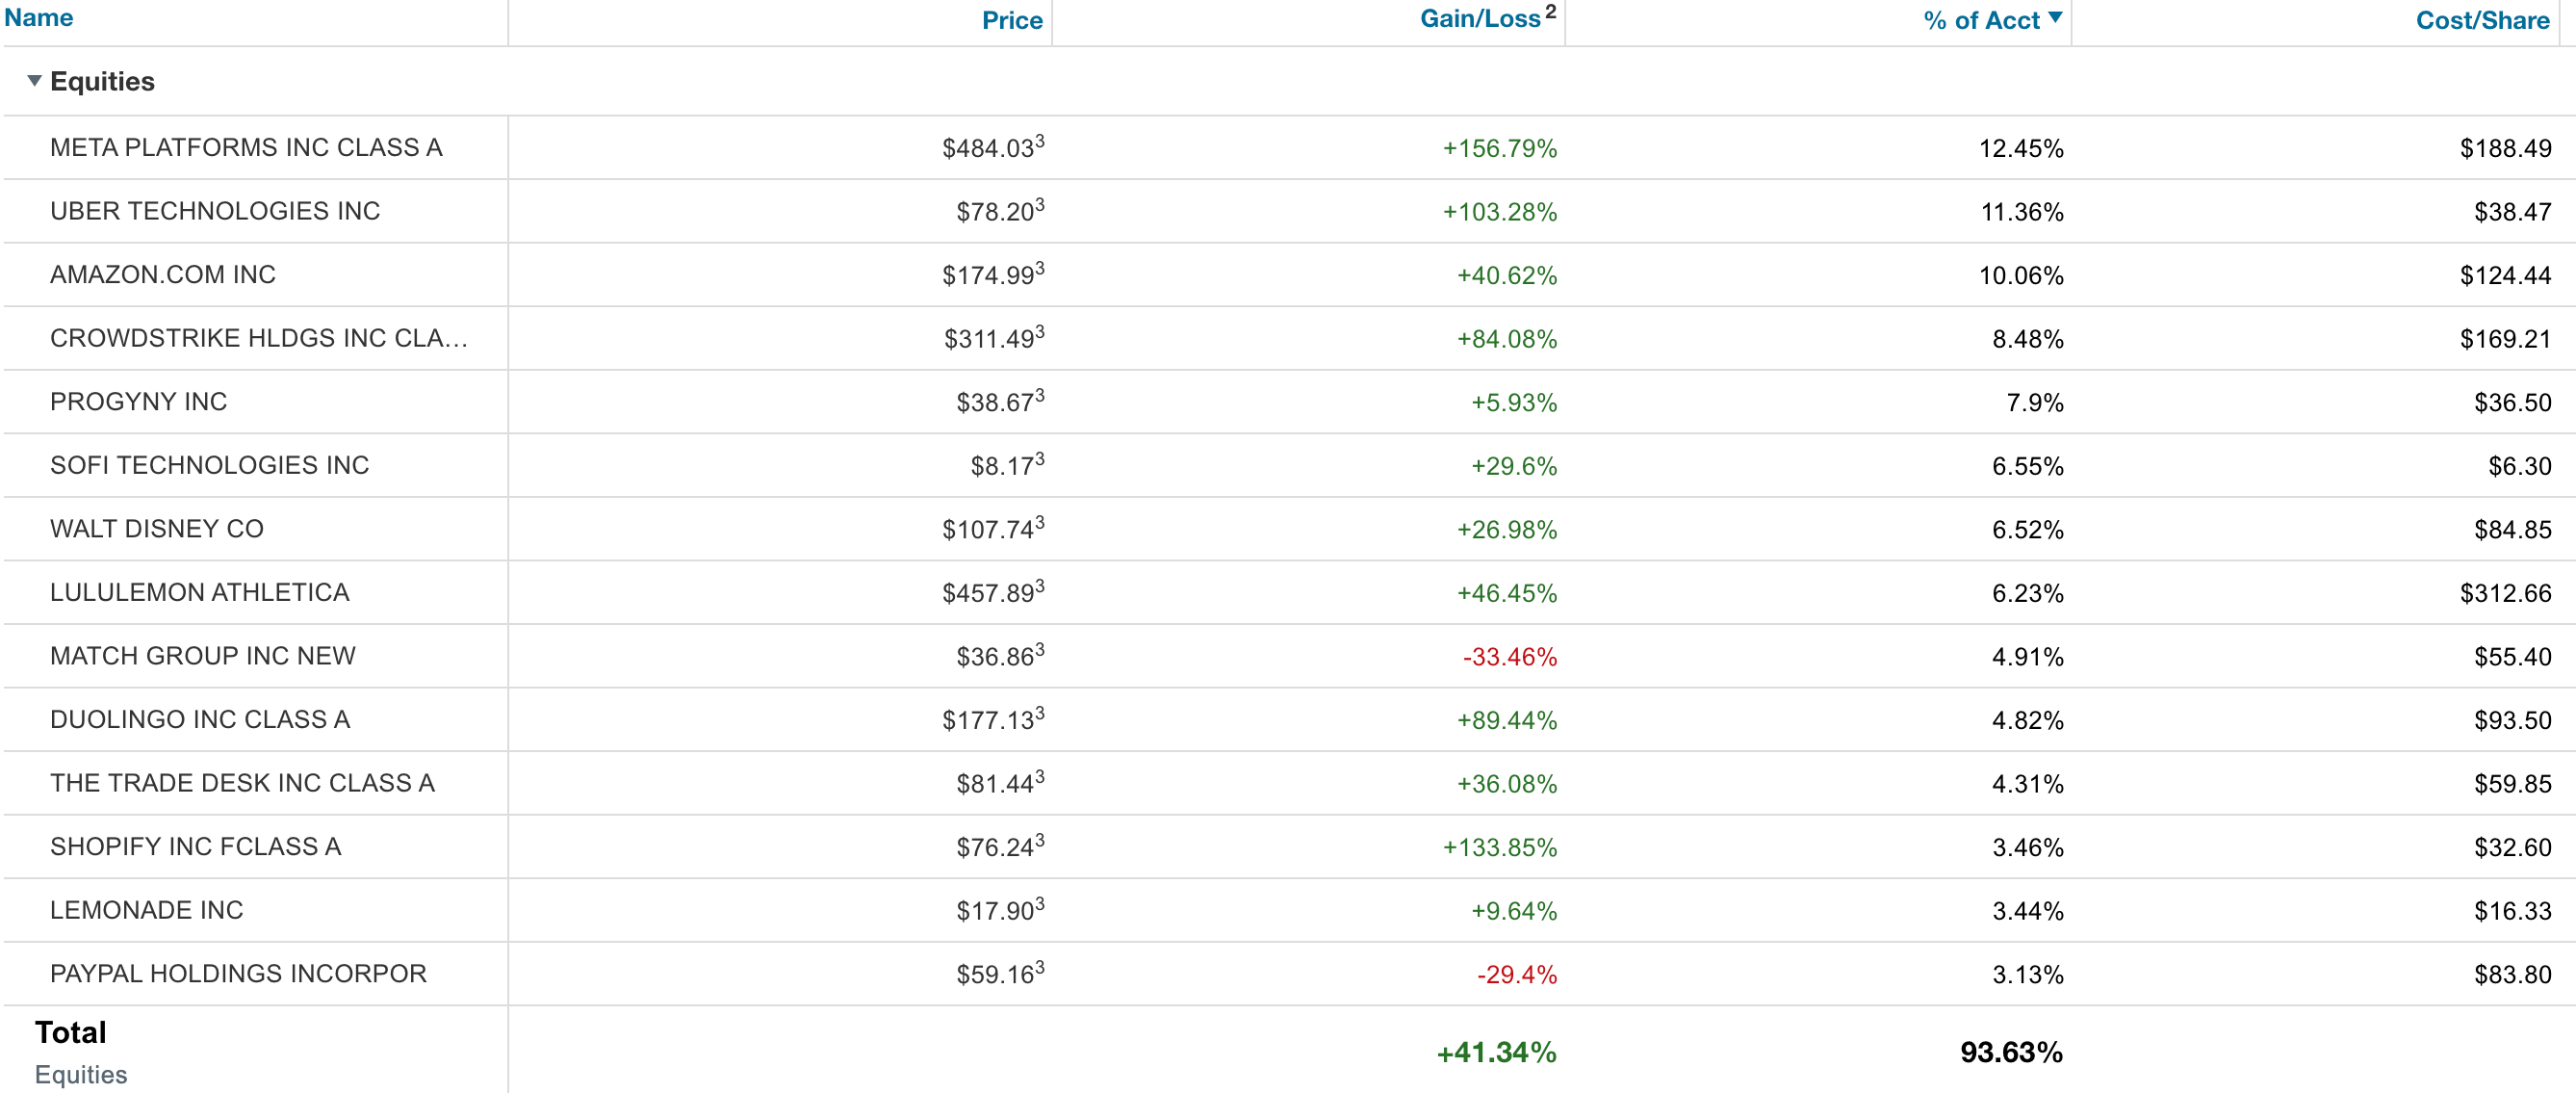
9. Portfolio
I made no transactions this week. I did deposit a chunk of funds into the account worth about 2.5% of total holdings.
I look forward to your great analyses every week, which cross many of my portfolio stocks. Thank you! You do an excellent job.
How do you see CRWD-ZS- S and PANW in direct comparison?
For my part, I have decided to allocate my investments in the cyb-sec area as follows:
65-15-10-10
A short note on MELI: An initial shortfall in net operating income probably came as a surprise to many investors and is probably part of the reason for the short fall in share price. Perhaps it would have been better if MELI had issued a statement a few weeks ago, if only for reasons of transparency.
Hard to read bad news from PALO (as I'm a shareholder) but hey as the CEO said during the Conference Call, we all want quarter to be linear. That's not the case this time. Hope the company will recover quickly.