

News of the Week (February 20 - 24)
News of the Week (February 20 - 24)
Uber; Shopify; Lemonade; PayPal; Meta Platforms; Revolve; Olo; Palo Alto Networks; Nvidia; Mercado Libre; Block; Walmart; Booking Holdings; Macro; My Activity

Welcome to the 328 new readers who joined us this week. We’re delighted to have you as subscribers & determined to provide as much value & objectivity as possible.
1. Uber (UBER) -- New Position
Whether it’s “to Venmo,” “to Instagram,” “to Google” or “to Airbnb” I love investing in verbs. That level of organic familiarity breeds a combination of seamless growth & brisk operating leverage. That tandem often paves the way for compelling shareholder returns. And along those lines, I’m ready to add another verb to the portfolio: To Uber. I added this transportation and ride sharing juggernaut to my portfolio this past week.
Impressive Operating Leverage:
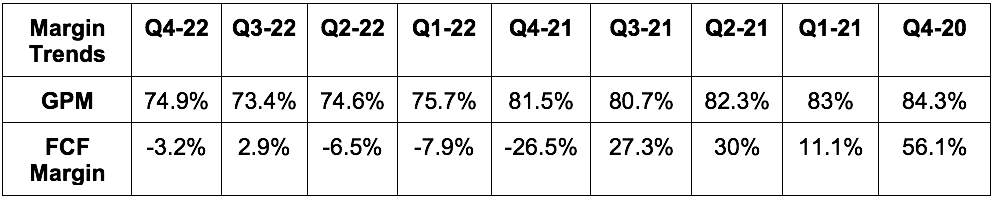
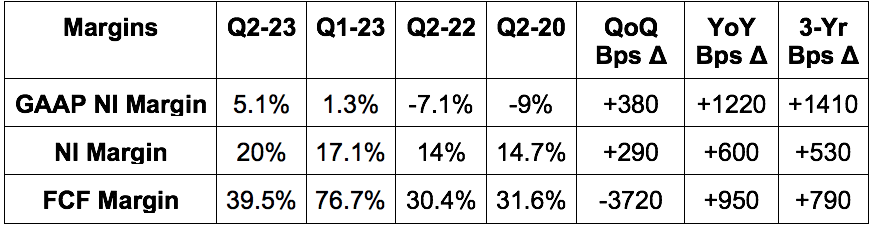
For the last two quarters, while countless large caps have seen material margin contraction and a halting of demand growth, Uber has not. Most recently, it improved YoY GAAP operating margin by 790 basis points to -1.6% with 2230 bps of improvement coming over the last 3 years. Over that time, its EBITDA margin has rocketed from -15% to 7.7%.
And for 2023, it guided to more margin expansion while expecting a positive inflection of its GAAP operating margin once and for all. Margins continue to expand far faster than anyone had hoped, and I do not believe analysts have finished adjusting estimates higher given all of the inefficiencies current leadership has been able to address. Where is all of this leverage coming from? A few places:
The company’s founder -- Travis Kalanick -- had a “buy revenue at all costs” leadership style. His company was born when VC dollars were flowing and he could easily fund losses with more and more capital raises. It was about revenue, market share and brand power. “Profit” did not enter the vocabulary. So Uber grew.
The company was able to effectively and rapidly scale with putrid margins and achieve a point where it enjoyed leading market share positions across several of its key markets. Uber rapidly gained brand ubiquity and facilitated transportation disruption, but it needed an operator to come in and run things more rationally. Enter former IAC CFO and Expedia CEO Dara Khosrowshahi.
Kalanick was fully out of the picture as of 2018. At that time, Dara embarked on a series of cost controls, investments in tech and automation and revamping of the organization structure to make Uber a leaner, healthier company. He ended speculative scooter and bike-sharing segments, vastly cut investments in autonomous freight and consolidated most of Uber’s core services into one umbrella. He ended Uber’s autonomous ride sharing R&D and restarted the program with a more reasonable approach through partnerships with Motional (Hyondai) and Nuro. He focused on the core business and making Uber the best place for drivers to invest their time.
These changes took years to unravel the ridiculous cost structure Uber had amassed. But now, with the investments finally taking hold, Dara thinks the company has “clearly separated itself from competitors on driver and consumer preference.” Considering that its U.S. market share set a 6 year high last quarter on higher margins, I’d have to agree.
Travis Gets a Little Credit Too:
Travis got them to a point of market control. Economies of scale are the key differentiator amid ride sharing. There’s nothing unique today about being able to call a car from your phone. What is unique is the luxury of being the biggest. This allows Uber to profitably afford driver incentives, lower ride rates and cut wait times to maintain a motivated driver fleet, happy customers and domination. Pricing competition will continue to intensify here as Lyft and local taxi services try to take back share. Leveraging its economies of scale is how Uber can stay the most profitable in the space while effectively competing for supply and demand.
While Uber is far from Amazon’s or Walmart’s scale, I think the comparison is still relevant:
It would take years and wildly deep pockets just to try to rival the footprint that those two retailers have built. And the low margin nature of the business makes this effort significantly less appealing. That lack of appeal serves as a sort of competitive moat for both companies. Similarly, Uber’s dominant and growing share of the ultra-low margin transportation business is the beginning of this same competitive advantage. Why not build another Amazon? Well… because the probability of success is quite low and the upfront costs unbearable. The same can be said for Uber.
Quantitative:
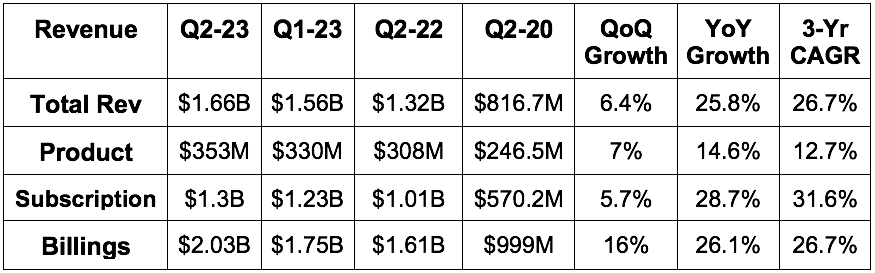
Despite all of the cost rationalization, FX and macro headwinds, Uber continues to find demand. Its gross bookings are growing at a 3-year compounded annual growth rate (CAGR) of 19.3% and revenue at a 3-year CAGR of 28.4%. That revenue compounding will slow, but should stay at or above 15% for the foreseeable future in my view.
Considering this, Uber is expected to compound earnings and cash flow (FCF) above 60% for the next 3 years. When pairing that with its 33X forward earnings multiple, there’s a lot to like about the investment at today’s price.
Assume that Uber’s revenues only compound at 12% for the next 3 years and profit only 40%. Under this scenario, that puts them at $1.88 in 2025 earnings or 17X 2025 earnings and a sub 0.5X price to earnings to growth (PEG) ratio. Just getting that PEG ratio up to a still cheap 0.8X would mean compounded returns of roughly 20%. Again, assuming a below market PEG ratio and disappointing growth.
Balance Sheet:
$4.3 billion in unrestricted cash, equivalents & short-term investments vs. $4.21B YoY. Another $4.1 billion in restricted cash & equivalents.
$4.4 billion in investments vs. $11.8 billion YoY.
$9.27B in long term debt.
Basic share count grew 3% YoY; diluted share count grew 2.7% YoY.
Stock comp was 5.6% of revenue in 2022 vs. 6.7% YoY. Free cash flow here is not getting much of a boost from stock comp compared to most growth companies.
Risks:
Macro likely will be a headwind for ride-sharing growth, but won’t halt it. U.S. Government data from 2008 shows ride-sharing continued to grow through that recession at a slower rate. This recession should be more mild. Furthermore, Uber leadership actually sees the turbulence being a net benefit to its business. Why? It goes back to how early Uber was on cost rationalization. Its margin structure and leverage trends are now far healthier than Lyft’s while the smaller competitor is now merely beginning to implement its own operational shifts to stay competitive. Uber, conversely, can keep its foot on the gas pedal thanks to how well leadership handled the last 3 years.
So what are the most pressing risks? There are three that I see. The first is Uber maintaining its dominant share lead over the long term as fleets shift from driver-operated to autonomous. Tesla, Google and many others will all try to compete here in some capacity and that is certainly more threatening than needing to beat Lyft. The Hyundai partnership is an encouraging sign that Uber understands the risk and is addressing it in a disciplined, asset-light, partner-first manner.
The second major risk is that previous legal battles on treating drivers as contractors vs. employees could resurface. The company has done a wonderful job appeasing regulators, but politicians are not always rational or consistent and could easily make things tougher on Uber’s model.
Finally, individual drivers are not predictable. It is vulnerable to the occasional bad actor creating unsafe conditions for riders and its brand is vulnerable to that reality too. Safety is paramount to success and massive scale makes it complicated to constantly implement.
What’s Next:
Uber continues to focus on making its drivers and riders happy. Their satisfaction is the very basis of Uber’s success. Recently, products like “Upfront Fares” have boosted completed trip rates in the U.S. by 4% with unfulfilled trip rates in the U.K. falling by 23%. This means happier drivers wasting less time and earning more money. This also means less sticker shock for consumers. Small product tweaks like these will continue to be a priority
While Dara did end several speculative product expansions in 2018, Uber has since restarted that drive in a much slower, fiscally responsible way. New mobility products like car rentals and pre-bookings grew over 100% YoY and now represent 10% of its total mobility bookings as of last quarter. Its newer advertising business is also on track to reach $1 billion in high margin revenue by 2024. This implies 100% growth expected in 2023.
But perhaps the most exciting evolution of Uber’s business model is the growing contribution from its subscription business -- Uber One. Membership here grew 100% YoY last quarter to reach 12 million with those members accounting for 25% of ALL Uber bookings. Subscription revenue is innately higher quality than solely usage based due to the enhanced visibility and lower marketing spend to keep customers retained.
Specifically, members get an average of $27 in savings per month while churning 15% less frequently and 4Xing the lifetime value contribution to Uber. By securing more consistent utilization via its subscription perks, Uber becomes more efficient and more valuable to its members (and drivers).
I’m confident that all ride-share and delivery businesses will eventually embrace this approach as well. It’s the only way to ensure sufficient retention amid a sea of intense competition. Importantly however, I think Uber is the best positioned to thrive due to the product diversification in its model. This is not just a delivery company like DoorDash, not just a car rental firm like Enterprise and not just a ride sharing firm like Lyft. It’s all of the above. This added cross-selling opportunity without added marketing expenses will mean Uber can pass on more utility-building savings to its subscribers than can stand-alone companies with just 1 or 2 products. It can extract more lifetime value (LTV) with less customer acquisition cost (CAC).
Plan:
I’m comfortable making this a core holding. I started by investing 2.5% of my overall funds into the name this past week. I plan to hopefully allocate another 2.5%-3.5% over time depending on how Uber’s valuation and execution trends.
Uber News from the Week:
Uber signed a new agreement with Tata Motors in India to add 25,000 new electric vehicles to its fleet in that important market. Deliveries to Uber’s 1st & 3rd party fleet network will begin this month.
2. Shopify (SHOP) -- Partner Program Upgrade
Shopify is embarking on a new, multi-year project to enhance the appeal of its already thriving partner program. Considering these partners provide niche, yet key use cases to round out Shopify’s offering, and considering they serve as a strong channel of new business referrals -- keeping them happy is paramount. The program will be rolled out in phases and will focus on “exceptional rewards, skills building and a simplified, engaging partner experience.” It will double the referral revenue share incentives and take a more hands-on approach to closing those referrals through direct selling. Win, win.
Shopify will also debut its first skills certification program. This will allow partners to stand out with graduation badges while they try to attract new business to Shopify and to stay proficient amid its rapid pace of innovation. This is an extension of its system integrator (SI) program and agreement with EY to partner and train 500 of their workers on Shopify’s product suite.
It continues to focus on becoming a more lucrative partner to work with and an easier vendor for merchant on-boarding.
3. Lemonade (LMND) -- Q4 2022 Earnings Review:
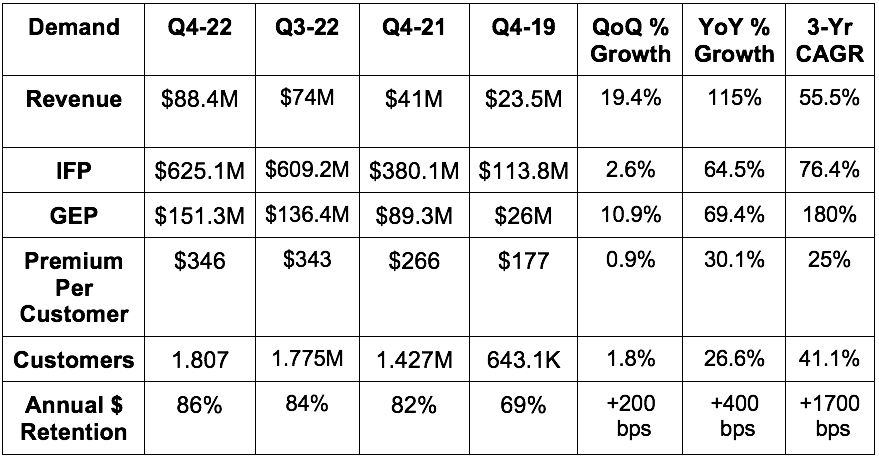
a. Demand
Beat In Force Premium (IFP) guidance by 1.9%.
Beat Gross Earned Premium (GEP) guidance by 1.9%.
Beat revenue guidance by 12.6%.
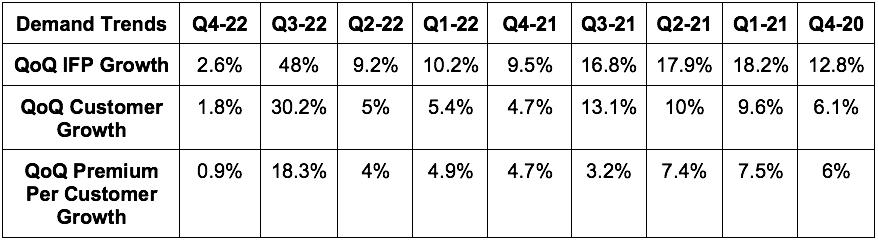
More Demand Context:
Reduced ceded premium proportion from 72% to 58% YoY. This aided revenue growth as ceded premiums can’t be recognized as revenue. Growth (including inorganic) would have been 70% without this bump.
IFP growth ex-Metromile acquisition was 38%.
Metromile is the source of the premium per customer growth.
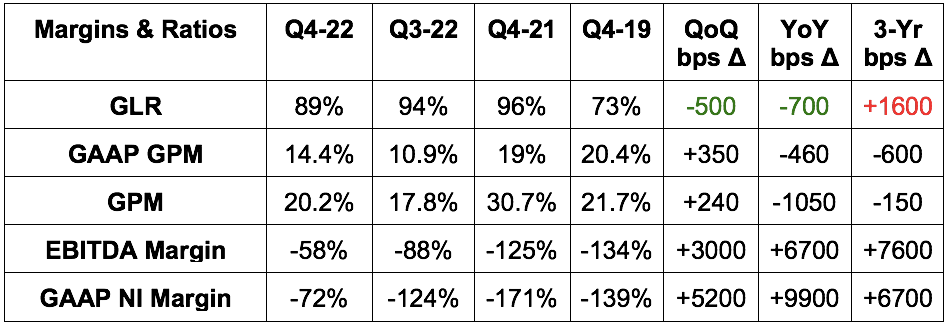
b. Profitability
Beat EBITDA estimates by 17.3% & beat its loss guide by 18.6%. This marks the continuation of sequential dollar loss improvements as management promised.
Beat GAAP EBIT estimates by 15.3%.
Beat $1.21 loss per share estimates by $0.28.
More Margin Context:
Operating expenses ex-loss adjustment expense rose 12.4% YoY. This was due to Metromile M&A. OpEx would have fallen 5.3% YoY without this inorganic impact.
Sales & marketing expenses fell $10 million YoY as it prioritizes leverage over growth.
Outperforming marketing efficiency helped facilitate the large EBITDA beat.
Growth marketing as a percent of sales & marketing cost fell from 70% to 55% YoY as it pulls back on pursuit of new business.
c. Balance Sheet
Lemonade has $1.04 billion in cash & equivalents on the balance sheet. That gives it 4+ years of cash runway at the current burn rate. It has no debt.
Stock comp was 17.7% of sales vs. 32.6% YoY. Great progress here.
Continues to selectively hire at a slower pace than previous years. Headcount grew 22% YoY but was flat ex-Metromile M&A.
d. 2023 Guidance
Lemonade guided to 47.2% YoY 2023 revenue growth (including inorganic) or $377 million. This missed estimates by 2.4% which actually is not what bothered me about guidance. Lemonade told us that they’re letting unprofitable plans roll-off while waiting for rate change requests to be approved to make that business rational to pursue. They’re also limiting new originations until these updates take effect. That’s the growth headwind for now and why it only expects 11.5% 2023 IFP growth vs. the 20-25% long term target it offered a few months ago. No issues on this miss from me. They’re just waiting.
EBITDA missed by 2.3% for an average quarterly loss of $60.6 million and -$242.5 million total for 2023. That represents a quarterly loss average about 20% larger than Q4 2022. Leadership told us Q3 2022 losses would be the peak “and improve thereafter.” This is “thereafter” and losses are not continuing to improve. Maybe it’s a victim of how well EBITDA losses came in for Q4 2022, but I still found this to be underwhelming. It’s still technically within that peak loss range, but it’s dangerously close to eclipsing it and the pace of loss reductions throughout 2023 will be gradual at best.
Furthermore, if it’s pulling back on growth spend until rate changes take effect, I think that should coincide with better EBITDA progress considering sales & marketing is its largest expense bucket. Even with Metromile, this should be the case considering we were told Metromile OpEx would replace much of the Lemonade auto OpEx it had already planned pre-purchase. Perhaps I’m being unfair to the team, but I expected better. Maybe it’s just sandbagging.
“As always, we’ve set our guidance in a way that we believe we can achieve… The guide reflects conservatism.” -- CFO Tim Bixby
e. Shareholder Letter
On Loss Ratios:
Most Lemonade rate change approvals have not yet come. As they do, loss ratios are expected to continue improving.
This is especially hitting profits in their pet policies which it’s pulling back on the most sharply for now.
Winter Storm Elliott added about 400 bps to its loss ratios during the quarter. Its Net Promoter Score (NPS) on these storm claims was a robust +71 -- consistent with the rest of its business and well ahead of competition.
All product loss ratios improved QoQ & YoY.
On Annual Dollar Retention (ADR):
ADR improved to 86% from 82% YoY.
In Illinois -- where it has had all products live for at least a year -- it saw 95% ADR vs. 87% YoY as a sign of continued product introduction boosting ADR.
CEO Daniel Schreiber on Upcoming Reinsurance Contract Renewals:
“Reinsurance prices have become tighter. Our need for reinsurance has declined as the business has grown and diversified. When we signed our agreements 3 years ago, we were a mono-line business really in 1 country. We've now got 5 lines, 4 that we're underwriting, and we're in 4 countries. So that kind of diversification helps a great deal. So we are looking at a series of options in front of us given the cost of reinsurance… Hopefully, by this time next quarter, we'll have greater clarity.”
f. My Take
While some think I’m being unfairly hard on Lemonade, I still view its EBITDA guide for 2023 as bad for the reasons explained in the guidance section.
The inconsistent and slow EBITDA loss progress makes my previously assumed path to profitability (breaking positive some time in calendar 2025) now too optimistic. Thanks to the sheer size of Lemonade’s cash position, this is not a deal-breaker. Still, it is a yellow flag and merits consideration in the same ultra-speculative light that I view Nanox and Upstart. As such, it doesn’t deserve more than 1% of my investment funds at this time. So? I trimmed about half of the position on Thursday and I have no plans to trim further unless the situation deteriorates further. I also have no plans to add until there is meaningful improvement in the financials. I hope to resume adding when or if that happens.
4. PayPal Holdings (PYPL) -- Venture Investment
PayPal and Galaxy Digital together spearheaded a $20 million fundraising round for a company called Chaos Labs. This company focuses on automating crypto security and lengthens a string of crypto-based venture investments PayPal has made in the last couple years.
5. Meta Platforms (META) -- Meta Verified & Miscellaneous
a) Meta Verified
Last weekend, Mark Zuckerberg took to Facebook to announce a new product called “Meta Verified”. This is essentially Twitter Blue’s verification subscription service on Meta’s apps. The tool will offer account verification and direct customer support along with broader placement amid search, comment and recommendation algorithms. It will cost $14.99 on iOS and $11.99 on the web which mimics Twitter’s pricing strategy as a move to blunt the impact of Apple’s hefty app store take rate. In terms of use cases, I think it’s easy to see how verification could aid entrepreneurs on its shops and marketplace products and raise buyer confidence and conversion. I also think Instagram influencers will go gaga over this superficial status symbol.
I love this move. Assuming just 0.2% of Facebook monthly active users convert (half of what Bank of America expects) this could generate about $1 billion in what will surely be extremely high margin revenue. Assuming a 70% EBIT margin on the revenue, which I don’t see as overly aggressive, it equates to 2.2% of the company’s overall 2023 EBIT. Not a massive boost, but still sizable with pessimistic assumptions. Every billion helps.
b) Other News
Tencent and Meta are working on a partnership to sell Oculus hardware in China. Maybe this is why Tencent ended its own VR hardware investments.
Meta will conduct another round of layoffs this year to control costs.
BlackRock launched a Metaverse ETF.
The FTC will allow Meta to purchase “Within Media” (VR fitness studio) for $400 million. Quick! Get it closed before they change their minds.
Meta debuted a new language machine learning algorithm (called Large Language Model Meta AI or “LLaMA”) to augment professional research.
Sean Avery on Twitter published some encouraging data showing Facebook saw 12% hours engaged growth in January 2023 with Instagram at 8% YoY growth and TikTok flat YoY. Instagram outperformed TikTok on a month over month growth basis while Facebook performed in-line.
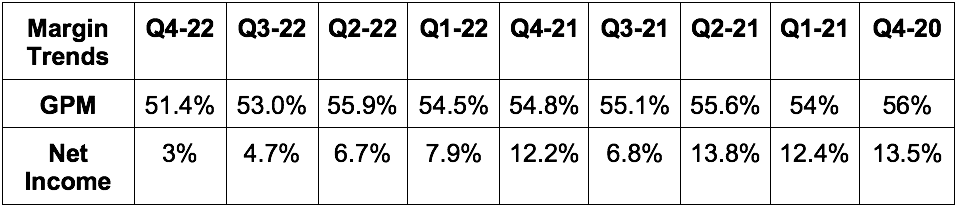
6. Revolve Group (RVLV) -- Q4 2022 Earnings Review
“While the macro-environment has become more challenging in recent quarters, we have moved quickly and made progress in balancing our inventory investments while continuing to deliver profitable growth that truly stands out within our sector. With our technology and data-driven culture, financial discipline, operational excellence and innovative team, we believe we are well positioned to continue to take market share." -- Co-CEO/Co-Founder Mike Karanikolas
a. Demand
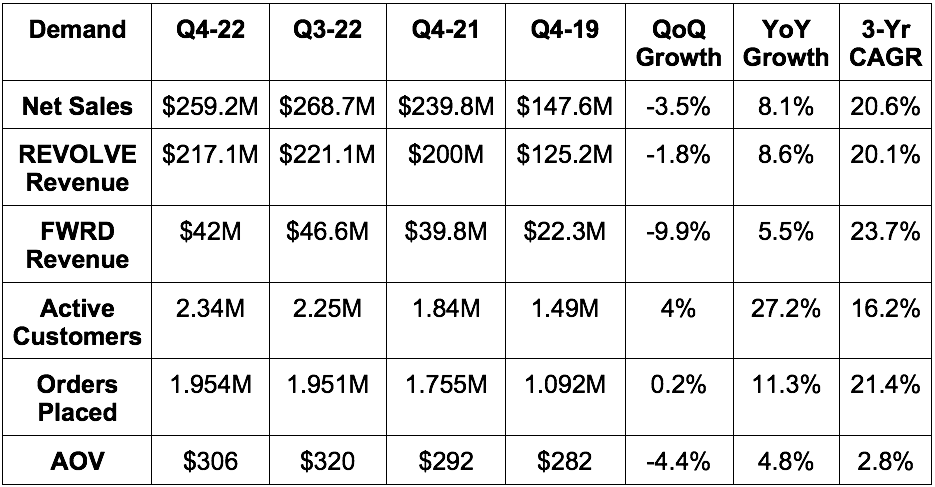
Revolve comfortably beat revenue estimates by 7.8%.
More Demand Context:
Added 90,000 customers vs. 80,000 QoQ.
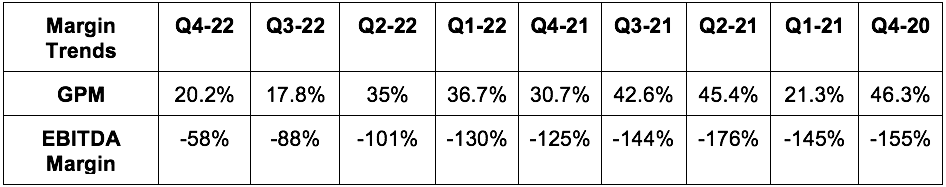
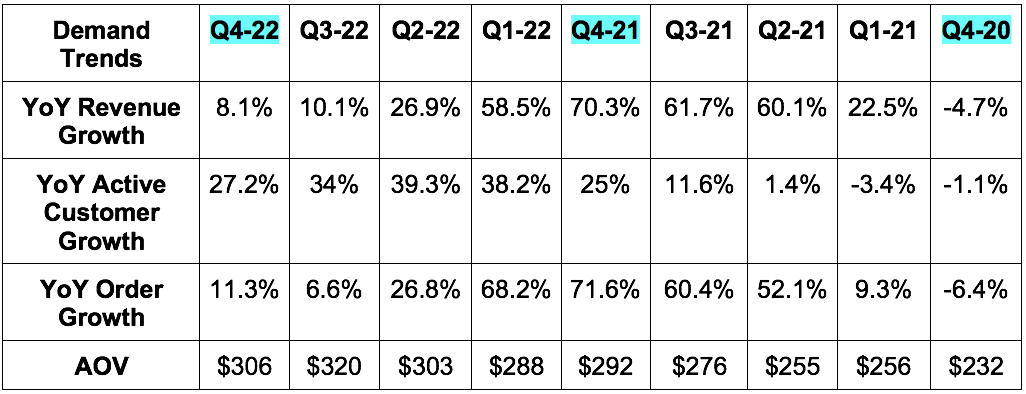
Revolve’s bread & butter is “going out” attire and live event marketing. So? The pandemic was a large headwind to its business. That’s why Q4 2020 revenue growth was negative. That’s also why this 20% compounder grew sales by 70.3% in Q4 2021 as those headwinds abated. That made this quarter arguably its toughest YoY comp quarter ever.
Revenue rose 24% YoY in 2023 as a whole.
b. Profitability
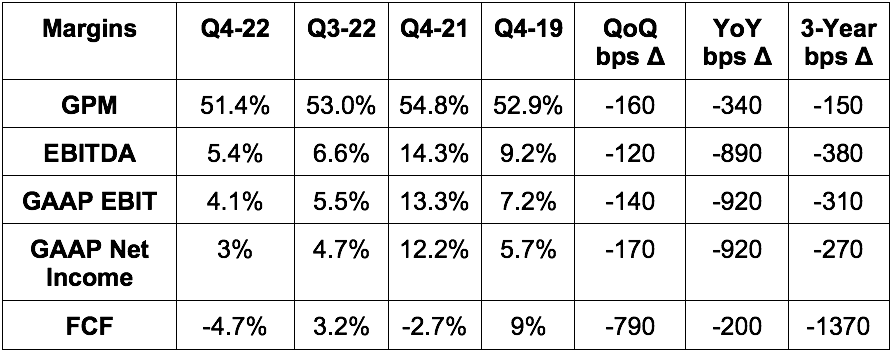
Missed gross margin estimates by 130 bps and missed its guide by 140 bps.
Beat adjusted EBITDA estimates by 17.5%.
Beat GAAP EBIT estimates by 12.1%.
Beat $0.10 GAAP earnings per share (EPS) estimates by $0.01.
Sharply missed FCF estimates of $26.9 million by $39.2 million.
More Margin Context:
Gross margin contracted YoY because markdowns rose as it works through excess inventory. Its % of sales at full price remains above pre-pandemic levels but fell from a record of 87% in 2021 to 85% in 2022 (79% in 2019). Rising YoY return rates as dresses normalize as a percent of its sales also hits GPM.
Gross margin for 2022 was 53.8% vs. 55% in 2021.
FCF miss via inventory build (counts as cash burn) and a 23% tax rate vs. 5% YoY.
2022 net income fell 40% YoY. This is due to:
Aforementioned gross margin headwinds
The company over-earning in 2021 and normalizing marketing, fulfillment and other operating expenses.
Fuel surcharges that rose 70% vs. the YoY period.
Paying out $18 million in 2022 taxes vs. $4.8 million YoY. Normalizing for that tax difference would have meant -28% YoY growth.
“We have very few adjustments to our adjusted EBITDA versus a lot of companies out there.” -- Co-Founder/Co-CEO Michael Mente
c) Balance Sheet
$234.7 million in cash & equivalents.
$0 debt.
Stock comp was under 1% of sales as it continues to be extremely kind to shareholders here. Considering the founders own 45% of the company, this makes sense.
Inventory rose 26% YoY to $215.2 million and rose 1% QoQ. It “believes it is making good progress here to adjust to the dynamic demand environment.” Leadership told us it will have inventory fully rebalanced and normalized by the end of Q2. It also told us that inventory was $195 million as of the end of January as it continues to make good progress here.
d) Guidance
Revolve didn’t offer any concrete guidance. It did, however, tell us that quarter to date sales growth was in the mid-single digit range YoY. This is far better than the -2.3% YoY growth analysts were expecting for the full quarter. It did tell us that this growth could slow further in March, but this was still much better than the quarter to date consensus. Great news.
Other rough guidance outlines:
“Significantly higher 2023 free cash flow” vs. 2022 as the inventory build reverts.
Accelerating revenue growth throughout the year.
Average order value growth to slow to 2%-5% YoY.
Gross margin to bottom in Q1 2023 at 49.5% and be 52.5% for the full year 2023.
“New customer growth remains healthy YoY.” -- Co-Founder/Co-CEO Michael Mente
“Our team is exploring ways to leverage our technology to be even more efficient in 2023 and beyond. If these efforts prove successful, we could drive greater efficiency in our cost structure and implied by our outlook. To highlight one example: We are exploring a multi-million dollar opportunity to reduce shipping costs by consolidating returns from larger international regions. In some cases, we can hold international returns in-country and fulfill orders from them locally without returning the items to the U.S.” -- CFO Jesse Timermanns
e) Call & Release Highlights
On Outperformance:
“Results continue to outperform industry peers and our most relevant benchmarks -- further extending our market share gains… Our growth, profitability and strong balance sheet allow us to continue to prudently invest in long term growth while others are forced to play defense.” -- Co-Founder/Co-CEO Michael Mente
Leadership credited this outperformance in both profit and growth amid next-gen e-commerce vendors to its “core competitive advantages.” In its view, these include its vertically integrated tech stack, data driven inventory systems and operational excellence. While that’s very abstract, share gains aren’t.
Going Global:
Revolve prices in US$ so foreign exchange makes its goods more expensive for international customers. Especially in Europe, this hurt demand in the quarter. Strength in Canada and other emerging markets offset this weakness to deliver 1% YoY international revenue growth vs. 9% growth in the U.S.
Launched a new store in India through a Nykaa Fashion Marketplace partnership for localized returns and free shipping in the country.
China is a key international market and the end of the pandemic lock downs could be a nice tailwind there in 2023.
Revolve is exploring launching small fulfillment centers in important international geographies to improve delivery times and lower cost to fulfill.
On Margin Tailwinds & Lean Operations:
January marked the beginning of order shipping from its new East Coast fulfillment center. This is expected to cut overall transportation costs and shrink delivery windows.
“Revenue per employee generation is more than twice the average amount of fashion e-commerce peers in the U.S. by our calculation… Our annual net sales per employee has increased by more than 30% in just the past 3 years.” -- Co-Founder/Co-CEO Michael Mente
On Customer Satisfaction:
Net revenue retention was above pre-pandemic records for the 2nd straight year at 97%. This is excellent for a retailer with 0% recurring revenue.
Net Promoter Score set a new record for Revolve in 2022.
On 2023 priorities:
Expand into more categories to eventually be the “first choice for every category type.”
Localize shopping and returns in more markets with more local payment methods and translated sites/apps.
Loyalty program cross-selling.
It hired a new lead for its beauty business and its men’s business.
Revolve is not yet ready to lean back into its own brand growth. That’s its easiest way to control inventory while keeping a broad product assortment available, so it will likely lean back in only when inventory has normalized.
f) My Take
While the margin contraction is not ideal, it’s as expected and maybe even a bit better. It was great to hear that gross margins will bottom this quarter and how much stronger Q1-2023 demand has been so far vs. expectations. This company continues to be an extremely well-run e-commerce vendor with profitable, consistent growth amid a sea of cash burners. Another fine result.
7. Olo (OLO) -- Q4 2022 Earnings Review
a) Demand
Beat revenue estimates by 2.5% and beat its guidance by 2.7%.
Beat sequential active location additions guidance of 2,000 by roughly 1,000 or 50%. This includes the impact of the continued Subway migration.
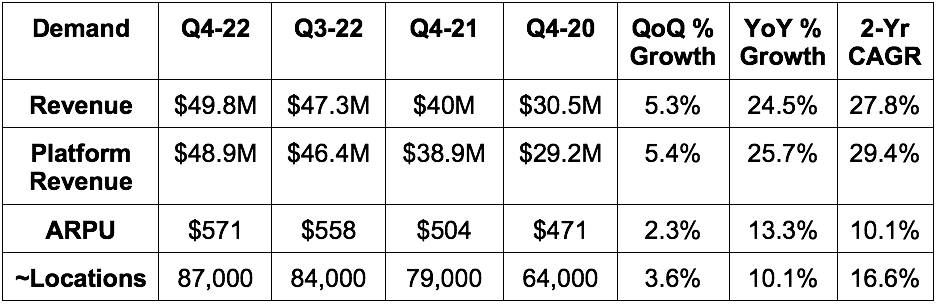
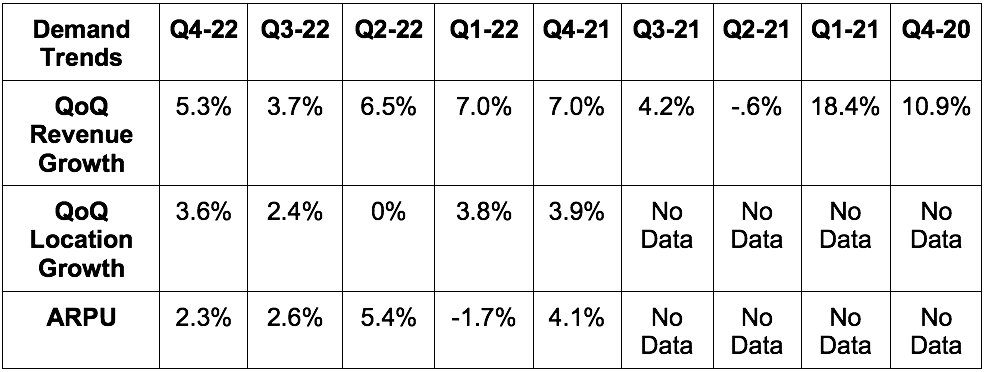
More Demand Context:
Average modules per Olo customer rose above 3X in 2022 vs. 2.7X in 2021.
ARPU is and will continue to be the main driver of growth. It sees a 25X ARPU opportunity just within existing locations.
Net revenue retention was 108% vs. 107% last quarter & 106% 2 quarters ago. This is still being hurt by poor macro and also Subway’s migration from Olo’s Rails module. Net revenue retention was consistently over 120% before 2022. I want to see it get back there.
GMV rose 15% YoY in 2022 to reach $23 billion vs. $20 billion in 2021.
b) Profitability
Beat EBIT estimates and its identical guidance by 10.7%.
Beat $0.02 EPS estimates by $0.01.
Met -$0.05 GAAP EPS estimates.
Missed $150,000 FCF estimates by $1.75 million.
Beat GPM estimates by about 70 bps.
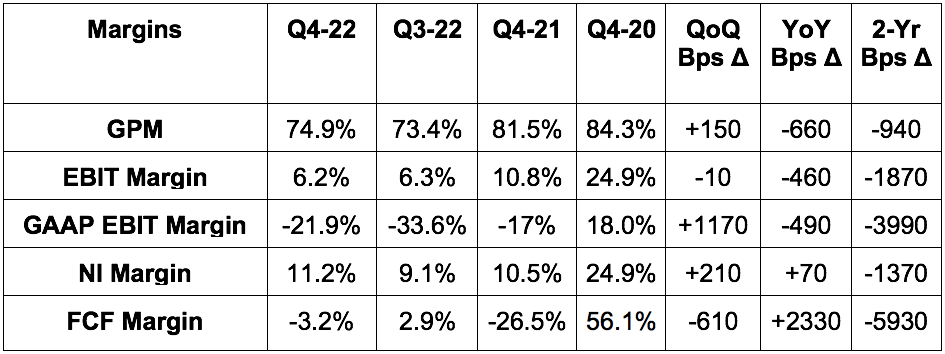
More Margin Context:
Wisely and Omnivore acquisitions and the coinciding Olo investments to fortify and integrate those products continue to hit margins.
Olo Pay is a long-term gross margin headwind and an EBIT and net income margin headwind for now. It is NOT a long-term EBIT or net income margin headwind once at sufficient scale. This is because operating expenses here are lower than with other products. Very similar idea to Shopify’s merchant solutions revenue bucket.
Leverage is coming from general and administrative (G&A). Sales & marketing (S&M) deleverage is more than offsetting that benefit for now as it goes to market with all of its new products.
c) Guidance
Q1 2023:
Missed revenue estimates by 0.3%.
Missed EBIT estimates by 67%. I think this was related to its “Beyond4” live event happening in Q1 this year which adds about $1.5 million to sales & marketing expense. It would’ve missed estimates by 12.5% without this.
2023:
Beat revenue estimates by 0.1%. Its revenue guide implies roughly 16% YoY growth with that expected to accelerate throughout the year and into 2024.
Missed EBIT estimates by 1.2%.
Olo Pay revenue to be around $16 million.
6,000 locations adds for the year for 7% YoY growth.
Guided to EBIT margin expansion for 2023 as a whole vs. 2022.
This implies growth from its original core subscription product suite of around 8%. That growth does not include usage-based revenue from products like Olo Pay or marketing modules which is why Olo is guiding to 16% revenue growth for 2022. It told us that its philosophy around guidance is “more cautious” than in the past. It’s assuming just ⅓ of 2023 sales comes from new business with the other ⅔ coming from signed contracts already being deployed. Normally it assumes a more even split, but did not want to count heavily on new business amid hectic macro. To me, this seemed like sandbagging considering leadership also told us sales cycle elongation was already improving. But we’ve been told guidance was cautious several times before with results coming in as expected.
d) Balance Sheet
$451.2 million in cash & equivalents.
Bought back $20.1 million in stock and paid out $11 million in stock compensation for net buy backs of $9.1 million. It has $79.9 million left on the current buyback plan.
e) Call & Release Highlights
Wins from the Quarter:
Added Bloomin’ Brands’ virtual brand called Tender Shack and its 800 locations. This win was for Olo’s Rails module which enabled Tender Shack to integrate with all major delivery service providers vs. the singular vendor it had been working with.
This also includes a LankyBox Kitchen integration to add virtual dining service at 450 Chuck E. Cheese locations.
Landed Captain D’s with 4 modules including Olo Pay. This is the largest Olo Pay physical brand customer win to date.
More on Olo Pay:
TGI Fridays (an existing client) added the Pay module for its 300+ locations. So far, this has delivered a 5% authorization rate boost and 1% fraud rate advantage for the chain.
Virtual Dining Concepts (Mr. Beast Burger parent) added Olo Pay across its 3,000 virtual locations and 2,000 physical locations.
Pay generated $6 million in 2022 revenue. Olo originally assumed it would do a couple million in revenue.
Pay processed $250 million in volume during its first partial year of availability.
Existing clients including BRAVO, Buca di Beppo and TJ’s Gourmet Deli also added Olo Pay.
“There are some restaurant brands that have long-term contracts that are in place with existing legacy payment processors that say, I'm really excited about Olo Pay and all these things that you're able to share about how others are getting value from it. I can't move off of this contract until x date.” -- Founder/CEO Noah Glass
Grocery:
Olo expanded into the Grocery Store segment this past quarter with a key customer win in Kroger. Kroger is now using Rails and Olo’s tablet-software called Olo Expo for nationwide sushi and flower deliveries. This segment adds another 30,000 possible locations to its addressable market while opening up flower use-cases as another perishable-goods market to seek growth. And furthermore, this represents seamless use case expansion by using existing modules to enter new categories rather than more expensive new builds to do so.
2023 Spend:
Continue building out the engagement and payments product suites. It will continue to invest in product development AND effective go-to-market to ensure all of its new products get the traction they need.
Stock comp will continue falling as % of revenue BUT, we’re still cycling through IPO stock grants from when the company had a 6X valuation to what it is today. That impact will “take time to normalize while new stock comp reflects the current valuation.”
“Our investment plan this year takes into account the rising cost of capital in the macro environment, which is reflected in the OpEx leverage we expect to gain in 2023” -- CFO Peter Benevides
f) My Take
This quarter reminded me of Shopify’s. There were no negative surprises, but simply in-line execution amid a sea of headwinds. The grocery development is exciting to me and Olo Pay’s outperforming proliferation is as well.
While the 2023 guide in my view is certainly good enough, I’d like to see growth re-accelerate back to 20% over time which is what management hinted at. With a large chunk of product expansion investment behind it, bottoming margins paired with accelerating growth would be a nice setup as we head into 2024. And it’s what I expect.
Fine quarter given the backdrop. Click here for my Olo Deep Dive.
8. Palo Alto Networks (PANW) -- FY 2023 Earnings Snapshot
Palo Alto is a key bellwether to gauge the health and resilience of endpoint and network security -- just like Fortinet was. And just like Fortinet, Palo Alto delivered robust results and upbeat forward commentary. Both have set the performance bar very high for CrowdStrike’s upcoming earnings (as well as Zscaler and SentinelOne) and I do not believe the firm will be able to get away with citing macro weakness for missing expectations. It needs to deliver just like Palo Alto and Fortinet did -- and I think it will.
a) Results vs. Expectations
Beat revenue estimates & guide by 0.3%.
Beat billings guide by 3%.
Beat $0.77 EPS estimates & its guide by $0.28.
Beat -$0.01 GAAP EPS estimates by $0.26 (aided by “other income”).
Beat FCF estimates by 80%.
Missed GPM estimates by 220 bps.
b) Fiscal Year 2023 Guidance Updates
Raised FY 2023 billings guidance by 1.3%
Reiterated its revenue guide of $6.88B at the midpoint which was essentially in line with estimates (0.1% miss).
Raised next-gen security Annual Recurring Revenue (NGS ARR) by 3.7%.
Raised its EBIT margin guide from 19.75% to 21.75%. This implies EBIT guidance that is 10% ahead of estimates.
Raised previous $3.40 EPS guidance by $.60 & beat estimates by $.57.
Raised adjusted FCF margin guide from 35% to 37%.
Supply chain improvements to continue throughout the year and serve as a gross margin tailwind.
Headcount growth to be slower this year than the previous 3.
Leadership added that this guidance “relies on current demand sustaining and being maintained.” This sounded like it may have taken a bit of a more optimistic approach to guidance than others in the space. In a world where under-promise, over-deliver matters dearly, they might have made it tougher on themselves than need be for the rest of the year. We’ll see.
c) Balance Sheet Highlights
Bought back $250M in stock & paid out $298 million in stock comp.
Stock comp 17.9% of sales vs. 21.5% YoY.
$1.35B in cash & equivalents.
$3.7 billion in senior convertible notes; no debt.
d) Call & Release Highlights
More Results Context:
26.7% 3-yr revenue CAGR vs. 26.4% last Q & 24.3% 2 Qs ago.
$1 million deals signed rose 20% YoY; $10 million deals signed rose 140% YoY.
NGS ARR rose 63% YoY to $2.33 billion.
Operating income rose 55% YoY; free cash flow rose 55% YoY as well.
Virtual machine (VM) firewall appliances market share leader with 3X the share of the second largest vendor.
Macro & Outlook:
Leadership acknowledged a fragile macro environment and sees it continuing for the time being. Still, it also expressed confidence in its ability to overcome these headwinds due to the resilient nature of cyber security, recovering industry hardware growth and its product suite. Cyber security is simply not a discretionary spend bucket that can be cut to shore up profitability. Palo Alto’s ability to consolidate vendors and lower total cost of security maintenance becomes more valuable to customers as times get tough. This is why large deals continue to be signed and why its success is so impressive.
It credited its selling teams with taking a more hands-on approach to new client on-boarding. This helped the company see zero large deals slip into future quarters with deal cadence stable YoY.
9. Nvidia (NVDA) -- FY Q4 2023 Earnings
a) Results vs. Expectations
Beat revenue estimate by .5% & beat its guide by .8%.
Beat GPM estimate by 20 bps & beat its guide by 10 bps.
Beat EBIT estimate & guide by 2.0%.
Beat $.80 EPS estimate by $.08.
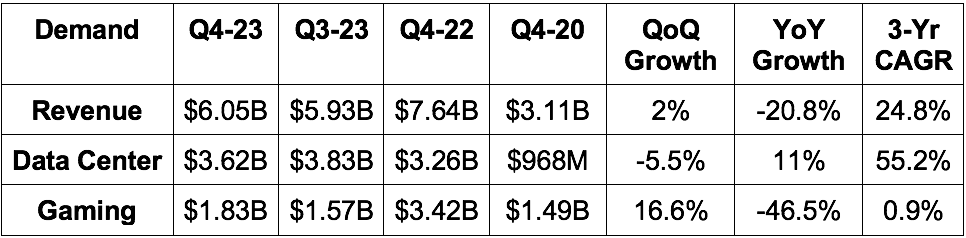

b) Forward Full Year Guidance
Beat revenue estimate by 2.8%.
Beat EBIT estimate by 2.2%.
Missed GPM estimate by 80 bps.
c) Balance Sheet
Stock comp was 12.2% of sales vs. 12.6% QoQ & 7.2% YoY. This is somewhat elevated, but not concerning when considering buybacks were quadruple the size of stock comp in calendar 2023.
Inventory rose 16% QoQ & 98% YoY to greatly outpace demand. It’s dealing with the bull-whip effect aftermath just like much of its competition.
$10.44 billion in cash & equivalents.
$11 billion in total debt with $1.25 billion current (due in the next 12 months).
d) Call & Release Highlights
As the forward guide would indicate, Nvidia seems to be weathering the macro storm better than much of its competition. It cited superior products as the reason. A bit subjective, but the results and 2024 expectations are anything but subjective. Specifically, ChatGPT and neural network proliferation lean heavily on chip sets that Nvidia builds. So? The rapid traction enjoyed by ChatGPT has already been a material driver for its business.
“The activity around the AI infrastructure that we build has just gone through the roof in the last 60 days. And so there's no question that whatever our views are of this year have been fairly, dramatically changed as a result of the last 60, 90 days.” -- CEO/Co-Founder Jensen Huang
10. Mercado Libre (MELI) -- Q4 Earnings Snapshot
Mercado Libre offers us a great sense of Latin America’s economic health.
a) Results vs. Expectations
Beat revenue estimate by 1.3%.
Beat GAAP EBIT estimate by 73%.
Beat $2.49 earnings per share estimate by $0.76.
Beat GAAP GPM estimate by 310 bps.
Mercado Libre does not offer forward guidance.
b) Balance Sheet
Mercado Credito’s overall portfolio (credit cards + loans) sits at $3 billion today vs. about $1.2 billion YoY.
$5.6B in cash, equivalents & investments ($1.45B is restricted).
$4.7B in loans payable including $2.1B current.
c) Call & Release Highlights
Leadership talked up its ability to overcome countless macro headwinds and ramping competition to deliver these results.
Credit Business:
Credit revenue +88% YoY.
Credit card receivables rose 60.2% YoY. Loans receivable roughly tripled YoY.
Interest margin after losses (IMAL) for the credit business was 48.3% vs. 37.1% QoQ and 32.1% YoY.
Bad debt as a % of revenue here was 38% vs. 54% YoY as this business continues to scale and mature.
90 day non-performing loan rate fell QoQ to 10.3% from 13.1% and was flat YoY.
Commerce & Logistics:
Unique buyers rose 8.2% QoQ and 13% YoY to 46 million.
Orders per buyer of 7.0 rose 4.4% QoQ and fell 1.4% YoY.
The commerce business took share in every market. It thinks the free shipping program it offers is helping a ton here along with buyer protection, its loyalty program investments and more product offerings.
67% of its GMV is coming from “organic, non-paid traffic.”
Managed Network Penetration (% of population that logistics network can serve) reached 94% vs. 89% YoY.
76% of orders were delivered in 2 days or less.
Same day delivery rate of 51% vs. 59% YoY due to supply chain issues.
Payments:
Fintech Users of 43.7 million rose 5% QoQ & 26.7% YoY.
Engagement per user increased “across all use cases and in all key markets.”
Overall Results Context:
FX hit revenue growth by 1500 bps or a full 15%. The 41% YoY growth is despite this. I found that impressive. FX hit TPV growth by a whopping 3100 bps.
64.5% 3-yr revenue CAGR vs. 64.7% last Q and 68.2% 2 Qs ago. Remarkably stable even as comps become more difficult.
Operating leverage was credited to a growing mix of high margin ad revenue and strong credit performance along with some spend discipline around acquisition marketing.
Click here to compare these results to Shopify’s Q4.
I also posted a side-by-side comparison of Meli’s report to Alibaba’s from this week along with a couple of other reports. Alibaba specifically is an important gauge into the health of the Chinese consumer and supply chains -- factors that countless companies across the globe rely on for their own growth and success. Click here to view.
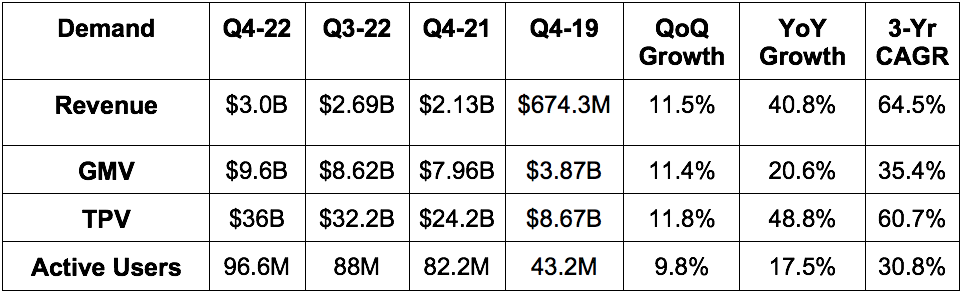
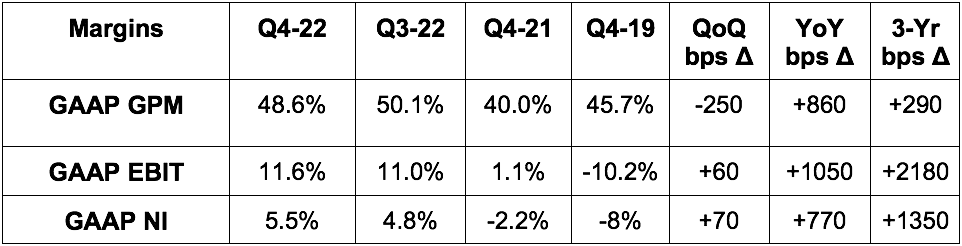
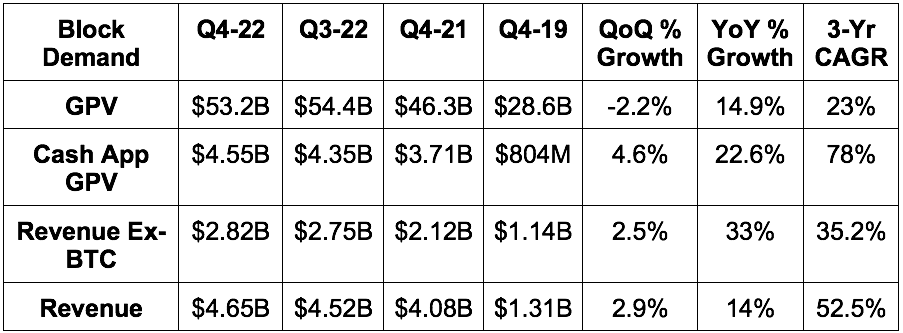
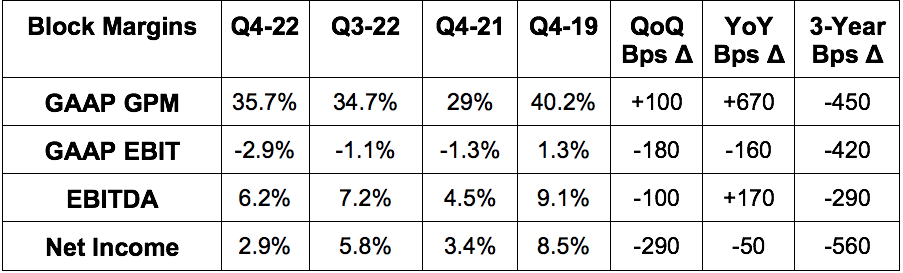
11. Block (SQ) -- Q4 2022 Earnings Snapshot
Direct PayPal and SoFi competition and a view into the health of crypto, small merchant resilience and financial service demand.
a) Results vs. Expectations
Beat revenue estimate by 1.3%.
Beat EBITDA estimate by 24%; Missed GAAP EBIT estimate by 6.6%.
Missed $0.30 EPS estimate by $0.08; slightly Beat GAAP EPS estimate.
Missed GPM estimate by 20 bps.
b) Forward Guidance
Block offered 2023 EBITDA guidance of $1.3 billion that exactly met estimates.
c) Balance Sheet
Stock comp was about 6% of 2022 sales (10.2% ex-BTC) vs. 6.4% YoY. Really not bad.
$6.9B in cash, equivalents, restricted cash & debt security investments.
$600 million in available credit capacity; $389 million in available warehouse capacity.
$4.6B in debt with $460 million in current debt.
d) Call & Release Highlights
This was a strong quarter for Block. The margin expansion could be a bit more consistent, but it called out growing core and new product traction, rising engagement and bolstered monetization as key momentum drivers. It didn’t seem to think these drivers would end in 2023 despite its slightly less-affluent niche being a bit more prone to macro weakness than others.
Results Context:
2022 Square revenue of $6.7 billion rose 29% YoY while $3 billion in gross profit rose 30% YoY.
2022 Cash App revenue of $10.6 billion fell 14% YoY because of less Bitcoin dollar sales which it recognizes on a gross basis rather than netting out. Gross profit rose 43% YoY to $2.95 billion.
Block generated $175 million in 2022 operating cash flow vs. $847 million YoY.
Cross-Selling & Moving Up-Market:
44% of 2022 Square gross profit from 4+ product clients vs. 29% in 2019. Means better retention, margins and higher LTV.
Mid-market (GPV of $500,000 to $10 million per year) sellers are its fastest growing merchant cohort as it tries to move upmarket. Mid-market sellers as a % of square GPV rose to 39% vs. 37% YoY & 30% Q4 2020.
Cash App:
Cash App MAUs rose 16% YoY to 51 million with customer acquisition cost (CAC) stable at $10 or less.
Cash App Card gross profit now 26% of cash app’s total gross profit. These users bring 2X the inflows of other peer to peer users.
Inflows per active rose slightly YoY.
Rolled out a new savings product last month to “set and track financial goals.”
Final Notes:
International gross profit is now 17% of total vs. 9% YoY. It more than doubled YoY in Q4 to $139M
Ad affiliate offering where it’s paid for sourcing Afterpay business for merchants did $100 million in 2022 revenue.
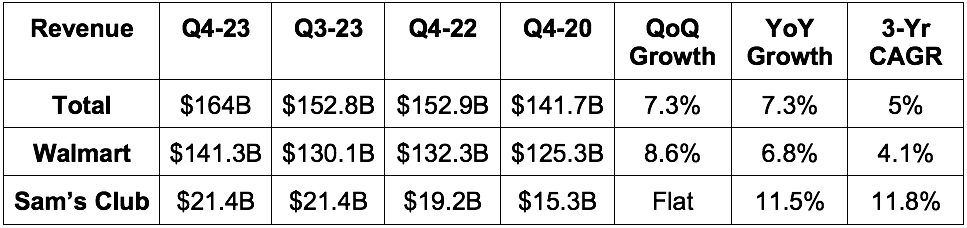
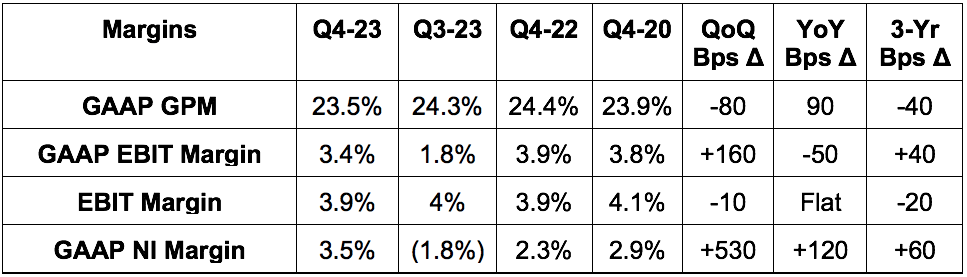
12. Walmart (WMT) -- FY Q4 2023 Earnings Snapshot
Walmart is a bit of a counter-recession indicator. Its outperformance happens amid poor macro when consumers generally trade down. The shift to non-discretionary spend that typically coincides doesn’t hurt the company as its grocery and other necessary good segments thrive.
a) Results vs. Expectations
Beat revenue estimates by 3.4% & beat its guide by 4.1%.
Missed GAAP EBIT guide by 5.7%.
Beat non-GAAP EBIT estimates by 5%.
Beat $1.51 EPS estimates by $0.20.
b) FY 2024 Guidance
Guidance was given on a constant currency basis. No formal FX headwind was offered. Accordingly, assuming a 100-300 basis point FX headwind for the upcoming year, both revenue & EBIT were roughly in-line. If that range proves to be inaccurate, its results will differ.
c) Balance Sheet Highlights
Bought back $9.9 billion this past year vs. $9.8 billion in FY 2022.
$8.9 billion in cash and equivalents vs. $14.8 billion YoY. This was almost entirely invested in more property & equipment.
$56.6 billion in inventory which was flat YoY.
$35 billion in total debt.
d) Call & Release Highlights
Results Context:
Trailing 12-month return on assets of 4.6% vs. 5.6% YoY. Trailing 12-month return on investment (using EBIT as the numerator) was 12.7% vs. 14.9% YoY.
Q3 2023 EBIT excludes $3.3 billion in opioid legal settlement charges. This cost is captured in GAAP EBIT and GAAP net income.
Full year FCF margin improved from 1.9% in calendar 2021 to 2.0% in calendar 2022. This is still below the 4.6% margin it posted in calendar 2020.
E-commerce is now 13% of its total revenue vs. 13% YoY & 6% 2 years ago.
Guidance & Macro:
Like Home Depot, Walmart called out a clearly weakening consumer and macro backdrop that it modeled into its 2023 guidance. The word “cautious” was used 11 times throughout the transcript to describe how it’s thinking about forward assumptions.
Still, considering Walmart’s low price point and less discretionary skew, it’s relatively insulted from macro pressures vs. much of its competition. Recessions in the past have actually been an accelerant for its business. So? While it is “excited about results and momentum in all segments” it prudently chose to assume the worst amid all of the macro uncertainty. It really sounded like the guide was overly pessimistic which is impressive considering it was largely in-line with analyst estimates.
Advertising & Fulfillment:
Its global advertising business grew 30% YoY to $2.7 billion in 2022 and grew 41% YoY in Q4 specifically. It looks like the programmatic advertising partnership with The Trade Desk is going very well.
Signed a new deal with Salesforce to scale local fulfillment and delivery.
I posted a side-by-side comparison of The Home Depot’s and Walmart’s reports which can be found here.
13. Booking Holdings (BKNG) -- Q4 2022 Earnings Snapshot
Booking is a direct competitor to Airbnb and a great view into the health of the travel and service industries.
a) Results vs. Expectations
Beat revenue estimate by 3.8%; met nights booked guidance.
Beat EBITDA estimate by 6%; beat “at least” guide by 12.7%.
Beat GAAP EBIT estimate by 25%; beat $22.08 EPS estimate by $2.66.

b) Forward Guidance
Booking’s Q1 “at least” 2023 EBITDA guide beat estimates by 6.8% or more.
c) Balance Sheet & Liquidity
$12.4 billion in cash & equivalents.
$12.5 billion in debt ($500M current).
36% 2022 FCF margin vs. 23% YoY.
Bought back $6.6B billion in 2022. Share count shrank 8% YoY. Strong.
d) Call & Release Highlights
Like Airbnb, Booking called out resilient consumer travel demand. It added that those trends had further strengthened so far in 2023. People are clearly eager to travel the world, and that’s great news for Booking and the space as a whole. In a shift back from goods-based economic consumption to services-based, these companies should continue to enjoy robust growth despite macro pressures. And speaking of those macro pressures, not only does it continue to see nights booked growth accelerate, but it’s happening at stable average nightly rates and not due to discounting.
“We have not seen a change in the mix of hotel star ratings being booked or change in length of state that could indicate that customers are trading down” – CFO David Goulden
“Regarding our long-term outlook for travel, we are pleased with the positioning of our business and are positive about the future… We're very encouraged by the continued strength and resiliency of travel demand last year and into the new year, which speaks to consumers' strong desire to travel.” -- CEO/President Glenn Fogel
Click here to compare these results to Airbnb’s Q4.
14. Macro
a) Key Data from the Week
Personal Consumption Expenditures (PCE) Inflation Data:
YoY Core (strips out volatile food & energy costs) PCE was 4.7% vs. 4.3% expected and rose from 4.6% last month to mark an interruption in downward inflation trends.
Month over month (MoM) Core PCE was 0.6% vs. 0.4% expected and 0.4% last month.
YoY PCE was 5.4% vs. 5% expected and 5.3% last month.
MoM PCE was 0.6% vs. 0.5% expected and 0.2% last month.
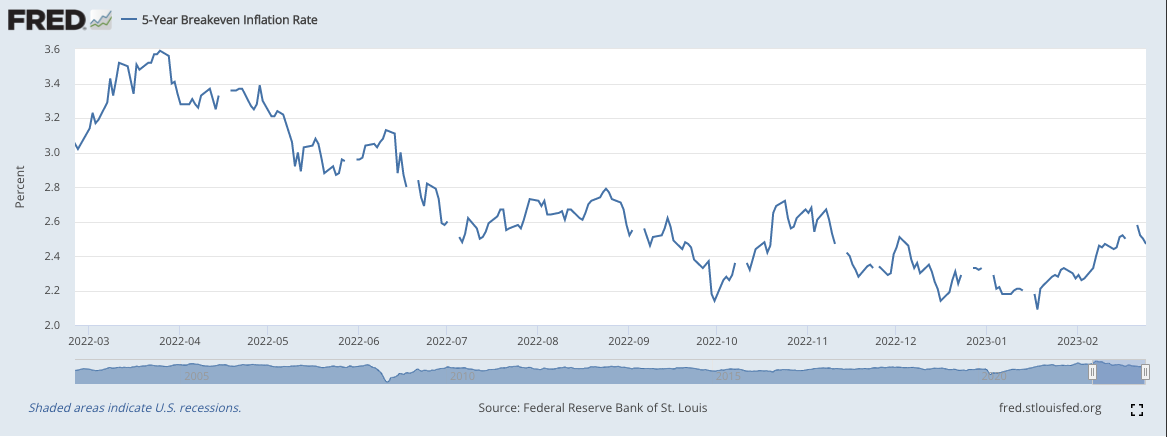
5-year breakeven inflation rates encouragingly fell this week despite the PCE data:
Economic Output & Employment Data:
The Manufacturing Purchasing Managers Index came in at 47.8 vs. 47.1 expected and 46.9 last month.
The S&P Global Composite PMI came in at 50.2 vs. 47.5 expected and 46.8 last month.
The Services PMI came in at 50.5 vs. 47.2 expected and 46.8 last month.
Existing home sales of 4 million missed expectations by 2.4%.
Q4 GAP came in at 2.7% vs. 2.9% expected and 3.2% last quarter.
Initial Jobless Claims were 192,000 which was better than the 200,000 expected.
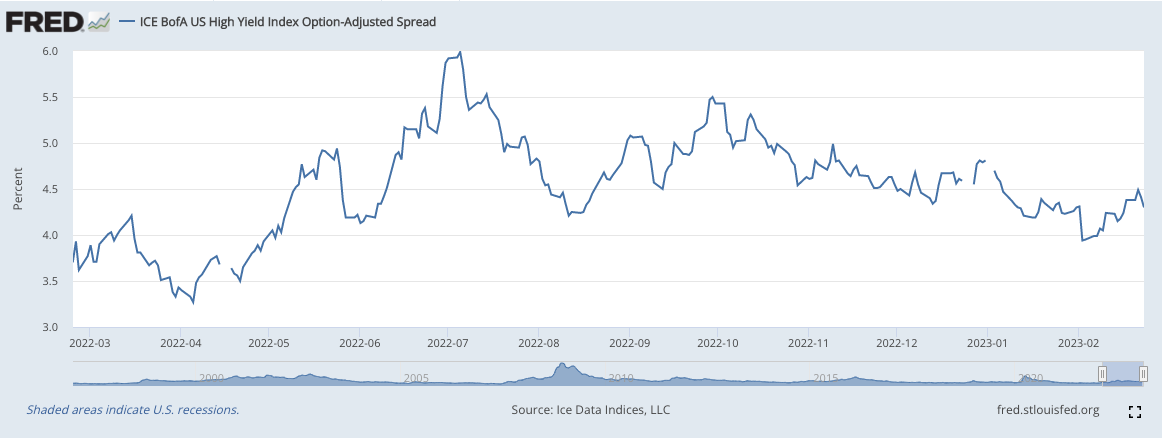
High yield option adjusted corporate credit spreads improved this week:
b) Level-Setting the Data
January was the most disappointing month of inflationary data we’ve gotten in several months. While this could easily revert back to disinflation in February and while it was influenced by China’s current reopening, the hot PCE data must be paid attention to. Because this data continues to coincide with resilient output and employment data, a continuation in hot inflation readings could mean rates are hiked more than the 25-50 basis points that I expected before the pause.
I still see a pause in 2023 and am not considering liquidating any positions because of one poor month of inflation data. But still, that pause could now be pushed to the second half of the year if trends continue worsening.
This is leading me to more readily trim profits on the way up (as I’ve done the last few weeks) and add more cautiously on the way down. It’s also leading me to lighten up on my speculative investments that are reliant on macro-cooperation for their success -- Upstart and Lemonade. Poor quarters from both of them contributed to that decision too.
15. My Activity
I cut 53% of my stake in Lemonade for reasons mentioned in my earnings review above.
I started a new position in Uber.
If you’d like to follow my transactions in real-time with optional text or email alerts and context-rich comments -- you can do so for free here.