

News of the Week (February 6 - 10)
News of the Week (February 6 - 10)
PayPal; JFrog; Progyny; Shopify; Airbnb; CrowdStrike; Olo; Upstart; Chipotle; Fortinet; Uber; Disney; Cloudflare; Macro; My Activity


Today’s piece is powered by Savvy Trader:

Welcome to the 370 new readers who joined us this week. We’re delighted to have you as subscribers & determined to provide as much value & objectivity as possible.
1. PayPal (PYPL) -- Q4 Earnings Review
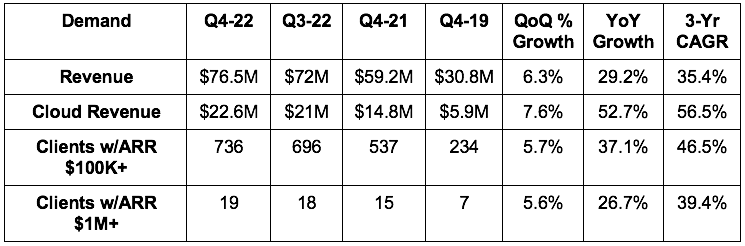
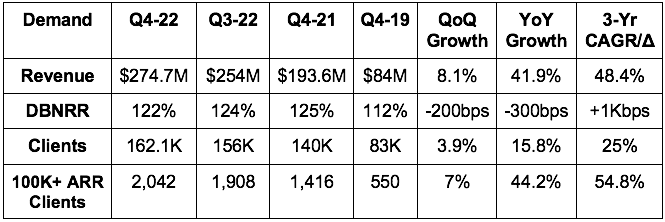
a. Demand
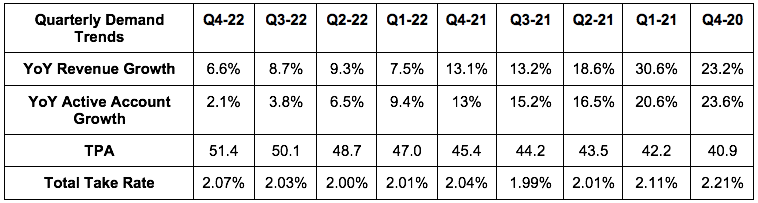
Met revenue estimates & its guidance with an expected foreign exchange (FX) headwind of roughly 150 basis points (bps).
Missed total payment volume estimates by 2.2%.

More Demand Context:
The 14.1% 3-yr revenue CAGR compares to 16.1% last Q & 16.5% 2 Qs ago.
FX was a 200 bps headwind to revenue & 400 bps headwind to TPV. It’s larger for TPV because hedging gains of $152M in Q4-22 help offset the revenue FX headwind but have no impact on the volume FX headwind.
This is the first time in several years that PayPal’s take rate grew sequentially for 2 straight quarters. This is DESPITE its eBay take rate falling from 2.29% to 1.95% YoY due to eBay’s payments migration.
Added 8.6 million net new active accounts in 2022 vs. guidance of 9 million.
PayPal core daily active accounts are growing at a 3-yr CAGR of 12%.
TPA & TPV growth powered by Braintree and Venmo.
For 2022 as a whole, revenue grew 8% YoY, 10% on an FX-neutral basis and 13% FX-neutral and ex-Ebay migration (which is now in the rearview mirror).
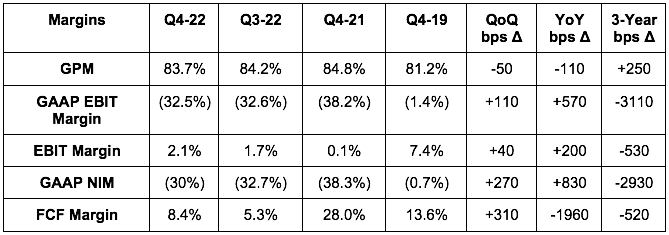
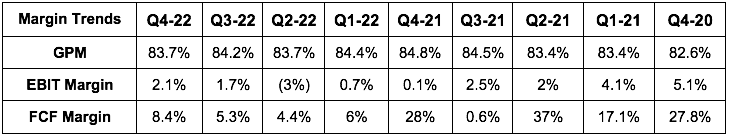
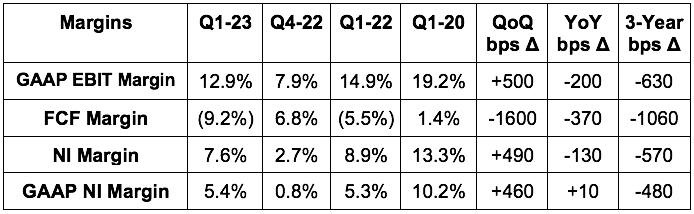
b. Profitability
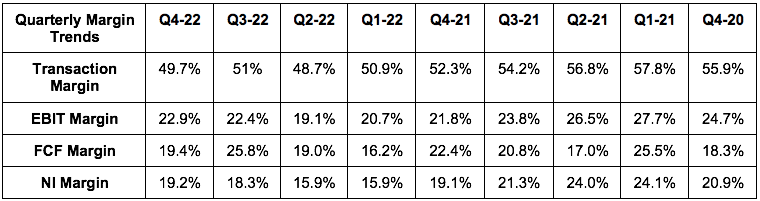
Beat EBIT estimates by 2.4%.
Beat $1.20 EPS estimates & its guide by $.04.
Missed $0.84 GAAP EPS estimates & its guide by $.03.

More Margin Context:
Non-transaction OpEx fell 6% YoY vs. double digit growth we had seen in 2021 & early 2022.
PayPal’s effective tax rate this quarter was 16.6% vs. 9.2% YoY. Net income margin expanded while EPS grew by 12% YoY regardless of this headwind as PayPal’s cost controls have taken hold & are accelerating.
It was encouraging to me to see YoY EBIT, net income and cash flow margins improve. A combination of the following factors had been weighing on margin lines since end of 2020
eBay take rate compression
Braintree proliferation
lapping credit reserve releases
lapping the stimulus-related debit and demand shocks
pandemic-related cross-border struggles
It’s now finally resuming the previous operating leverage trend that investors had grown accustomed to through cost controls, Braintree economies of scale and Venmo monetization rapidly diversifying beyond ultra-low margin peer-to-peer (P2P) payments.
c. Balance Sheet
$15.9B in cash & equivalents.
$10.8B in debt.
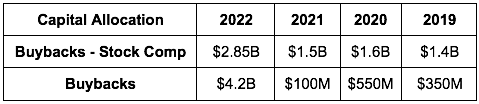
Bought back another $1 billion in stock in Q4 to bring total 2022 buybacks to $4.2 billion or 5% of the overall market cap.
As I’ve said many times before, the relative strength of PayPal’s balance sheet vs. most of its competition puts it in an ideal position for selective M&A as valuations have plummeted. It can plug any pressing innovation gaps that it sees from acquisitions thanks to this strong liquidity position and hefty free cash flow generation.
d. Forward Guide
Q1 2023:
PayPal guided to 7.5% YoY revenue growth which missed estimates by 0.4%. The guidance includes a 150 bps foreign exchange headwind.
Missed GAAP earnings per share (EPS) estimates of $0.71 by $0.08. This includes a $0.02 benefit from its equity investments.
Beat EPS estimates of $1.07 by $0.02.
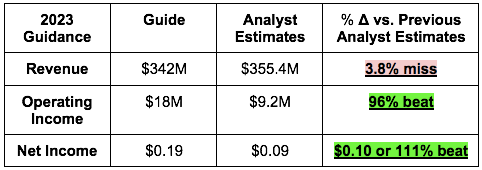
2023:
Met GAAP EPS estimates. This includes a $0.20 negative impact from its investment portfolio valuation.
Beat $4.76 EPS estimates by $0.11.
PayPal raised its EBIT margin expansion guide for 2023 from 50 basis points 2 quarters ago to 100 basis points last quarter and now to 125 basis points as of this quarter. It continues to find more areas of cost savings while assuring investors it is still aggressively investing in high conviction growth areas & branded checkout.
Expecting FCF of $5 billion. Flat YoY FCF growth is due mostly to a higher expected tax rate.
Effective tax rate to be 18% vs. 16% YoY.
GAAP Effective tax rate to be 28% vs. (2%) YoY.
Expecting 75% of FCF ($3.75 billion) to be allocated to buybacks (82% of FCF was allocated to buybacks in 2022).
PayPal’s shift to a focus on engagement vs. account growth will continue to lead to low engagement account churn as it eliminates promotions to retain them. This will lead to flat active account growth for 2023 but still modestly growing monthly active account growth from the 190 million it has today.
Braintree growth to decelerate throughout 2023 as comps get tougher.
e. Call & Earnings Release Highlights
Schulman Retiring:
Dan Schulman will retire at the end of 2023. I’m not quite sure if this was voluntary or if the board forced his hand but let’s assume the best. Schulman’s team struggled to model pandemic trends and was caught with their pants down in late 2021. While it has effectively integrated several key acquisitions, a reputation of “slow innovation” has crept up on Schulman since 2020. And it’s somewhat warranted with factors like slow Venmo product expansion for critics to point to. I think Schulman effectively tightened PayPal’s belt and put it in a strong position heading out of this downturn, but I still view this as a positive transition (depending on who the replacement is).
Branded Checkout:
Schulman immediately told us on the call that PayPal “at a minimum” maintained e-commerce branded checkout market share throughout 2022. He added he was confident the company would continue to hold market share across its core markets with a possibility of share gains as “branded volumes have accelerated so far into February” per Schulman.
A few institutions have come out with notes hinting at this branded share eroding, so this was wonderful to hear and likely why it was addressed so early in the call. Schulman alluded to some analyst confusion with modeling e-commerce share being a factor of having no perfect data source to track it.
Branded PayPal checkout volume grew 5% YoY in 2022 as a whole.
PayPal branded checkout gained share in November, lost less share during Black Friday-Cyber Monday (largely due to an extra Amazon Prime Day YoY) and held share in December with gains so far in 2023. It’s gaining share in Europe, losing share in Australia and maintaining share in North America.
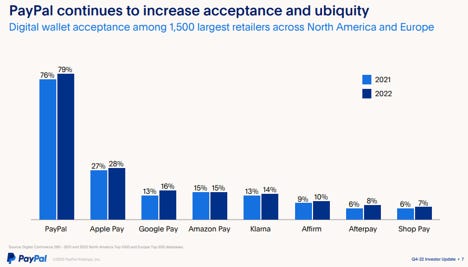
PayPal’s digital wallet (which is an intimate complement & extension to branded checkout) continues to grow market share vs. manual card entry & competition.
PayPal continues to onboard merchants to its new fully in-line (meaning checkout happens within the merchant’s site rather than bouncing a shopper out to PayPal and back). This has been shown to juice conversion rates considerably due to the diminished friction.
33% of PayPal’s top 100 merchants are on its latest checkout tech stake vs. 25% YoY. It plans to reach 50% in 2023. PayPal is gaining significant branded share with its cohort of merchants on this upgraded checkout stack.
This upgrade delivers a mean conversion boost of 6.5% for merchants.
PayPal’s large merchant adoption share lead continued to grow in 2022 vs. 2021. Surprisingly & encouragingly it jumped 300 bps vs. Apple Pay (which I view as the biggest PayPal threat despite the new partnership) which rose just 100 bps on a lower base:
Buy Now, Pay Later (BNPL):
Leadership reiterated plans to sell a large chunk of BNPL receivables in 2023 to strengthen the balance sheet. It has done this with some other U.S. receivables with Synchrony Bank in the past. I love this move. Be asset light.
PayPal BNPL has now crossed 30 million users just 2 years into its launch.
BNPL users spend 30% more through PayPal and churn 10% less frequently on average.
90% of BNPL repayments are through debit fund sources which means higher transaction margins for PayPal due to lower 3rd party interchange fees.
Added “Pay Monthly” as a new BNPL repayment format during the quarter.
Keep in mind that BNPL is still a tiny portion of overall PayPal volume. But It’s going very well and is arguably PayPal’s biggest success story for homegrown product innovation over the last few years. It didn’t buy an AfterPay-like competitor to get here. Just minor M&A and effective R&D.
PayPal’s reserve coverage ratio of 7.4% for BNPL was flat QoQ due to solid repayment performance of these loans continuing. PayPal maintained its industry leading authorization & loss rates. Good combination.
2 million merchants now offer PayPal BNPL with transaction volume in 2022 rising 160% YoY to $20.3 billion. This marks an acceleration from the 157% year to date growth that PayPal BNPL reported in Q3 2022.
300,000 merchants now offer PayPal BNPL upstream from their checkout pages vs. 200,000 just 6 months ago and 30,000 18 months ago. This means the option is presented to customers earlier on in the shopper flow which materially bolsters PayPal’s checkout market share.
Venmo:
Venmo TPV for 2022 as a whole grew 7% YoY after 44% growth in 2021 via a large pandemic demand pull-forward. This represents a 24% 2-year CAGR when smoothing out the impact of this acceleration.
Pay with Venmo on Amazon is now fully rolled out to U.S. customers.
Starbucks added pay with Venmo as an option for its loyalty program. Users can now save their accounts in the app to pay in store or ahead. Furthermore, they can use Venmo as a funding source to replenish account balances.
Cost Controls:
“The quarter was clearly a positive inflection point and a clear sign of cost discipline in our pursuit of profitable growth.” -- CEO Dan Schulman
PayPal now expects $1.9 billion in total OpEx savings in 2023 vs. previously guiding to $1.3 billion. This was the source of the 2023 profit beat vs. guidance. Leadership sees growth and operating leverage over the next several years but declined to specifically guide to that. Importantly, PayPal’s cost structure has now been right-sized in the eyes of leadership.
2023 Guide:
PayPal’s 18% EPS growth guided to for 2023 (vs. previous guidance of 15%) assumes wildly pessimistic revenue expectations. Schulman on the call told us that “actual revenue expectations” are well higher than the plans for 2023 assume. If this better revenue performance comes to fruition, a significant portion of that would feed incremental bottom line growth.
“2023 guidance is what we see as a worst-case revenue assumption with global recession, persistently high inflation and muted discretionary spend… We designed our targets based on what we believe to be a conservative planning assumption of mid-single-digit FX-neutral revenue growth rate in order to give confidence in EPS targets.” -- CEO Dan Schulman
PayPal’s 2023 baseline assumptions also include low single digit e-commerce growth vs. the significantly faster rate that e-commerce had gotten used to before the pandemic pull-forward. Leadership acknowledged macro green shoots forming, but decided not to build any of the positive news into its forecast. Still, we were told that “Q1 is off to a much stronger start than expected” which bodes well for the year as comps will ease while macro shouldn’t worsen too sharply and could even improve throughout 2023.
New White-Label Initiative:
PayPal has now fully released its non-branded end-to-end payments service for SMBs called PayPal Complete Payments (PPCP). It’s working with Adobe and TikTok as selling partners for this new product in France.
PPCP complements Braintree’s Fortune 500 brand niche and adds another $750 billion in total addressable market (TAM) to its white-labeled checkout suite. Furthermore, lower volumes per SMB merchant will mean better margins for this endeavor vs. Braintree as a whole. This could be a timely offset to the margin headwind that Braintree on its own presents.
New Products & the Digital Wallet:
PayPal continues to work on integrating all of the new “disparate” (Dan’s words) products it offers (high yield savings, bill pay, charitable giving, international remittance, cards, rewards, Honey deals) into a “seamless user experience” on PayPal’s digital wallet as well as Venmo’s.
Schulman also spoke on a renewed focus on P2P payments. While it’s ultra-low margin, it leads to higher account balances which translate into incremental high margin volume through debit interchange fees.
Revenue Mix:
Unbranded processing now makes up 30% of PayPal revenue vs. 24% YoY & 19% in 2019. This is taking total TPV share from PayPal Branded checkout which is now 30% of total volume vs. 33% YoY.
eBay is now 2% of volume vs. 4% YoY.
Venmo is stable YoY at 18% of volume.
The Other Merchant Services bucket is stable YoY at 10% of volume.
f. My Take
If you listen to social media herd, nobody uses PayPal or its suite of products just like nobody uses Meta’s Family of Apps anymore. It’s easy to get lost in that noise while it’s far more productive to track user and engagement numbers as evidence of these trends rather than relying on random opinions.
The data for PayPal continues to be positive in my view. Branded checkout share was maintained throughout 2022 with acceleration thus far in 2023. That is an imperative piece of this investment working. Margins are being bolstered through needed cost controls all while revenue continues to compound at a multi-year double digit growth clip. With 18% EPS growth confidently expected in 2023, the firm now boasts a PEG ratio of 0.91. This is a clear example of growth at a compelling price. Not a perfect quarter, but still a thumbs up from me.
2. JFrog -- (JFROG) Q4 2022 Earnings Review
a. Demand
Missed its revenue guide & estimates by 0.6%.
Met cloud growth guidance of 50%+.
More Demand Context:
JFrog enjoys 89% of the Fortune 100 as clients. Most of its growth going forward will come from net revenue expansion with existing clients. JFrog customer count grew by 8.2% YoY in 2022 vs. about 10% growth in 2021.
Gross retention rate is stable at 97%.
Revenue rose 35% YoY for 2022 as a whole.
JFrog Complete (its full platform) = 43% of total revenue vs. 35% YoY.
Cloud revenue = 30% of total revenue vs. 25% YoY. Cloud for 2022 as a whole grew by 60% YoY to $80M.

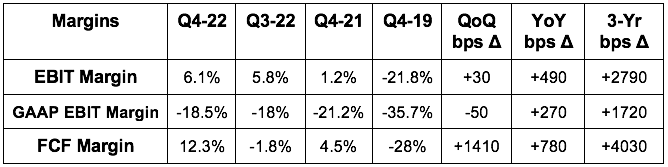
b. Profitability
Beat its non-GAAP EBIT guide & estimates by 6.7%.
Beat its EPS guide of $0.015 by $0.025 & estimates of $0.02 by $0.02.
Missed GAAP EPS estimates of ($0.18) by $0.05.
Beat FCF estimates by 10.3%.
More Margin Context:
FCF continues to be negative without the stock compensation add back.
GAAP margin worsening is all IPO stock comp & ramping product investments related. Operating leverage is expected going forward. This is also why it generated just $17 million in free cash flow in 2022 vs. $24 million in 2021.
Non-GAAP gross margin worsened from 84.1% to 84.0% in 2022 vs. 2021. Falling gross margin is the result of cloud growing in proportion of total sales vs. on-premise. Leadership expects GPM to converge towards 80% over time.
“As we step into 2023, we see opportunities to leverage investments we’ve made to expand profitability while delivering top line growth. JFrog was founded in a recession and is well positioned to deliver in uncertain times.” -- Founder/CEO Shlomi Ben Haim
c. Balance Sheet
$443.2M in cash & equivalents.
No debt.
Stock comp was 24.5% of sales in 2022 vs. 27.6% YoY. Too high and I want to see faster progress here.
d. Guidance
Q1 2023 Guide:
Missed revenue estimates by 3%.
Beat non-GAAP EBIT estimates of $900K by 122% or $1.1 million.
Beat EPS estimates of $0.01 by $0.03.
More 2023 guidance color:
Continued single digit new logo growth in 2023.
Cloud growth is expected to slow from mid-50% range to mid-40% range.
JFrog is clearly tightening its belt and prioritizing more of a growth & profit balance vs. growth at all costs. The guide was called conservative.
e. Notes from the Call
Macro:
DevOps and security markets are among the most resilient areas of tech spend. Still, JFrog is dealing with incremental lengthening of sales cycles, added budget approval layers and continued cloud usage optimization. These headaches worsened further into the start of 2023 and are expected to continue worsening all year. This is why YoY revenue growth is expected to slow to 22% while net revenue retention falls towards 120% throughout the year.
We heard very similar commentary from GitLab (JFrog’s source code complement that it’s frequently deployed alongside) this week as it laid off 7% of its staff. When combining this news with JFrog’s retention and competitive win rates remaining consistent and strong, it’s clear this weakness is macro-related.
Customer Wins & Competition:
Leading global payment processor standardized on the JFrog Complete platform in a Sonatype Nexus displacement.
One of the largest Commercial Banks in Europe added JFrog Artifactory and Advanced Security. This was already a GitLab customer, providing more evidence for how complementary source code and binary players are within DevOps.
Fortune 100 Pharmacy went with JFrog’s security solutions ($500,000 contract) to replace multiple existing vendors including AWS.
Leadership was asked about Microsoft’s new source code automating tool called autopilot. It sees this as complementary to its product offering just like its GitLab and Microsoft’s GitHub are. Constant software releases rely on endless scalability. Endless scalability relies on translating disparate source code languages into machine readable binaries. That’s what JFrog Artifactory does.
Price Hikes:
JFrog will raise on-premise subscription prices in 2023 to accelerate the shift to the cloud. This will add $6 million to its 2023 revenue number.
Cloud:
JFrog’s Pay as You Go tier for cloud customers is 25% of cloud revenue vs. 33% YoY. Longer subscription plans lead to slower short term growth but more visible revenue generation and higher customer lifetime value.
f. My Take
This was an underwhelming yet still fine JFrog quarter. Unlike other growth stocks, its 2023 revenue miss was small while its profit guide nearly doubled expectations. It’s effectively controlling costs to bolster margins while poor macro persists. And if it can do so while still delivering 20%+ growth during a hectic year, that works for me.
JFrog owns binary management market share and has ample opportunities to continue to effectively up-sell its new value-added products on top of that. That’s why management sees long term 30%+ revenue compounding and why I do too.
Savvy Trader is the only place where readers can view my current, complete holdings. It allows me to seamlessly re-create my portfolio, alert subscribers of transactions with real-time SMS and email notifications, include context-rich comments explaining why each transaction took place AND track my performance vs. benchmarks. Simply put: It elevates my transparency in a way that’s wildly convenient for me and you. What’s not to like?
Interested in building your own portfolio? You can do so for free here. Creators can charge a fee for subscriber access or offer it for free like I do. This is objectively a value-creating product, and I’m sure you’ll agree.
There’s a reason why my up-to-date portfolio is only visible through this link.
3. Progyny (PGNY) -- Short Report
Spruce Capital -- a New York-based short-seller -- published a new short report on Progyny this week. While this is not Jim Chanos or Carson Block, it’s still a legitimate firm and its position must be considered.
Much of the content was recycled from a December short report that I wrote about at that time. To me, both of these reports hint at a bit of confusion about fertility benefits and the insurance industry. There were new concerns raised and I had a lengthy discussion with leadership to address those. Following this talk, I don’t view the report as concerning and I am happy to have Progyny a core holding.
On Un-billed Accounts Receivable (AR) Soaring Over the Last Several Quarters:
The firm alleged that Progyny’s upward trend in un-billed AR was the result of “aggressive revenue recognition” from 9 new clients to meet guidance. This is not accurate for a few reasons.
First, Progyny cannot unilaterally flex up or down un-billed AR on a whim. Management cannot decide to take more un-billed AR for itself to meet revenue targets and earn more shares. Why?
Un-billed AR is realized after a clinic fulfills a course of treatment and is strictly tied to the value of that treatment. So, if Progyny were withholding more than its fair share, one of two things would happen: Either clients would quickly realize they’re paying out more in service fees than mandated contractual terms, or there’d be no money left over to compensate fertility clinics and they’d stop servicing Progyny clients over time. The claim of unscrupulous behavior dates back several quarters, yet neither of these things have happened. It appears to be a false allegation for a highly scrutinized, audited, and SEC regulated public company.
Furthermore, as Progyny is a fully carved out portion of client insurance carrier plans, these insurers wouldn’t continue working so closely with Progyny if it was fraudulently withholding funds from the clients these carriers serve. The insurers rely on accurate, honest data sharing between Progyny and their networks to ensure carriers are appropriately paying out benefits and tracking deductibles for the rest of their operations. So? Progyny accounting fraud would mean anomalies in national carrier financials and frustrated customers as things like premiums and deductibles were handled inaccurately. Again, not happening.
Put plainly, Progyny cannot randomly choose to take more of that share without destroying its reputation and the unique service supply chain it has painstakingly built. And again, if it did, how would this process last for longer than a few months let alone the several quarters that this report alleges? It wouldn’t. Un-billed AR is typically settled within 30-60 days of a service being completed, so either Progyny’s supply chain would quickly crumble or its revenue and profit would take large hits.
Not only has none of this happened, but Progyny’s client retention has been near 100% for years while a long list of fertility clinics are lined up to try and enter its exclusive network. It also just raised its Q4 2022 guide while offering a very optimistic view of 2023 new client growth, utilization and profit with the selling season largely complete.
As an aside, the report called out falling YoY utilization rates for 2022 as a concern. Leadership told me on our call that stronger than expected utilization was the reason for recently raising its guide. Furthermore, utilization is up vs. 2020 and 2021 utilization enjoyed a small boost from easing variants and reopening.
So then why is un-billed AR sharply rising? Ironically, this confusion is actually a byproduct of Progyny’s selling season going extremely well. It’s a good thing. When Progyny adds a new client, there’s a cumbersome integration and on-boarding process to create a real-time data channel between clients, carriers/insurers and Progyny. To be candid, carriers are not the highest tech, fastest moving business -- so this takes time.
While this process is playing out, services are conducted, but Progyny does not bill clients. Instead, it waits for terms and plans to be finalized so it can be sure it’s billing and paying out fees in the accurate amount. The fulfilled service value sits on Progyny’s financial statements as un-billed accounts receivable until settlement. While the report thinks 9 new clients are responsible for all of this un-billed AR bloat, it’s actually 26 new clients.
Uniquely this year, Progyny added 17 new early clients which it was still on-boarding as of Q3 2022 -- per leadership. Specifically, it guided to reaching 265 clients by June 30th 2022 while it ended up with 282 clients and 600,000 more covered lives than anticipated. That is by far its largest simultaneous block of on-boarding for the reported Q3 period and is why the un-billed AR number was bloated. In my chat with leadership this week, they informed me that they’re still wrapping up on-boarding those 26 new clients.
So? This firm is accusing Progyny of fraud because it’s surpassing the financial targets that it guided to. How dare it add too many clients!
On Steering Patients to Higher Revenue Services vs. Higher Efficacy Services & Data:
The report also claimed that Progyny is steering stakeholders to lower efficacy, higher revenue treatments for its own gain. The entire point of Progyny’s business model is making custom-built treatment options available for all patients. It removes mandated step therapies and dollar maximums to save significant NICU hosts. This leads to 25% client savings as well as better pregnancy KPIs (vetted by a 3rd party that the report seems to dismiss for whatever reason) with those leads growing annually for nearly a decade. Progyny has no influence over designing these plans. That is ENTIRELY up to the patient, specialist and patient care advocate.
While it’s somewhat valid that Progyny’s client base is covered more completely than the rest of the country which makes those KPI comps differ -- that’s the entire value proposition here: Bolstering access and improving outcomes through rational procedures and costs. This is direct evidence of its mission working.
On adjusted EBITDA:
The report offered skepticism on Progyny’s adjusted EBITDA number. I would say that incremental EBITDA margins point to consistent and smooth leverage here, but as Charlie Munger always laments, adjusted EBITDA is a fluffy profit number. Fair enough.
The stock comp complaint is also a fair one, but needs more context. Stock comp at 11% of revenue is relatively modest for a hyper grower like this one. Furthermore, it includes equity grants that were just issued to leadership which will vest throughout the year. Thereafter, stock comp as a percent of revenue should again begin to fall sharply. Furthermore, its EBITDA to GAAP operating cash flow conversion rate spiked from 38% in 2021 to 60% in 2022. You can’t fudge GAAP operating cash flow. And? We’ve already been told that GAAP operating cash flow for Q4 2022 will be $50 million vs. less than half of that generated all of 2021. This early disclosure was its way of telling us that revenue was being collected and paid out as expected with no repayment or bad debt issues arising.
On Tech Layoffs, Saturation & Macro Preventing Progyny from Hitting 2023 Guidance:
The firm clearly does not listen to Progyny earnings reports or read its results (It also did not contact Progeny to investigate the allegations before publishing the short report). Beyond Progyny’s growth for 2023 already assuming slowing from 50%+ to the 30% range, we have been explicitly told that the 2023 guide assumes a halting of existing client employee growth. Furthermore, industries like travel and others are Progyny’s strongest source of new client growth and are “more than” picking up the slack that the tech layoff void left. Finally, Progyny only serves North America while these layoffs have spanned the globe. Not as important as the first point here, but still worth noting.
The market saturation argument and its inability to find more Fortune 500 clients makes no sense to me. Progyny’s large employer penetration rate is under 5% with roughly 50% of large employers still not offering any form of fertility coverage while their employees frequently demand it. The low hanging fruit is there to be devoured and Progyny has been doing that for 7 years now.
In terms of a looming recession, Progyny wasn’t around during the Great Financial Crisis. What was around was cash-pay fertility treatment which experienced slowing but continuing growth through the teeth of the economic chaos. Fertility treatment is not nearly as discretionary as this report paints it as. Biological clocks are finite and the pursuit of parenthood is an emotional, passionate one. Furthermore, Progyny’s ability to move fertility treatment away from out of pocket cash pay should make this sector even more resilient than it was in 2008-2009.
On Fraudulent Leadership:
The report claimed that a coincidence of adding 1.2 million new lives vs. 1.2 million in the previous year meant fraud. I don’t think a coincidence can be called fraud when we have such a stable 4 year track record of drama-less execution from this firm. I do not care if Progyny’s chairman worked at WebMD when accounting issues arose. WebMD went on to deliver strong capital market returns thereafter and Chairman Schlanger was not implicated in the charges.
Conclusion:
Big, fat nothing burger (without cheese).
4. Shopify (SHOP) -- 2023 Shopify Editions Highlights
Shopify Editions 2023 summarized many of the new product initiatives I’ve been covering in the newsletter over the last several months. There was not a ton of new information shared, but here’s what we did learn:
Debuted “Shop Mini” — a new software development kit (SDK) — to extend the building & design tools on Shopify’s online store to merchant pages in the Shop App. Perks here include smart recommendations on which merchant products will sell the best on the Shop App.
This customization can be done with app blocks in a no code manner to juice conversion rates by up to 15% for merchants with any level of tech expertise.
Shop Cash Campaigns are now in full swing for Plus merchants. Shoppers using Shop Pay earn Shop Cash when they transact. This can be used as a currency with Shopify merchants. Merchants have access to customer segmenting and Shop Cash balances to target promotions. Merchants pay for this service only as they generate revenue from it.
These campaigns early on are delivering a 43% boost to user growth for merchants with lower customer acquisition cost.
Sign in with Shop is a new password-less sign in method to raise conversion by 8%.
The Shop Promise perk within Shopify Fulfillment Network (SFN) is delivering the same 25% boost to merchant conversion that Amazon’s Buy with Prime does. This product ensures delivery times upon consumers completing a purchase.
5. Airbnb (ABNB) -- New Requirement
Airbnb will add a new layer of identity verification to book a residence starting in the coming months. While this will add booking friction and could have a small impact on demand, it’s a necessary maneuver for appeasing regulators. Short-term rentals stormed onto the scene faster than the regulatory environment could establish a set of ground rules governing how they function.
Airbnb has been among the most proactive in the space at conceding tweaks and updates to their platform to ease lawmaker concern. It is and will continue to be a necessary piece of its operations. Like Uber has dealt with ample regulation as it transformed the Taxi-cab industry, a very similar theme is playing out here for Airbnb. With its balance sheet, strong free cash flow, scale and brand power, it’s in a better position to flexibly comply than smaller players with more finite budgets.
6. CrowdStrike (CRWD) -- Promotion
CTO Adam Sentonas has been promoted to company president. Considering the rapid product expansion that he spearheaded along with the brisk module up-selling we’ve seen, I view this as a promotion well deserved. Elite talent will be needed to continue taking endpoint market share and to continue winning in new categories like zero trust, log management and cloud workloads. Keep him happy. Keep him at CrowdStrike. He’s a star.
7. Olo -- Borderless
Olo expanded the availability of its Olo Pay module for all Olo Pay customers. This had been for Olo Serve customers only. Borderless Pay functions somewhat similarly to Shop Pay (as Olo leadership frequently tells us). It allows Olo to leverage the scale of its 600 brand clients to allow customers to create one account to be used to speed through checkout at any of those Olo Pay brands. This reduces bounce rates, raises conversion, juices client revenue AND gives brands far more holistic access to consumer data to guide marketing and growth spend. Olo Pay alone raises Olo’s revenue per order by 4X -- meaning value added extensions of the service like this one could easily and expeditiously offer a material boost to its sales.
8. Upstart (UPST) -- Macro, Earnings & Affirm
Heading into SoFi’s earnings report, I was quite optimistic. SoFi Leadership boasted a rock-solid track record of under-promise and over-deliver and its affluent credit niche was holding up relatively well amid macro chaos. And unsurprisingly, the report was very good. That same optimism cannot be extrapolated for Upstart’s upcoming earnings report next week. I’ve said this several times over the past year, but feel another timely reminder is warranted.
Upstart’s subprime niche and management’s multiple operational and guidance-based blunders leave me far less confident in its next few quarters than I am for virtually all other holdings. Still, I do believe in the business model and will continue to hold it as one of my smallest, most speculative positions. I view the potential upside associated with more effective credit underwriting for a demographic that has been largely left behind as wildly compelling. And I view Upstart’s past credit data and relatively strong liquidity position as giving it a chance to realize that upside. They have so much left to prove, and I’m not willing to accumulate at what could be stupidly cheap multiples (in hindsight) until that proof becomes clearer.
To be candid, I have never been more tempted to add a put hedge heading into the report. I ultimately decided against it as it breaks my rules and deviates from my process. But the temptation was real. I’ll continue to hedge the position’s risk via small allocation and accumulation pause.
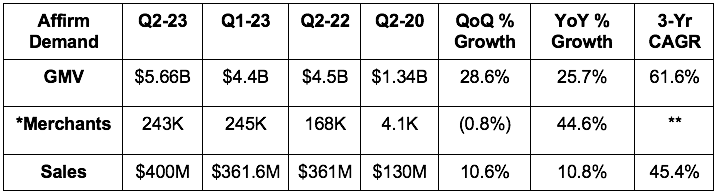
As another sign that Upstart’s exogenous backdrop remains challenged, Affirm struggled mightily with this earnings report last week. It missed top line estimates by a few percent and missed operating income estimates by 36%. In terms of its 2023 guide, it lowered previous demand forecasts by 7% while lowering its adjusted EBITDA guide by 23%. Unlike other firms that are pulling back on demand growth in search for better margins, this firm is missing demand expectations while margins worsen simultaneously.
Furthermore, its stock comp as a % of revenue remains at an inflated 30.5% and hasn’t moved down much since the IPO. The firm has seen some stabilization in 30-60 day delinquency trends which are actually better than pre-stimulus cohorts. That was the bright spot in the report that could potentially be seen as a positive hint for Upstart -- although Affirm leans even less subprime than does Upstart.
9. Chipotle (CMG) -- Earnings Snapshot
a. Results vs. Expectations
Missed revenue estimates by 1.3%.
Missed EBIT estimates by 2%.
Missed GAAP EPS estimates of $8.94 by $0.92.
Missed EPS estimates of $8.89 by $0.60.
b. Forward Guidance
Leadership told us to expect same store sales growth in the high single digit % range for Q1 with growth moderation starting in Q2 2023 as it laps menu price hikes. It continues to expect to open 255-285 new stores in 2023. No other guidance color was offered other than reiterating its long term target of reaching 7,000 locations.
c. Balance Sheet
$1.3B in cash, restricted cash & investments.
No debt with a $500M credit revolver that remains fully untapped.
Bought back $827M in stock in 2022… “will continue to opportunistically accelerate repurchasing as the share price falls with the market overall.”
$414M left in buybacks with a new $200M addition announced this quarter.
d. Call & Earnings Release Highlights:
Demand context:
Raised menu prices in Q3 2022 to offset rising input costs.
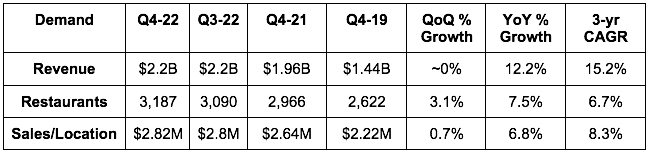
Comparable restaurant sales rose 17.5% vs. 7.6% QoQ & 15.2% YoY.
Opened 100 new stores (new record) with 90 having a Chipotlane (new record) vs. 43 QoQ with 38 having a Chipotlane.
Digital sales = 37.4% of food & beverage revenue vs. 37.2% QoQ.
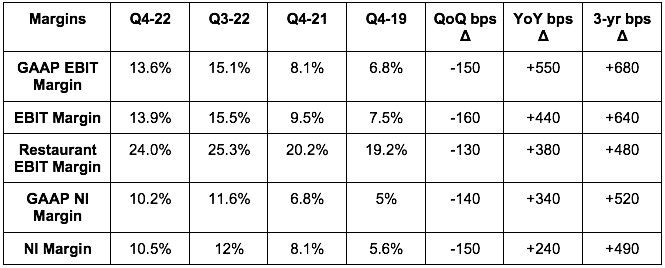
For 2022 as a whole, revenue rose 14.4% YoY, comparable store sales rose 8% and operating margin expanded from 10.7% to 13.4%. Strong performance.
2022 rewards members rose 20% to 31.6 million.
Chipotle’s new Garlic Guajillo Steak benefited revenue less than leadership thought it would.
Margin context:
YoY net income margin & EPS comps were hurt by a 26.3% tax rate for the quarter vs. just 20.3% YoY.
Food, beverage & packaging costs in 2022 were 30.1% of revenue vs. 30.6% YoY as menu price increases bolstered margins and easing avocado inflation helped too. Dairy, beef, chicken & corn inflation continued to hurt margins.
2023 to date:
Transaction trends have improved sequentially so far in 2023 as it laps the release of its popular brisket product.
Employee turnover set a 2 year low in December 2022 with 90% of restaurants back to fully staffed.
10. Fortinet (FTNT) -- Earnings Snapshot
Fortinet offers a variety of cybersecurity solutions within both network and endpoint niches. For this reason, it can be seen as a decent hint for CrowdStrike’s upcoming report (along with SentinelOne, Zscaler etc.).
a. Results vs. Expectations
Missed revenue estimates & its guide by 1.2%.
Beat its billings guide by 1.2%.
Beat gross margin estimates by 120 bps & its guide by 130 bps.
Beat EBIT estimates by 6.2% & its guide by 5.7%.
Its EBIT margin was 200 bps better than guided to.
Beat free cash flow estimates by 3.2%.
b. Forward guide:
Q1 2023:
Beat revenue estimates by 1.7%.
Missed EBIT estimates by 1%.
Met non-GAAP EPS estimates.
2023:
Met revenue estimates.
Met gross margin estimates.
Met EBIT margin estimates and so met EBIT estimates.
Missed non-GAAP EPS estimates of $1.42 by $0.02.
c. Balance Sheet Data
Stock-based compensation = 4.9% of revenue in 2022 vs. 6.2% in 2021.
Fortinet bought back $1.99 billion in stock in 2022 vs. $741.8 million in 2021.
$1.68 billion in cash & equivalents & another $530 million in short term investments.
$990 million in long term debt.
d. Call & Release Highlights
More Context on Demand & Margins:
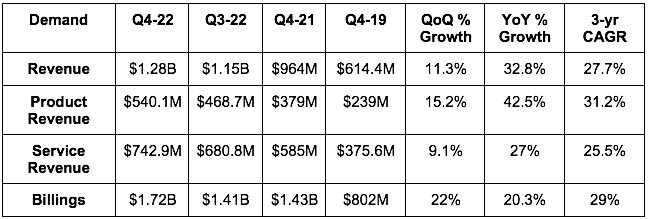
Revenue rose 32.2% in 2022 as a whole vs. 2021. Product revenue & service revenue rose 41.9% and 26.3% YoY respectively. Product revenue growth was held back by a “challenging global supply chain environment.”
Fortinet has 181 contracts worth over $1 million in value vs. 153 QoQ & 122 YoY.
Per IDC, Fortinet holds the #1 market share position of firewall appliance unit shipments at 48%.
27.7% 3-year revenue CAGR compares to 28.1% last quarter & 25.4% 2 quarters ago.
The Founder/CEO on Fortinet’s Continued Success:
Founder/CEO Ken Xie used his time to talk up the company’s market share gains and its relative durability in the face of weakening macro. This insulation from headwinds comes from Fortinet’s ability to consolidate security vendors, unify operations and lower total cost of ownership. Specifically, the firm highlighted a new client win for a large U.S retailer expected to save $6 million per year over the next 5 years with Fortinet.
This is exactly what CrowdStrike does within endpoint and workload security -- meaning this same ability should bode well for their continued demand strength heading into 2023.
Xie acknowledged tightening customer budgets and how nobody is fully immune from macro headwinds. And while this immunity doesn’t exist, he did call Fortinet’s niche a “relative safe harbor” with expectations of robust demand carrying into 2023.
Leadership wrapped up the call by reaffirming its long term targets of eclipsing $10 billion in billings by 2025, $8 billion in revenue, $2 billion in EBIT and adjusted free cash flow margins in the mid to high 30% range (it’s already there).
This was a great report.
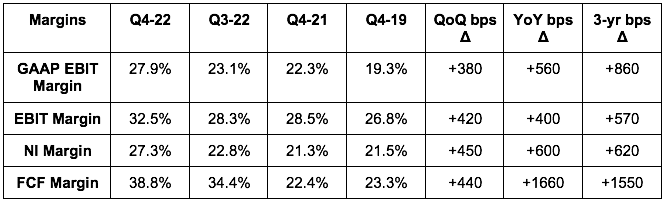
11. Uber (UBER) -- Earnings Snapshot
a. Results vs. Expectations
Beat revenue estimates by 1.2%.
Beat its gross bookings guide by 0.7%.
Beat adjusted EBITDA estimates by 6.6% & beat its guide by 8.1%.
Beat EBIT estimates by 14.8%.
Beat ($0.16) earnings per share (EPS) estimates by $0.45. While this is a strong result, all of Uber’s net income was from mark to market equity investment gains. This is why GAAP EBIT margin is still negative (although rapidly improving).
b. Forward Guide
Uber’s adjusted EBITDA guide for Q1 2023 beat estimates by a whopping 12.8%. It also guided to $31.5 billion in gross bookings.
“Our global scale and unique platform advantages position us well to accelerate this momentum into 2023.” -- CEO Dara Khosrowshahi
c. Balance Sheet Data
$4.3 billion in unrestricted cash, equivalents & short-term investments vs. $4.21B YoY.
$9.27B in long term debt.
Basic share count grew 3% YoY; diluted share count grew 2.7% YoY.
Stock comp was 5.6% of revenue in 2022 vs. 6.7% YoY.
d. Call & Release Highlights
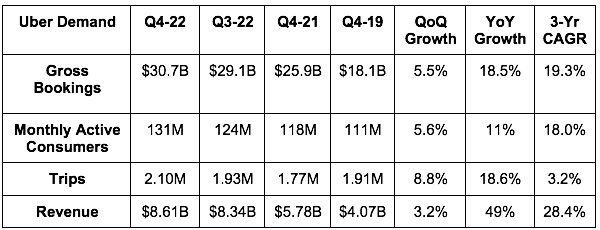
Demand Context:
FX continues to be a thorn in Uber’s side. It was a 700 bps gross bookings growth headwind and a 1000 bps revenue growth headwind. Thankfully for the company, the headwind is expected to roughly halve next quarter.
The 19.3% 3-yr revenue CAGR compares to 29.8% last Q & 36.6% 2 Qs ago as Uber distances itself from the reopening tailwind.
Mobility demand continued to accelerate into Q1 while “delivery remained resilient.”
Engagement improved from 5.4 trips per monthly active platform consumer vs. 5.0 YoY.
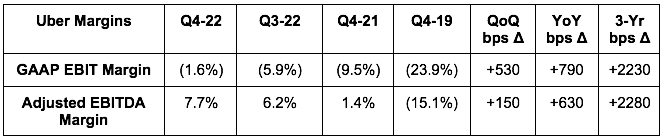
Margin Context:
Uber expects to turn GAAP EBIT positive this year as OpEx continues to fall while its revenues continue to grow at a healthy double digit clip. This combination is expected to continue.
Uber calculates its EBITDA margin as a % of gross bookings. Others use a % of revenue. To stay consistent, I calculated the numbers as a % of revenue.
Mobility adjusted EBITDA margin was 24.4% vs. 25.2% YoY. Mobility take rate rose to 27.8% from 20.1% YoY.
Delivery adjusted EBITDA margin was 8.2% vs. 1.0% YoY. Delivery take rate rose to 20.5% vs. 18% YoY.
Freight adjusted EBITDA margin was (37.7%) vs. (45.2%) YoY.
Uber generated $1.12B in free cash flow in 2022 ex-tax settlement charges vs. ($743M) YoY. It generated positive $390 million including these charges.
Uber’s incremental EBITDA as a percent of gross bookings (not revenue) was 10% for 2022 vs. its guide of 7%+.
On New Products:
New mobility products (like pre-bookings, upfront fares with Reserve or car rentals) are making “solid progress.” As of now, these new products are 10% of total mobility bookings and doubling YoY.
On things like Upfront Fares specifically, the product launch has raised completed trip rates by 4% in the U.S. test markets with a 23% drop in unfulfilled trips in UK test markets.
Uber One membership doubled YoY to 12 million members and account for 25% of Uber’s gross bookings in total. These members deliver average consumer savings of $27 per month while leading to 15% better retention and a 4X revenue per user contribution for Uber.
The ads business reached $500 million in annual revenue as planned. It’s on pace to eclipse $1 billion by 2024.
On Competition:
Uber thinks its investments in improving the driver experience since 2020 have “clearly separated itself from the competitors on driver preference.”
Its market share in the U.S. is close to a 6-year high.
On Macro:
Khosrowshahi spoke on macro headwinds actually being a net positive for Uber in 2023. Why? Because it was early to cost rationalization in 2021 and now boasts margins far healthier than its competition. Uber is now seeing those competitors make the same cost rationalization moves it has already concluded which puts it in a better position to take more share considering the more rational environment for competition.
While Uber didn’t exist during the Great Financial Crisis, Khosrowshahi pointed to U.S Government data from the period showing just how resilient mobility was throughout the economic turmoil.
On Delivery:
Tech investments led to falling cost per trip here with $500 million in annual delivery OpEx savings.
40% of delivery bookings are now from Uber One Members (its loyalty program).
It took market share of delivery during the quarter while margins improved.
As it lapped Omicron comps in January 2023, delivery trips continued to grow with that expected to accelerate through the rest of the quarter as comps ease.
On Freight:
Weak demand led to missing top & bottom-line expectations for Q4.
Muted trends continued into Q1. This led to it laying off 150 people to lower freight’s cost base.
The acquired Transplace team has been fully integrated into Uber Freight.
e. Hello Watch List
This is the second straight quarter from Uber that I’ve found deeply impressing. New leadership is turning the margin profile around and taking share all while implementing a more calculated, rational approach to product expansion. At 35X forward earnings with 60% earnings growth compounding, 70% free cash flow compounding and 15%+ revenue compounding expected through 2025, I’m ready to dig into this name. Any and all bear cases are welcome. Feel free to comment any concerns about the investment case that you may have.
12. Walt Disney Company (DIS) -- Earnings Snapshot
a. Results vs. Expectations
Beat revenue estimates by 0.8%.
Beat EBIT estimates by 14.7%.
Beat EPS estimates of $.79 by $0.20.
Missed FCF estimates of $277M by roughly $2.4B.
Disney+ Subscribers of 161.8M missed estimates by 1.4%. Disney guided to adding subscribers QoQ. It did not.
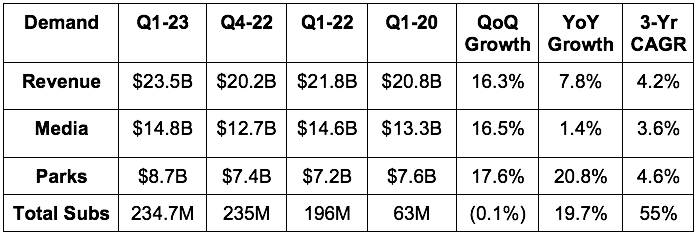
b. Guidance
Disney’s 2023 guide of high single digit revenue and EBIT growth roughly met estimates of 9% for both metrics. The company reiterated that Disney+ will be profitable during fiscal year 2024. The Direct to Consumer (DTC) EBIT margin improving from (30.6%) to (19.8%) QoQ is a strong start.
c. Balance Sheet
$8.5B in cash & equivalents.
$3.1B in investments.
$45B in borrowings.
CEO Bob Iger will ask the board to reinstate Disney’s dividend this year.
Disney will fire 7,000 employees to cut costs.
d. Call & Earnings Release Highlights:
The theme of this call was similar to what we’ve heard from other bellwethers this quarter. Macro is getting tougher, the consumer is weaker than it was last year, and the short-term picture looks “uncertain.” And like other bellwethers, it talked up the long-term value of Disney’s content, parks and branding and how it will emerge stronger out of this downturn. Linear operating income continues to fall, subscriber operating income continues to push towards breakeven, and parks continue to thrive as we move away from pandemic times. You could have copy and pasted this transcript, changed a few of the words around and used it for countless other large cap firms.
Disney also announced plans to cut roughly $5 billion in costs through the aforementioned layoffs and other OpEx trimming.
13. Cloudflare (NET) -- Earnings Snapshot
a. Results vs. Expectations:
Beat revenue estimates & its guide by 0.2%.
Beat EBIT estimates by 28.2% & beat its guide by 34%.
Slightly beat EPS estimates & its guide; Met GAAP EPS estimates.
Beat FCF estimates by 66.8%.
Missed GPM estimates by 90 bps.
b. Forward Guide vs. Expectations
Q1:
Missed revenue estimates by 0.2%
Beat EBIT estimates by 23.7%.
2023:
Beat revenue estimates by 5%.
Beat EBIT estimates by 12.4%.
Both Q1 & 2023 EPS estimates met expectations.
“Positive Free cash Flow” is expected for 2023.
c. Balance Sheet
Stock comp = 22.7% of sales vs. 22% QoQ & 22% YoY. This must start to fall like it is for virtually all other high growth software names.
FCF - stock comp margin = -10.5% vs. -23.6% YoY & -17.5% YoY.
$1.6B in total cash & equivalents.
$1.4B in convertible notes.
d. Call & Earnings Release Highlights
The call and release featured the same themes discussed in JFrog’s report and most other software names during the quarter. Long term structural tailwinds remain in place while cloud migrations, network security modernization and zero trust proliferation all continue. It signed a record number of $500,000+ deals, grew 2022 sales by a gaudy 49% YoY and sees now as the time to accelerate its distance from the competition. Still, the near-term future looks less rosy as growth is set to slow like for everyone else.
Leadership called the economic slowdown a time to be more disciplined and efficient by leaning out things like sales & marketing expenses. It’s adjusting to macroeconomic conditions and experiencing the same sales cycle elongation and data usage optimization impacting software in aggregate. I will say that while the themes are consistent with the rest of software, its 5% top line guidance raise for 2023 was a notable standout among its peer group.
14. Google (GOOGL) & Microsoft (MSFT) -- Bing is Back?
Microsoft this week released the widely expected ChatGPT integration into the Bing search engine. Satya Nadella used the release to take aim at Google. He seemed to view them as complacent monopolists who have failed to innovate as quickly as need be. He spoke on how energized he was to try to win back the hearts and minds of searchers and called Google’s margins Microsoft's opportunity. Compounding the negative sentiment of this development, Google’s new conversation AI bot -- “Bard” -- answered a question incorrectly as part of its demonstration.
I think it’s unrealistic to think Google will lose control of market share to Microsoft. But as a daily user of ChatGPT, I can fully see how Bing could take a few hundred basis points of share away from Google. Considering how reliant Alphabet is on Google to power its profit growth, this could be a pain in the neck even while Google maintains most of its share.
Beyond that, it’s silly to think Google can’t compete here. It has thousands of the most talented software engineers in the world at its disposal and its decades-long strangle-hold on the space offers it exponentially more training data to season new conversational algorithms than anyone else. And it’s not like ChatGPT doesn’t constantly answer things incorrectly as well. Both ChatGPT and Bard have a long way to go.
So? I actually view this as a somewhat compelling opportunity. Alphabet’s 2023 PEG ratio is racing down to 1.0 while it still dominates search and is seeing its cloud profits rapidly move to breakeven. There are so many parallels between this batch of news and the Meta/TikTok competition we’ve seen play out since 2020. The new competitor is always sexier and flashier by virtue of being newer, higher growth and less understood. But the mega-cap incumbent is frequently more capable of fending off new entrants than most give them credit for. If this share price reaction becomes much more dramatic, I may have to finally start a position in this behemoth. TBD.
15. Macro
a. Key Data from the Week
It was a quiet data week in macro-land as we gear up for the CPI release next week.
CPI December estimates were revised from -0.1% month over month to +0.1%.
3 and 10 year note auctions closed at yields slightly higher than the previous auctions.
Initial jobless claims of 196,000 came in above 190,000 estimates.
Michigan Consumer Expectations came in at 62.3 vs. 62.9 expected and 62.7 last month.
Michigan Consumer Sentiment came in at 66.4 vs. 65 expected and 64.9 last month.
High Yield Option Adjusted Corporate Credit Spreads rose slightly this week:
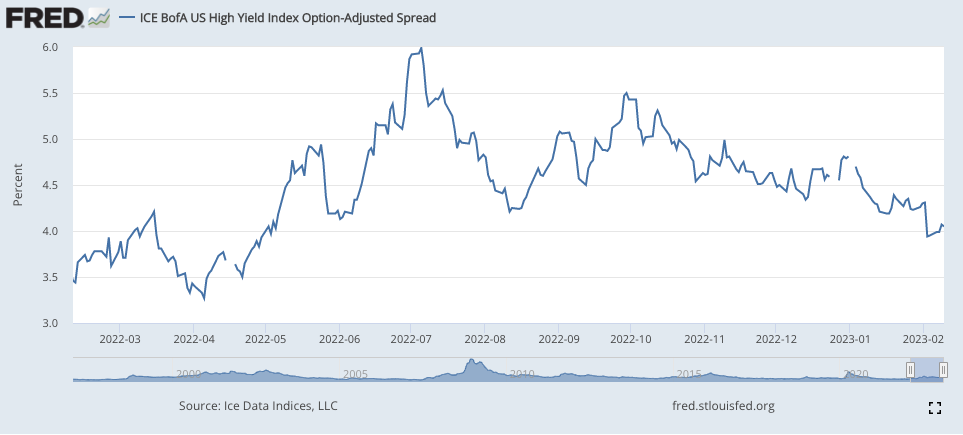
5-year Breakeven Inflation Unfortunately Continues to Rise Once More:
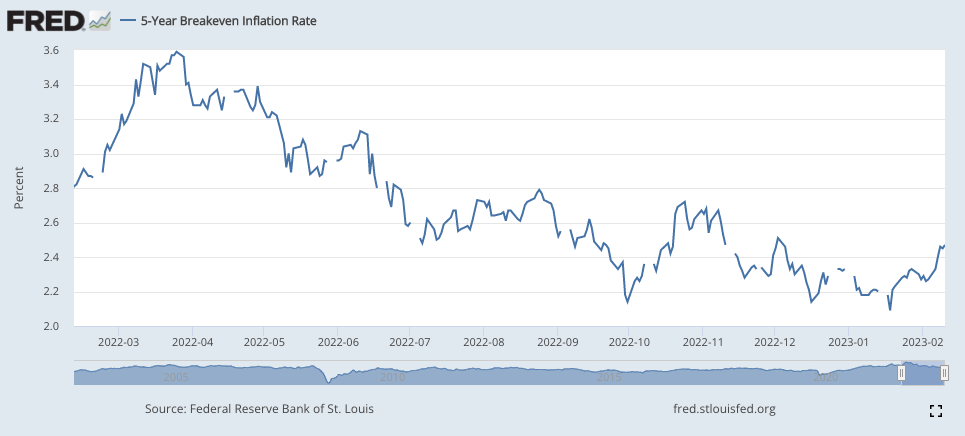
b. Level-Setting the Data
Next week’s CPI will be interesting. China reopening could mitigate the downward trend we’ve recently seen and -- as stated above -- estimates were revised higher this week. I’m more nervous for and less confident in this CPI report than I have been since October.
Still, that trend of inflation has been convincingly lower over the last several months while economic resilience has been pleasantly surprising to me. This leaves the elusive soft landing scenario on the table, and makes a mild recession far more likely than a deep recession. I still expect a 1H 2023 pause as employment becomes a more fragile mandate than inflation. I’m still roughly 95% invested. Nothing changed from last week although a few hot inflation readings this month could alter my point of view. We’ll see what happens.
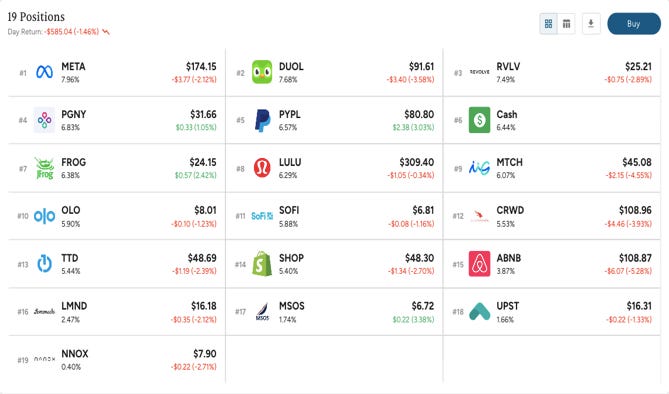
16. My Activity
I sold about 6% of my position in Meta this past week. The company had rallied over 100% off of the lows (where I was accumulating) and I wanted to take some easy profits off of the table. I did not make any other moves.
Thanks for covering PYPL.. A very detailed and informative report and analysis as always!!
“ I have never been more tempted to add a put hedge heading into the report. I ultimately decided against it as it breaks my rules and deviates from my process.” What is the rule/process? No options? No hedges? Inquiring minds...