News of the Week (July 17 - 21)
News of the Week (July 17 - 21)
Meta; Uber; Microsoft; Shopify; Taiwan Semi; Bank of America; American Express; Intuitive Surgical; Market Headlines; Macro; Portfolio

Welcome to the hundreds of new subscribers who have joined us this week. We’re delighted to have you and determined to provide as much value as possible. Please feel free to share this far & wide to help us grow.
1. Meta Platforms (META) -- History Rhymes & Regulation
a) History Rhymes
Meta Platforms announced this week that it will open source its newest LLAMA-2 generative AI model. Here, we’ll explore how Meta’s AI approach mimics the philosophy it effectively uses elsewhere, how this could work here and why we’re a fan of the strategy.
Brief Look at Meta’s History
When Meta was first created as Facebook in 2004, Zuck was famously quoted as saying “how can we charge for this if we don’t even know what it is yet.” At the time, Facebook was storming onto the scene at Harvard College but still in the early stages of eventual ubiquity. Facebook was built into a central social media player long before it blossomed into a free cash flow machine. And that’s the typical pattern for its products. Its priority at the beginning has always been focused away from monetization and avoiding a friction-fostering paywall. One could argue that this helped facilitate half of the planet joining its apps.
History Rhymes
Today, Meta takes a strikingly similar approach to monetizing its properties. Several years into WhatsApp being a clear success, it’s just now starting to turn on revenue streams. From a Metaverse perspective, the company views itself as democratizing the hardware. It’s selling Quest units at a large EBIT loss to build rapid share. This rapid share should attract the hearts and attention of talented developers to build apps for Quest. Those apps should feed more engagement and power a compelling feedback loop. But this feedback loop would not be nearly as powerful if Meta were taking Apple’s approach to selling its headsets at high prices and high margins. Apple has that luxury due to its fortress ecosystem which Meta can’t match today.
Now, Meta is practicing the same “market fit before monetize” model in AI as it commercially open sources LLAMA-2. As an important aside, it’s doing so with Microsoft as its preferred infrastructure partner, but LLAMA-2 is also live on AWS (Amazon) with powerful templates to jump-start developer productivity.
The opening of Meta’s model to users like Zoom will mean developers have free access to some of the most cutting-edge algorithms in the world. There are very few companies with the deep pockets, brain-power and will to build world-class foundational models. Meta is one of them and it is opening the floodgates for 3rd party customizing. Meta’s aim here, like for social media and VR, is to commoditize the space. Its open approach will make it more difficult to compete with Meta. It will also make moat creation within generative AI models somewhat unfeasible if models are a dime a dozen and easily accessible.
What’s the Thinking on Making it Open-Source?
Meta doesn’t presently care about profiting directly from its AI models. It has positioned its enterprise so that it can commoditize pieces of sectors to steal dominant share and to monetize elsewhere. It offers its social media apps for free and monetizes with ads and professional tools. It offers Quest hardware at cost and will eventually look to monetize with its app store, game passes etc. And now, it will offer its proprietary models to whomever wants to build on top of them. For now, it solely wants more market share and a higher probability of being a central player in this new wave. Over time, there are a few compelling ways in which it will likely monetize within the world of AI. Whether that’s chatbots, better content discovery to grow engagement, or something else is less important than if Meta becomes a key player to begin with.
Just like in 2004, how can Meta monetize AI models if it doesn’t even know how those models will be used? It can’t, so it won’t.
LLAMA-2 vs. Chat GPT 3.5 According to an Expert
Jim Fan, a senior researcher at Nvidia, took to social media to explain how he sees LLAMA-2 stacking up to OpenAI’s newest model. According to him, debuting a “commercially-friendly license” should be enough to convince developers to build with Meta. The model is better than other competing products like Falcon and Vicuna, but not yet on par with Chat GPT’s latest and greatest product due to “weak coding abilities.” He sees this gap soon closing and praised Meta for “going above and beyond” on AI safety issues. That’s good to hear following years of data privacy protection complaints levied against the firm. Finally, he called the LLAMA-2 white-paper a “masterpiece” and sees it “dramatically boosting multimodal AI and robotics research.” Jim is a very bright person. Check him out on Twitter @DrJimFan
b) Regulation
The Norwegian Privacy Authority (called Datatilsynet) is cracking down on Meta’s personalized ads. For three months starting in August, Meta will have to pause its practice of using personal data to match “behavioral” ads more granularly. The regulatory body’s main complaint centers on Meta supposedly using location data to target without prior consent. This, to Datatilsynet, is in direct violation of Europe’s General Data Protection Regulation (GDPR) regardless of whether Meta is solely using 1st party data or not. This strict ruling will be appealed by Meta. Regulatory drama is nothing new for the firm. It will have to figure out a work-around to this type of targeting in Norway if the appeal falls through and may have to do so in other parts of Europe if member states follow suit. An annoying headwind, but one that Meta is much better equipped to deal with than smaller competition (assuming this law isn’t solely targeted at it).
c) Bank of America
Bank of America, based on channel checks, expects Meta to beat expectations when it reports next week.
2. Uber (UBER) -- Thriving, Vroom Delivery & California
a) Thriving
According to Bloomberg, Uber had a comparatively strong June within ride-sharing. Its sales rose 8% Y/Y with Lyft’s sales falling 6% Y/Y over the same period. It continues to grow its market share lead and distance itself as the number one player in this all-important market. Conceding this dynamic, Lyft’s CEO in an interview this week said “it doesn’t stink being number 2.” I’m glad he thinks so. Specifically, Uber’s share grew from 72% to 74% Y/Y for the month. Better margins, deeper pockets, a broader product suite, leading driver supply and a subscription boasting unmatched consumer value has been a wonderful recipe for domination. Delicious.
b) Vroom Delivery
Uber announced a new partnership with Vroom Delivery (not Vroom) this past week. Vroom delivery is an e-commerce convenience store software vendor; it provides things like delivery organization, inventory management and a bevy of back-end software tools. Those tools will now integrate into Uber’s platform.
As part of the arrangement, Vroom customers will be able to field UberEats demand while routing all of that new business through the same, singular tablet they use for all other channels. They’ll be able to use Uber’s industry-leading driver network as well. Additionally, Vroom’s customer base will be encouraged to sign up for Uber Direct (Uber’s B2B private label delivery fulfillment platform) to legally offer things like tobacco and alcohol in the USA. Interestingly, Uber Eats merchants will gain access to Vroom’s menu management tool to automate listings and hiding of out-of-stock items to grow average order value and shrink abandoned carts.
The two firms have large convenience store client overlap with mutual customers showing “strong interest” as they open up pre-registrations. Vroom sees this lowering its own costs and juicing its ability to scale, but what does Uber get aside from the important menu management upgrade?
Uber has 3 key stakeholders in its gigantic marketplace: Consumers, drivers and merchants. The firm has spent the last several quarters debuting new products to build consumer loyalty and utility. It has also catered to drivers with product launches like intelligent ride stacking and walking ETAs to juice fulfillment capacity and minimize time lost. This partnership improves Uber’s ability to support the third side of its ecosystem, the merchants. It makes Uber a better order and delivery management partner for convenience stores while allowing it to aggressively sell Uber Direct to Vroom’s 3,000 clients. This should be a small contributor to new merchant growth which merely serves to fuel app traffic and grow Uber’s driver supply lead.
c) California
Private Attorneys General Act (PAGA) Definition: A California-based law that enables people to sue employers “on behalf of the state” for violating labor laws. Those suing get to keep 25% of the proceeds if the action is successful.
In 2022, the Supreme Court sided with Viking River Cruises by forcing employees taking PAGA-based actions to have those complaints heard in arbitration. Large employers argue that arbitration is more productive than taking cases to court while those opposed to this structure say it leads to less successful worker outcomes.
This past week, in a contradiction to The Supreme Court, California’s Supreme Court sided with drivers. It decided that these workers had the right to utilize PAGA regardless of signed employment agreements and despite the agreement requiring arbitration. It ruled that workers had the right to take PAGA-based claims to trial. As part of this decision, Uber will have to participate in a lawsuit on its lack of work expense coverage for an independent contractor and will be open to more litigation in the state. Uber says the ruling “undermines The Supreme Court and violates the Federal Arbitration Act.” We agree, but our opinion unfortunately doesn’t matter here. It’s easy to see how this will end up back at the U.S. Supreme Court with its previous ruling and the USA’s constitutional Supremacy Clause leading to this decision being thrown out.
But what if it isn’t? While this will be a pain in the neck for Uber, it will be arguably a bigger problem for all of its competition. Uber has deeper pockets, a deeper compliance bench, a healthy margin profile and arguably better regulatory relationships. Newly required compliance measures are always easier to deal with for richer, less fragile companies. It would be a negative for all players in ride-sharing and food delivery, but perhaps a net positive for Uber given its ideal competitive positioning. Lyft’s and DoorDash’s pain is Uber’s gain.
3. Microsoft (MSFT) -- Microsoft 365 Copilot
Microsoft Copilot is a virtual assistant to automate tasks like code writing, emails and more. It’s powered, unsurprisingly, by proprietary Microsoft AI. Compared to other key AI model players, Microsoft was reportedly gearing up to take a more direct approach to monetization. Well? This week, it announced Microsoft 365 Copilot as a $30 per month subscription up-sell.
Microsoft 365 has well over 300 million seats/subscribers. For every 1% of this base that the firm can successfully upsell, it enjoys about $1.1 billion in added revenue. Just converting 10% of the base, which many feel is overly conservative, would translate into a high margin 5% boost to its 2023 revenue. This could become material to overall results very quickly which is likely why the stock responded so positively. And in an economy where everyone wants to do more with less and minimize costs, automating once cumbersome tasks like code creation is a great way to do just that.
4. Shopify (SHOP) -- Bullish Channel Checks
Deutsche Bank sees Shopify’s EBIT margins approaching 8.5% this quarter. This is well ahead of consensus estimates calling for 3.8% margins while it also sees revenue materially beating estimates as well. The institution expects new leadership to frame the conversation more around cost controls and margin expansion going forward. In a post fulfillment world with its labor force now significantly trimmed, margins could explode higher.
Additionally, RBC Capital Markets released research pointing to 58% Q/Q growth in Shopify Plus sites. This would mark a material acceleration from 53% Q/Q growth last period. It maintained an overweight rating and a $75 price target. Finally, Sensor Tower data shows a point of sale app MAU growth accelerations from 41% Y/Y last quarter to 46% Y/Y this quarter.
This level of outperformance is required for Shopify to continue racing higher. Its forward multiples are frankly somewhat ridiculous right now which is why I sold 25% of the position earlier in the month. Special company, VERY expensive stock. Those multiples become far more reasonable if its margin trajectory and revenue compounding combination looks as strong as these firms think it will. Shopify needs an Nvidia-type quarter to avoid digesting explosive 2023 gains in our view. Deutsche Bank sees an Nvidia-type quarter coming. We still see this taking a breather after strong results this quarter, but these updates make us less certain. This is why I trim stocks with too much multiple expansion near-team rather than exiting and trying to time a re-entry.
5. Taiwan Semiconductor (TSM) -- Q2 2023 Earnings Summary
a) Results vs. Expectations
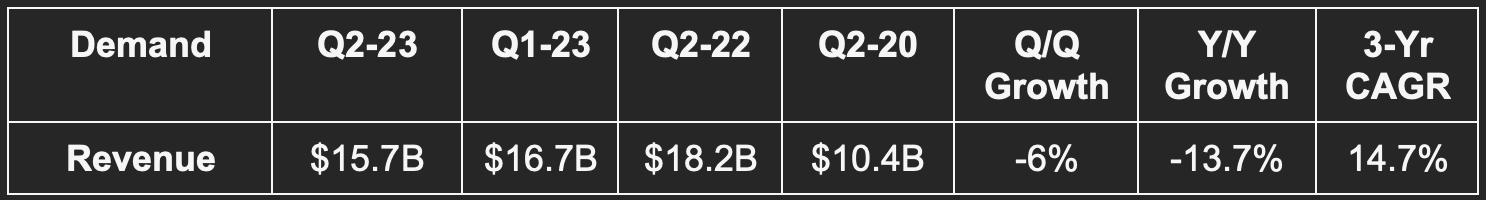
Beat revenue estimate by 1.9% & beat guide by 0.6%.
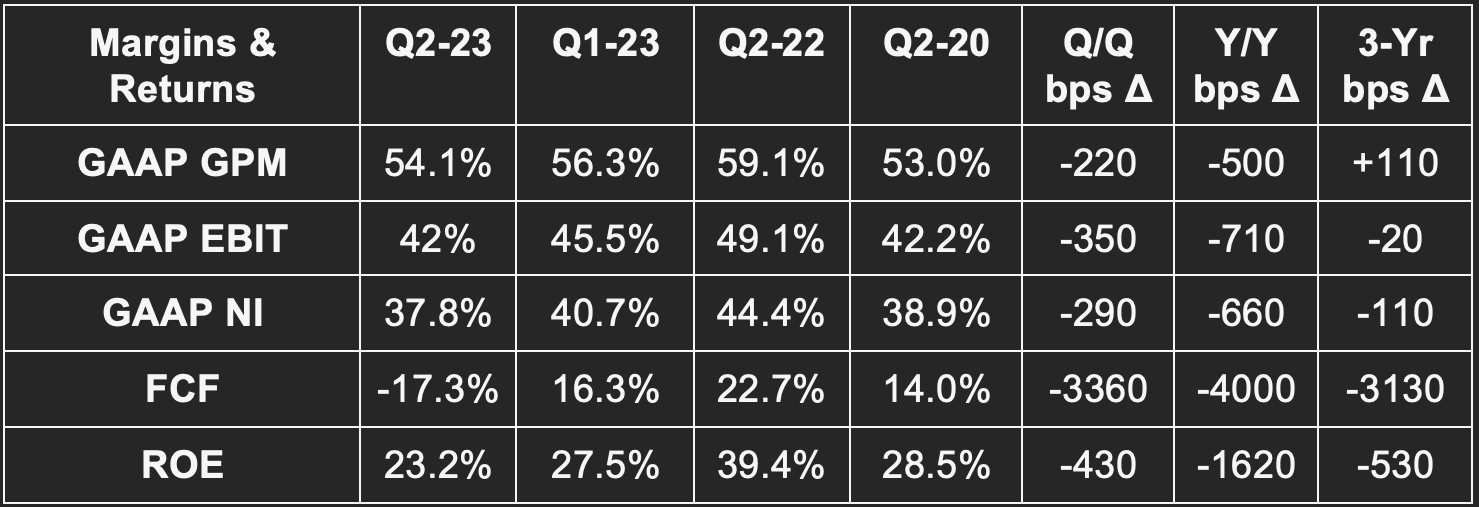
Beat gross margin (GPM) estimate by 90 bps & beat guide by 110 bps.
Beat EBIT estimate by 3.9% & beat guide by 4.1%.
Beat $0.22 GAAP EPS estimate by $0.01.
b) Forward Guidance
Guidance for next quarter was light across the board. It missed on revenue by a modest 0.6%, missed on 53.5% GAAP GPM estimates by 100 bps and missed forward EBIT estimates by 6.7%.
It sees overall revenue for 2023 falling 10% Y/Y vs. expectations of -5.4% revenue growth. Looking ahead, it is on track to compound revenue between 15%-20% over the “next several years.” This was a reiteration of its 2022 investor conference guidance.
c) Balance Sheet
$41 billion in cash & equivalents.
$29 billion in long dated bonds.
Inventory rose 7.8% Y/Y and was roughly flat Q/Q. It continues to control inventory as its clients rightsize their own inventory and needs.
Share count is stable Q/Q and Y/Y.
Dividend payments will be hiked 9% for next quarter. Dividend payments will grow by AT LEAST 6.7% in 2024 vs. 2023 as well.
d) Presentation & Call Highlights
Demand Context:
Nm (per Bard) = nanometer and describes the semiconductor manufacturing process utilized. Smaller Nm is considered more advanced as it frees smaller & more cost-efficient transistors for chip creation. This means better performance.
7nm tech = 23% of wafer revenue vs. 20% Q/Q & 30% Y/Y
5nm tech = 30% of wafer revenue vs. 31% Q/Q & 21% Y/Y.
Advanced technology (below 7nm) = 53% of total wafer revenue.
Smartphone = 33% of revenue vs. 34% Q/Q & 38% Y/Y.
High Performance Computing (HPC) = 44% of revenue vs. 44% Q/Q & 43% Y/Y.
Macro:
Demand was hit by “overall global economic conditions.” It sees 3nm demand ramping and AI-based processes building steam as well into the second half of 2023. That, however, is not enough to offset general sector weakness. Today, AI processor revenue is 6% of its total business and should grow to 13%-14% of it through 2028.
Macro was the source of TSM’s sharp gross margin contraction. Lower capacity utilization, headwinds from building out its 3nm technology (which will hit margins throughout 2023) and utility inflation in Taiwan all hurt this margin line. Still, it remains highly confident in long term gross margin of 53% or better with return on equity of 25% or better. Just tough times today.
Market Outlook:
TSM continues to see the market overall (ex-memory) falling by a mid-single digit percent this year.
Arizona:
TSM delayed the timeline for finishing its Arizona factory. It now sees the project wrapping up by 2025 due to a shortage of skilled labor access. Not something we’re used to hearing in the U.S.
6. Bank of America (BAC) -- Q2 2023 Earnings Summary
a) Demand
Bank of America beat revenue estimates of $24.9 billion by 1.2%

b) Margins, Returns & Capital Ratios
Beat $0.83 GAAP EPS estimates by $0.05.
Missed $32.20 book value per share estimates by $0.15.
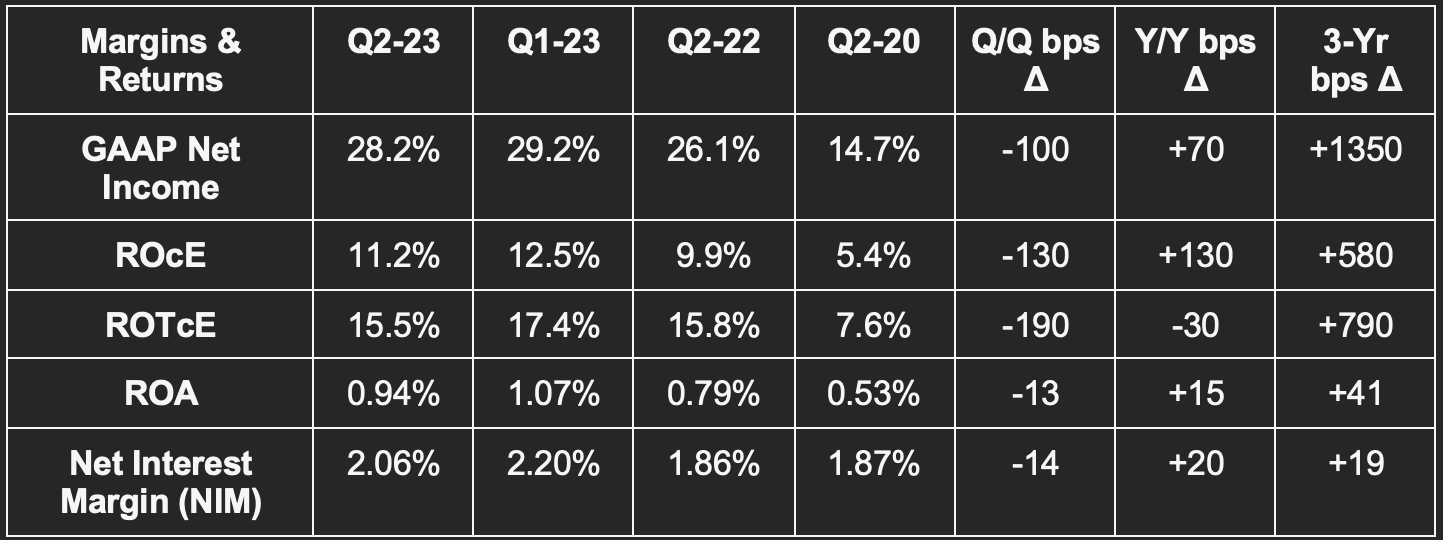
Beat 10.7% return on common equity (ROcE) estimates by 50 basis points (bps)
Beat 0.93% return on asset (ROA) estimates by a basis point.
c) Results Context
Liquidity & Assets:
Returned $2.3 billion to shareholders which is roughly flat Y/Y. It plans to raise its dividend payment by 9% next quarter (pending board approval).
Share count shrank by 1.1% Y/Y via buybacks.
$374 billion in cash & equivalents vs. $198 billion Y/Y.
Loan and lease balances rose 3% Y/Y to $1 trillion. This was driven by higher consumer card balances and commercial loan growth.
Deposits fell 7% Y/Y to $1.9 trillion.
$867 billion in global liquidity vs. $984 billion Y/Y.
$286 billion in long term debt vs. $276 billion Y/Y
Firm-Wide Results:
Credit loss provisions rose from $500 million to $1.1 billion Y/Y. As you’d expect, all of these provisions came within the consumer banking segment. This served as a net income comp headwind. Net charge-offs rose, but remained comfortably below pre-pandemic levels. Net charge-off ratio was 0.33% vs. 0.23% Y/Y while non-performing loans and leases ratio actually improved from 0.41% to 0.39% Y/Y.
Total net income rose 19% Y/Y as net interest income rose 14% Y/Y thanks to higher rates and loan growth.
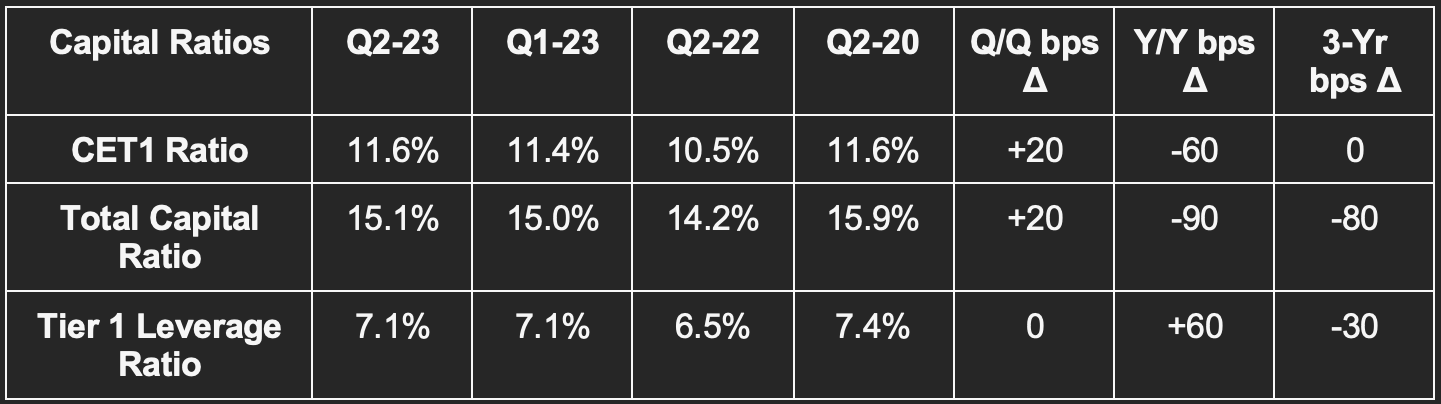
Its CET1 ratio is 120 basis points over regulatory minimums.
Return on invested capital by segment:
27% for consumer banking; 21% for global wealth and investment management; 22% for global banking; 10% for global markets
“We continue to see a healthy U.S. economy that is growing at a slower pace, with a resilient job market… we saw improved market shares particularly in Sales, Trading and Investment Banking businesses.” -- CEO Brian Moynihan
“Asset quality and the overall health of the U.S. consumer remained strong. Total loss rates are below pre-pandemic levels.” -- CFO Alastair Borthwick
Consumer Banking:
Despots fell 7% Y/Y but are 40% over pre-pandemic levels.
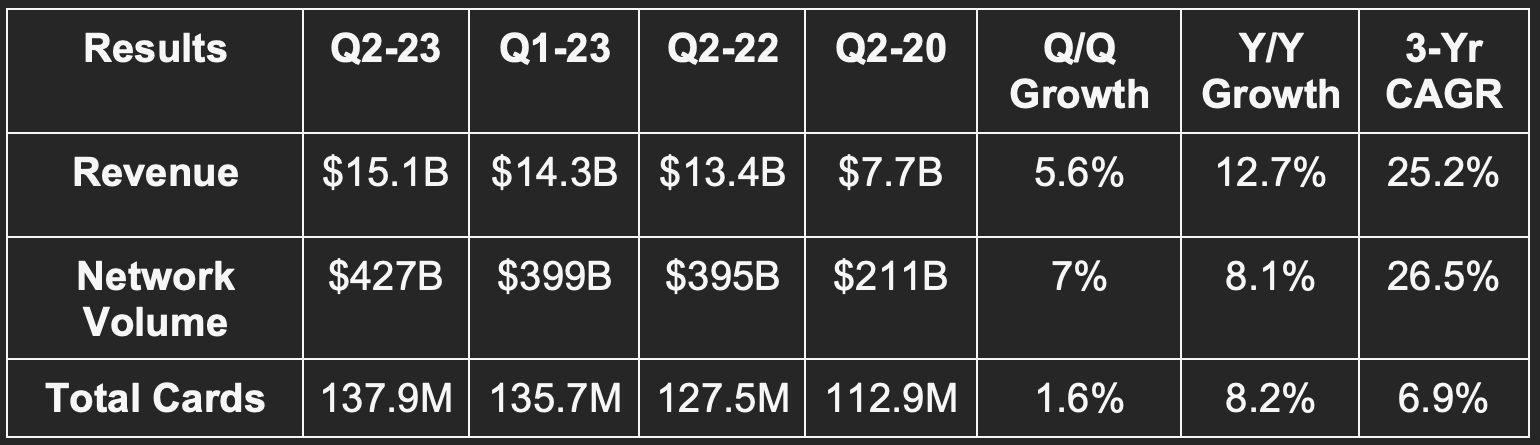
Card spend rose 3% Y/Y.
Small business checking accounts rose 4% Y/Y to 3.8 million.
51% of consumer banking revenue was digital vs. 51% Q/Q while Zelle active users rose 27% Y/Y and its active digital banking users rose 7% Y/Y.
Erica (digital banking assistant) has 18.2 million users vs. 14.4 million Y/Y while household digital adoption rose to 74% vs. 72% Y/Y.
It remained #1 for retail deposits and SMB lending.
Global Wealth & Investment Management + Global Banking Segments:
Client assets rose 8% Y/Y to $3.6 trillion.
Deposits fell from $364 million to $295 million Y/Y.
Number 2 market share for investment banking fees (behind JP Morgan) with global IB fees flat Y/Y at $700 million.
7. American Express (AXP) -- Earnings Review
a) Results vs. Expectations
Missed revenue estimate by 2%.
Missed EBT estimate by .6%.
Beat $2.81 GAAP EPS estimate by $.08. EPS rose 12% Y/Y.
Beat 32.5% ROE estimate by 50 bps.

b) Forward Guidance
Reiterated 16% 2023 revenue growth which beat 15.8% growth consensus.
Reiterated $11.20 in 2023 GAAP EPS which beat $11 consensus.
Reiterated long term outlook of 10%+ revenue growth and mid-teens EPS growth.
c) Balance Sheet
$43 billion in cash & equivalents.
Common Equity Tier 1 (CET1) ratio of 10.6% vs. 10.6% Q/Q & 10.3% Y/Y (~10.5% target).
$47 billion in debt.
$123 billion in deposits grew 28% Y/Y which was helped by acquiring Kabbage.
Returned $1.6 billion to shareholders vs. $1 billion Y/Y and grew dividend outlays by 15.3% Y/Y.
$179.2B in loans & card receivables up 8% Y/Y vs. $155.5B.
d) Presentation & Call Notes
Credit Quality:
$1.2 billion credit loss provisions vs. $410 million Y/Y.
Card loans over 30 days past due rate was 1.1% vs. 0.7% Y/Y and 1.5% in the most recent pre-pandemic period. Card receivables over 30 days past due rate was 1.1% vs. 0.7% and comfortably below 2019 levels.
Net charge-off rate was 1.8% vs. 0.8% Y/Y, but again below the most recent pre-pandemic rate of 2.2%.
Demand Context:
FX neutral revenue growth was 13% Y/Y.
New cards added of 3 million vs. 3.4 million Q/Q and 3.2 million Y/Y.
Net interest income rose 32% Y/Y. Its unique skew to spending based revenue vs. lending-based revenue and its affluent niche are both insulating it from a still chaotic exogenous backdrop.
Announced a ten year extension to its now 50+ year old Hilton partnership.
The international card business reclaimed its status as AmEx’s fastest growth segment following a pandemic reprieve.
Points of Strength & Weakness:
Consumer spend for AmEx was highly resilient with its credit metrics remaining best-in-class via its affluent customer and strict underwriting. This consumer spend strength has encouragingly been most notable for its Millennial and Gen Z cohorts with volume there growing 21% Y/Y. 60% of its new customers were Millennials or Gen Z this quarter.
Travel and entertainment were called out as the two spend category standouts on the call. Specifically, travel bookings reached pre-pandemic highs. It also cited its Resy restaurant booking platform as having a banner quarter. This bodes well for firms like Live Nation, Wynn, Airbnb, Expedia etc.
Conversely, its small and medium business (SMB) segment did weaken materially during the period.
Leadership Change:
As previously announced, CFO Jeff Campbell will retire after ten years as CFO. He will be replaced by the current Deputy CFO at AmEx Christophe Le Caillec.
8. Intuitive Surgical (ISRG) -- Earnings Summary
“Our core business has momentum.” -- CEO Gary S. Guthart
a) Results vs. Expectations
Beat revenue estimate by 1.1%.
Beat EBIT estimate by 5.8%.
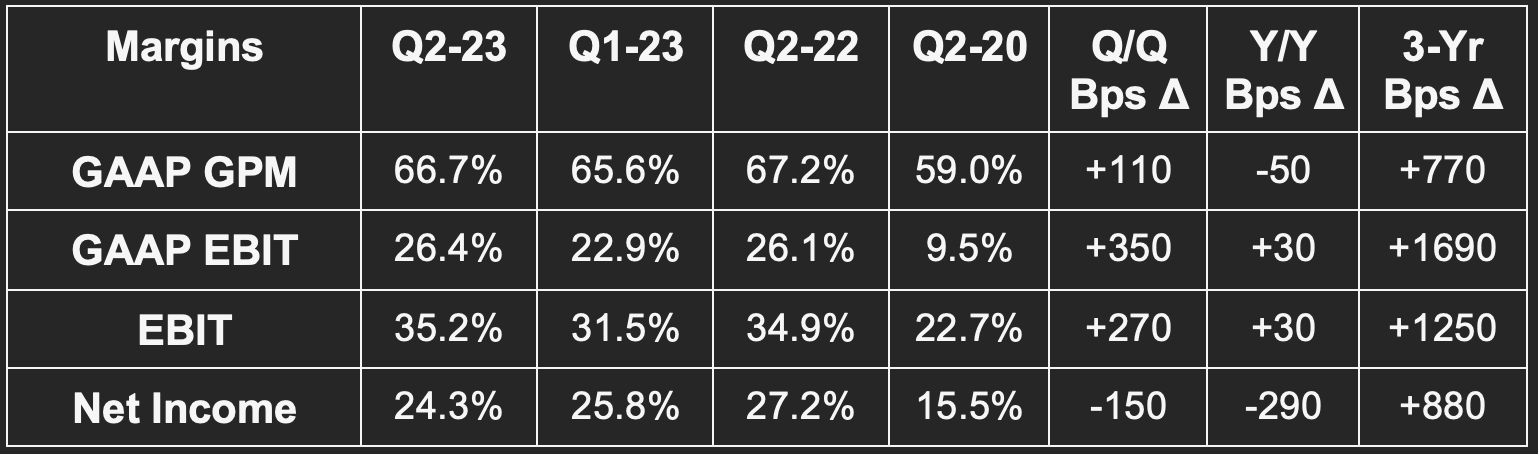
Met non-GAAP GPM estimate.
Beat $1.33 EPS estimate by $.09.
Beat $1.03 GAAP EPS estimate by $.15.
b) Forward Guidance
The company raised its procedure growth guide from 19.5% to 21% Y/Y. It reiterated its non-GAAP gross margin guide of 68.5% vs. 68.7% sell-side consensus.
c) Balance Sheet
$7.1 billion in cash & equivalents.
Inventory rose 12.5% vs. the start of the year.
Basic share count shrank by 2.1% Y/Y while diluted share count shrank by 1.8% Y/Y.
Stock comp dollars rose 16.5% Y/Y to $148 million.
d) Call Highlights
Results Context:
FX neutral revenue growth Y/Y was 17%.
Recurring revenue is 85% of total vs. 72% in 2019.
Da Vinci (its main robotic surgical hardware):
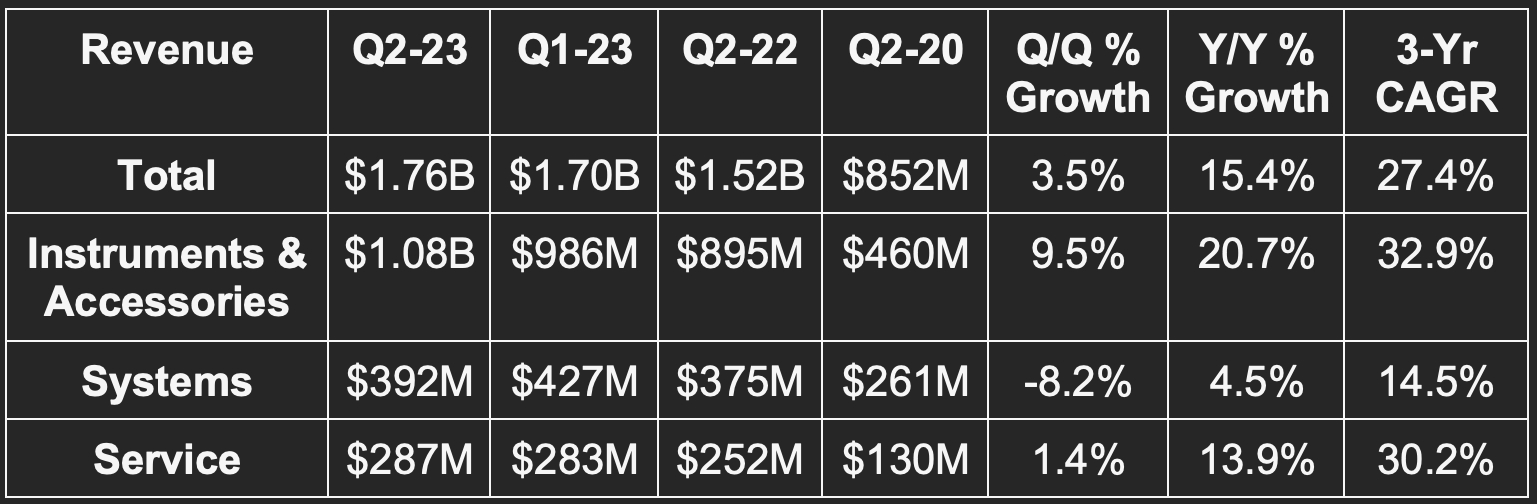
Worldwide procedures rose 22% and at a 4 year CAGR of 17%. In the U.S., growth was helped by the unleashing of pent-up demand for elective care following the end of the pandemic. Overall, it placed 331 da Vinci systems vs. 312 Q/Q & 279 Y/Y (15 were delayed from Q2 to Q3 last year which helps the Y/Y growth comp). The placements were ahead of its internal expectations despite a somewhat cautious spending environment. Of its 8,042 systems in service, 7,900 are multi-port (or multiple incisions) with 142 of them being single port (or a single incision). da Vinci’s overall install base rose 13% Y/Y to 8,042.
Importantly, utilization of systems grew 9% Y/Y and set a new high. This was due to a rising mix of short duration surgery and customers trying to extract more value from existing assets amid a tough backdrop.
In China, it secured an important registration for production in that complex economy. This follows the nation’s re-opening (which is a demand tailwind) and a paper published by China’s National Health Commission concluding that robotic-based surgery boasts superior efficacy and less risk of complications. Local competition in the nation is intensifying, which is leading to pricing pressure there for the units it plans to place over the next 3 years. This is why the average selling price fell Y/Y from $1.47 million to $1.39 million for the firm overall.
Ion (its newer robotic surgical hardware):
Ion procedure growth was explosive at 145% Y/Y. The Ion install base sits at 435 as of this quarter as it placed 59 systems vs. 41 Y/Y. ISRG placed its first Ion system in the U.K. this quarter while debuting a new research program (called CASE insights) to create AI models and tools to “find correlations between surgical technique, patient populations and surgical outcomes.” This won’t materially contribute to its revenue base for the next several quarters.
Mix shift to Ion-based revenue was the entire source of ISRG’s Y/Y gross margin contraction.
Weight Loss Drugs:
Bariatric surgery is an important ISRG revenue contributor. Demand for the sector is starting to be hit by multiple weight loss drugs gaining popularity. It took share here Y/Y, but revenue generation is being held back by growing interest in this alternative weight loss path. As the famous SNL skit brilliantly stated… Want to lose weight? Great. “Eat less and move more!” But we digress.
9. Final Market Headlines:
Apple is unsurprisingly working on its own chat bots for employees to rival OpenAI, Amazon and Meta. This was inevitable.
Google Co-Founder Sergey Brin is back to working multiple days a week in Google offices to help its AI teams.
Google hiked its YouTube Premium plan from $11.99 to $13.99 in the U.S. This incremental revenue will be purely margin.
Mega cap tech names this week all agreed to The Biden Administration’s proposed set of guidelines on how AI models will be tested and implemented. This is the first step towards regulation.
As part of Project Kuiper, Amazon will invest $120 million in a satellite processing plant in Florida to provide internet in space.
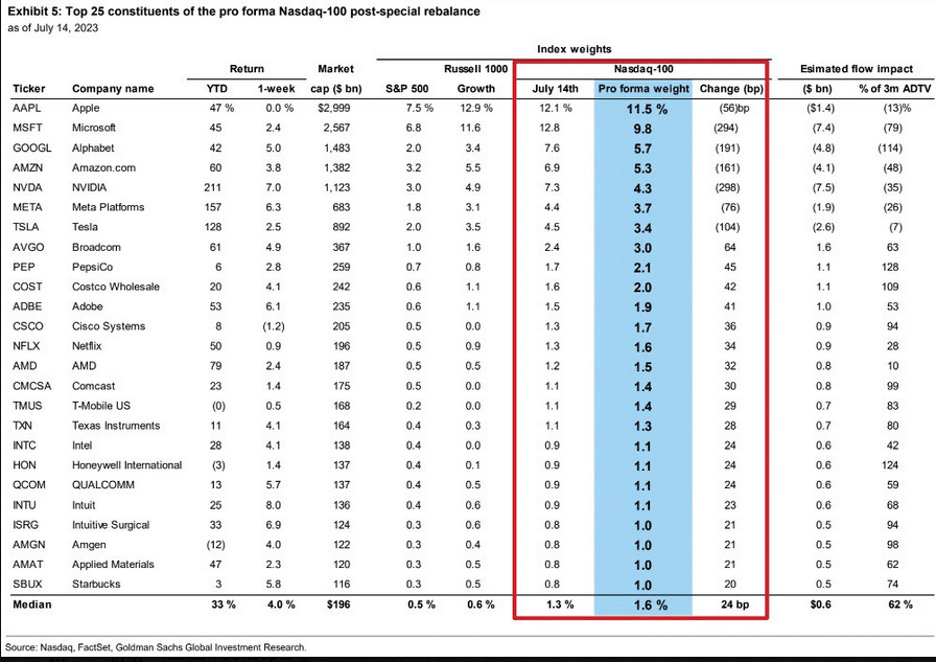
Disney’s troubled ESPN asset is discussing a potential partnership with major sports leagues. Disney is exploring sales of some linear assets as well.
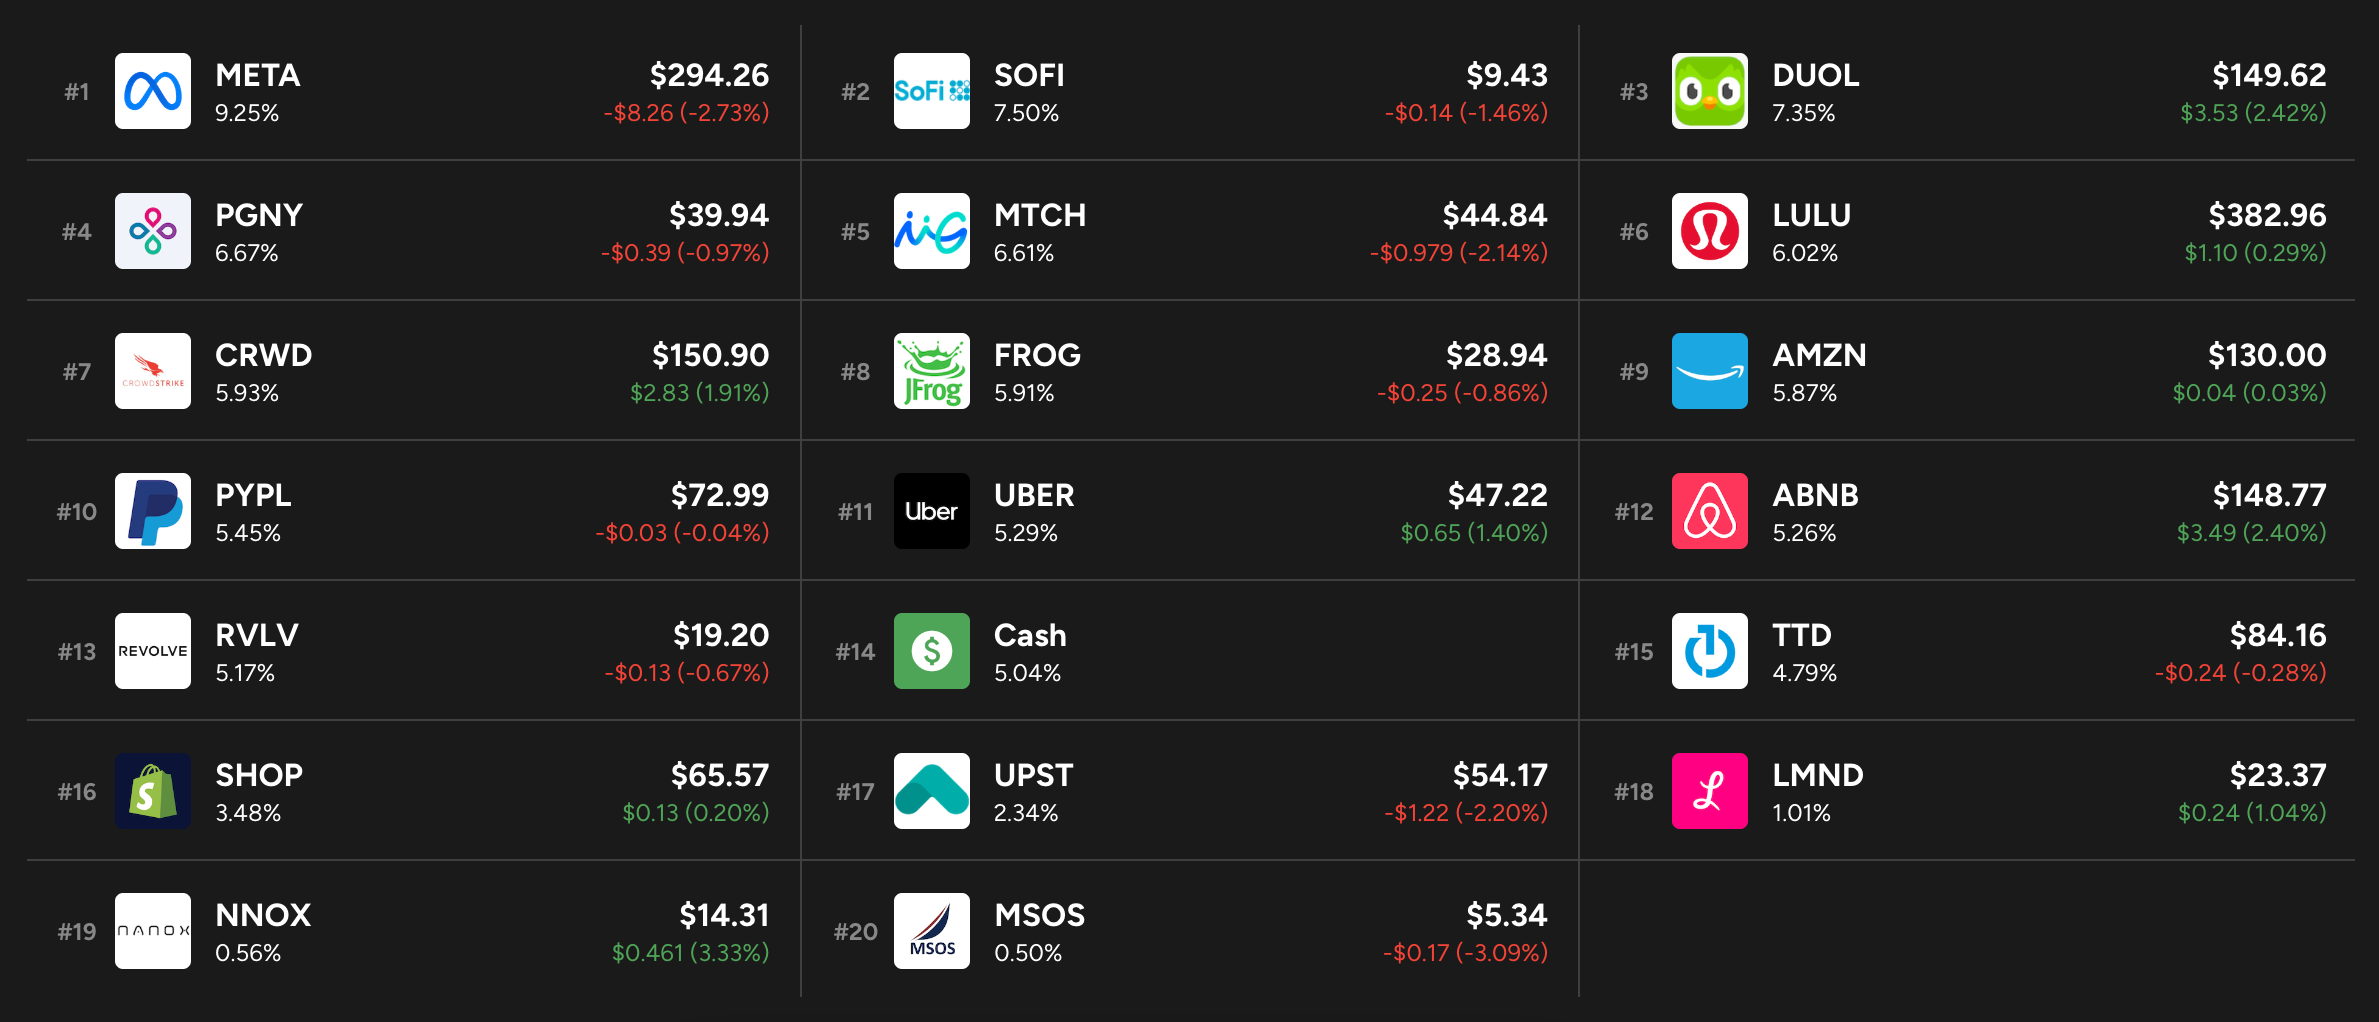
Here’s what the Nasdaq will look like after its rebalance:
10. Macro
Output data:
NY Empire State Manufacturing for July was 1.1 vs. -4.3 expected and 6.6 last month.
Philly Fed Manufacturing Index for July was -13.5 vs. -10 expected and -13.7 last month.
Crude Oil Inventory changes came in at -.708 million barrels vs. -2.44 million barrels expected and 5.946 million barrels in the last report.
Building permits for June of 1.44 million missed 1.49 million estimates.
Industrial Production M/M in June was -0.5% vs. 0% expected and -0.5% last month.
Consumer & Employment data:
Retail Sales M/M in June rose 0.2% vs. 0.5% expected and 0.5% last month.
Core Retail Sales M/M in June rose 0.2% vs. 0.3% expected and 0.3% last month.
228,000 initial jobless claims vs. 242,000 expected and 237,000 last week.
Philly Fed Employment for July was -1 vs. -4.5 expected and -0.4 last month.
Existing Home Sales for June were 4.16 million vs. 4.2 million expected and 4.3 million last month.
As of today, markets are expecting one more 25 basis point hike followed by a somewhat lengthy pause. QT is expected to end by 2024 or in early 2024.
Yield Curve:
We constantly see bears point to the deep 2-year to 10-year yield curve inversion as a reason to be pessimistic. This ignores the historic pace of quantitative tightening currently happening. If the Fed liberally sells off its portfolio of short-term assets, rates on those assets will rise faster vs. assets that it’s selling less of – all else equal. Furthermore, QT sucks money out of the economy which is intentionally supposed to diminish longer term inflation expectations which can also lead to 10 year yield compression. So? Of course the yield curve is inverted. What did you expect? When QT ends is when the immense pressure on this inversion will fade. It’s artificial and manufactured by balance sheet reduction. We view the yield curve as a less reliable recession indicator today than it has even been.
11. Portfolio
I trimmed another small piece of The Trade Desk during the week in response to aggressive multiple expansion.