

Discover more from Stock Market Nerd
News of the Week (May 1 - 5)
Airbnb; SoFi; Meta Platforms; Apple; AMD; Starbucks; Block; Lemonade; JFrog; Match; Mercado Libre; Fortinet; Revolve; Nanox; Macro; Portfolio
Welcome to the hundreds of new subscribers who have joined us this week. We’re delighted to have you and determined to provide as much value as possible.
1. Airbnb (ABNB) -- Rooms
Airbnb announced a slew of new features including enhanced pricing transparency as it gears up for a busy summer. The highlight of this release is a new product called “Airbnb Rooms.” Rooms can be rented on an individual basis to cut costs for guests vs. needing to rent out an entire home. This emulates a hotel experience in a way that is “more affordable” per Co-Founder/CEO Brian Chesky.
This is a bit more intimate of a booking style, so Airbnb also debuted more detailed host descriptions to allow guests to better match with compatible individuals. The program will start with 1+ million rooms with 80% of them costing less than $100 per day. While Airbnb was once known as the low-cost travel provider, that has stopped being the case in recent years. This is its way to recapture that label and re-appeal to its original niche. Finally, it will add a buy now, pay later (BNPL) feature via a Klarna partnership to create more payment flexibility.
Not only will this lower the bar for guest bookings, but it makes regulatory compliance a bit easier as well. Why? In places like New York City, regulators are pushing to require hosts to be on premise while they rent out space to guests. By letting them rent out a spare bedroom rather than an entire apartment, being there becomes a lot easier.
Mostly metrics is a weekly business newsletter for anyone who cares about company performance. It's written by a tech CFO, CJ Gustafson, and read by +25,000 of your favorite Finance Gurus, Startup Operators and VCs. Subscribe here to get smarter on business metrics, financial operations, and monetization models today. It’s one of the few newsletters that I consistently read.
2. SoFi Technologies (SOFI) -- Capital Markets and Insider Buying
a) Capital Market Liquidity
SoFi reported stellar earnings and subsequently sold off sharply. This led some to concoct reasons to explain that move. The most common reason was concern around its access to capital market funding to sell loans as it didn’t conduct any whole loan sales during the quarter. To us, the SoFi move was related to regional banking concern and turmoil; the price decline was noise considering how strong the numbers were.
Here’s why we don’t see the capital market liquidity risk as valid:
SoFi’s balance sheet building has been telegraphed by leadership since it went public. The decision to get a charter was to create more balance sheet flexibility and a more profitable loan book through lower cost of capital. It can now store loans on its balance sheet to collect net interest income and maximize return on equity (ROE). That’s its goal. Always has been. Always will be.
Some don’t believe the argument that storing loans is to maximize ROE. They think it’s because the loans can’t be sold until being severely marked down. Two rebuttals here. First, SoFi doesn’t mark-to-market these loans itself. It has a 3rd party firm do it every three months with the valuation changes flowing through its income statement. This eliminates conflict of interest and the risk of pent-up unrealized losses surprising investors. Furthermore, it has quite literally gone out and REPURCHASED its previously sold pools back from capital markets. This is because it has excess liquidity needing to earn a yield and sees its loans as the best was to do so. And yes, it continues to enjoy excess liquidity and capital ratios well above regulatory minimums. This is not what a company struggling with liquidity and credit risk looks like.
The rapid growth in loans held is not coinciding with relatively enhanced credit risk. SoFi’s borrowers have an average FICO over 750 and an average income well over $150,000. Its demographic is very affluent and capital market appetite for that kind of credit has held up far better than for more subprime niches. For explicit evidence, it sold nearly $500 million in loans through ABS markets in Q1. The deal was 8x oversubscribed with spreads improving materially vs. its last comparable issuance. While regional banking turmoil has popped up since that deal, the stress is centralized in sub-prime credit and cash burning startups… not middle to upper class individuals. And again, SoFi has excess liquidity with healthy capital ratios, a tiny securities portfolio and significant funding source flexibility.
Finally, management on the call explicitly told us they could sell loans through whole markets easily and expeditiously if they wanted to. They simply see harvesting more net interest income as more attractive. Their words have been consistently accurate and honest since going public.
b) Insider Buying
Anthony Noto doesn’t seem concerned about capital market access. He bought another $250,000 in shares this week. He has purchased over $10 million in stock in the last year for 10% of his total net worth and a larger chunk of liquid net worth. This was in addition to his existing stake.
3. Meta Platforms (META) -- FTC
The Federal Trade Commission accused Meta of violating previous privacy rulings. It wants to ban the company from monetizing teen data and to block it from releasing products not blessed by the FTC. This ain’t happening. Every few years, an intimidating headline like this drops and turns out to be far more bark than bite.
Meta responded by calling this a baseless political stunt. It pointed out the irony in the FTC wanting to more tightly regulate this company vs. Chinese Government-affiliated TikTok. The social media giant doesn’t see the FTC as having anywhere near the authority or rationale to implement the rules and will take all of these claims to court. Zuck must have not invited Lina Khan (FTC Chair) to his last barbecue.
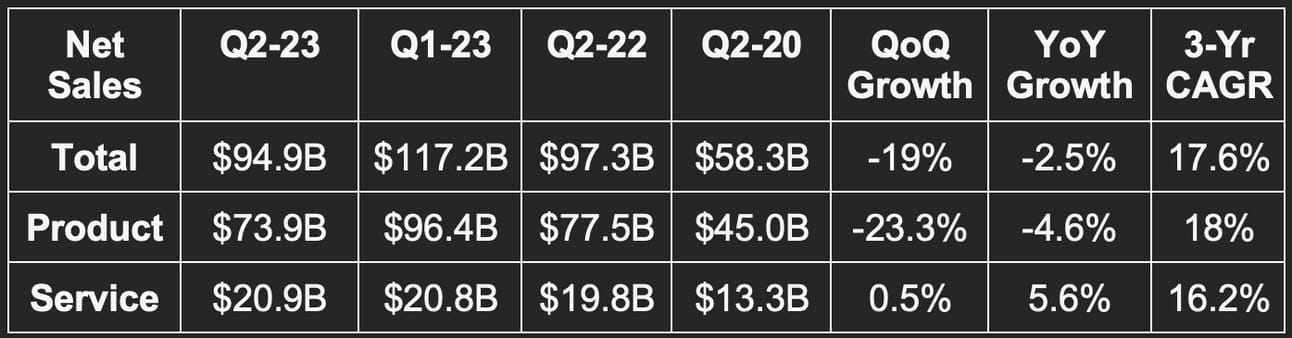
4. Apple (AAPL) -- FY Q2 2023 Earnings Review
a. Results
Beat revenue estimates by 2.2%.
Beat EBIT estimates by 4%.
Beat $1.43 EPS estimates by $0.10; Beat OCF estimates by 16%.
Beat gross margin (GPM) estimates by 20 bps.
b. Balance Sheet
New $90 billion buyback announced.
$39B in buybacks YTD vs. $43B YoY; $7.4B in dividends YTD vs. 7.3B YoY.
Inventory rose 51% YoY; $110B in debt ($10.6B is current).
$55B in current cash & equivalents; Another $110B in marketable securities.
c. Guidance
Apple guided to YoY revenue growth similar to this quarter. That implies 3% constant currency growth and -1% growth overall given an expected 400 basis point (bps) foreign exchange (FX) headwind. This slightly beat estimates of -1.7% YoY growth.
Gross margin guidance of 44.3% met estimates.
EBIT guidance roughly met expectations (slightly ahead).
d. Call & Release Highlights
Demand Context:
17.6% 3-yr revenue CAGR vs. 8.5% last quarter & 12.1% 2 quarters ago. This quarter enjoyed uniquely easy 3 year pandemic comps.
975 million paid subscribers across all of its services vs. 825 million YoY for 18.1% growth.
FX was a 500 bps revenue growth headwind.
It opened its first 2 stores in India during the quarter.
Apple’s install base continued to grow beyond the 2 billion benchmark it reached in January.
Macro is weighing on mobile gaming and advertising services. The rest of its services continue to perform well.
Services revenue set all-time highs in all geographies besides North America.
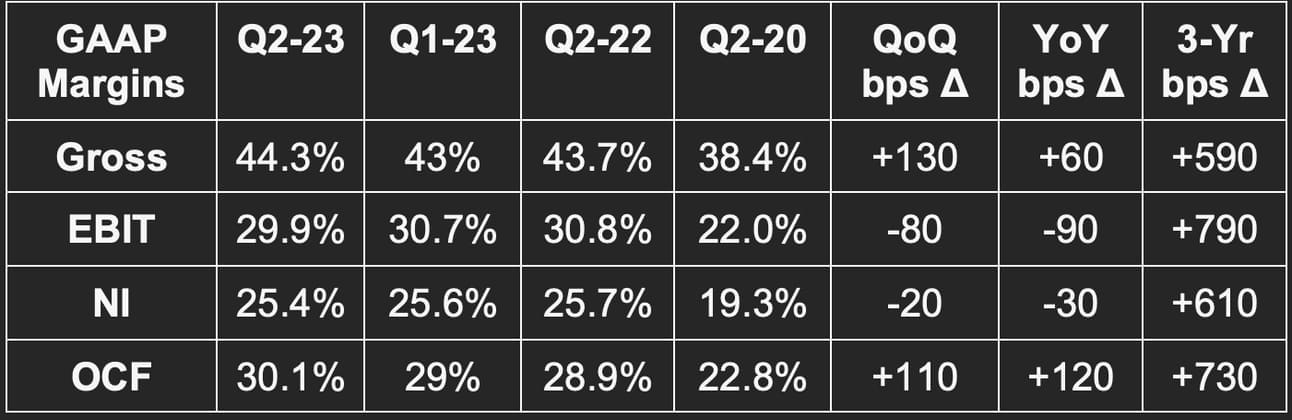
Margin Context:
Intentional cost savings drove the GPM improvement and its operating expenses coming in at the low end of its guidance. This helped margins while less demand hurt margins.
Product GPM was 36.7% vs. 37% QoQ and 36.4% YoY.
Services GPM was 71% vs. 70.8% QoQ and 72.6% YoY.
Mac & iPad, and Apple Watch:
Most of Apple’s hardware segments are being held back by poor macro conditions per the company.
Mac and iPad growth were both greatly pressured by tough macro conditions. Furthermore, growth was hit by the YoY period comping vs. a Q2 2022 period when the M1 chip very successfully debuted.
Mac fell 31% YoY and iPad fell 13% YoY -- both in line with internal expectations.
2 out of 3 Apple Watch purchases came from new customers this quarter.
iPhone:
iPhone revenue fared a bit better with slow YoY growth. Interestingly, emerging market strength carried the success here as demand was a bit softer in North America. This isn’t surprising considering North American carriers have cited weak upgrade cycles during the quarter. Apple believes it took more smartphone share in China during the quarter along with other key emerging and international markets. The new iPhone has a 99% customer satisfaction rate per 451 Research.
Apple Card & BNPL:
Apple got a few questions on its newer financial services push. It declined to offer detail on the segment’s trajectory, but told investors the high yield savings account was off to a great start. Forbes already told us that Apple racked up $1 billion in deposits in just 4 days, so this was not surprising.
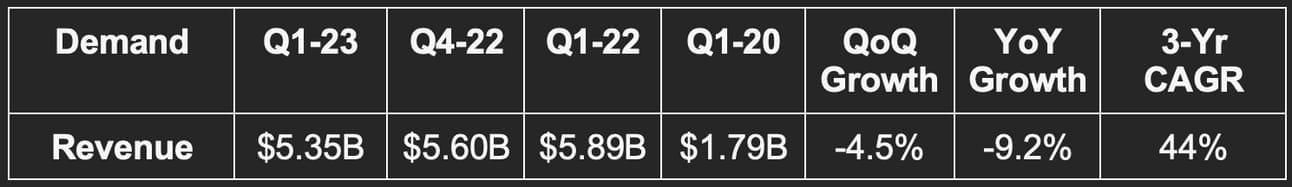
5. AMD (AMD) -- Q1 2023 Earnings Review
a. Results
Roughly met revenue estimates & beat its guide by 1%.
Met GPM estimates & met GPM guide.
Beat EBIT estimates by 4.3% & beat EBIT guide by 4.6%.
Missed $0.03 GAAP EPS estimates by $0.12.
b. Balance Sheet
$5.9B in cash & equivalents; $2.5B in debt.
Bought back $241 million in stock with $6.3 billion remaining on its current program.
Inventory rose 12.5% QoQ and 74% YoY.
c. Guidance
Missed Q1 2023 revenue estimates by 3.8%.
Missed Q1 2023 EBIT estimates by 9.5%.
Missed GPM estimates by 40 bps.
Reiterated vague 2023 guidance. Nothing concrete was offered for the full year.
d. Call & Release Highlights
Demand Context:
44% 3-yr CAGR vs. 38% last quarter and 45.7% 2 quarters ago.
Data center revenue was $1.30 billion vs. $1.66 billion QoQ and $1.29 billion YoY.
Gaming revenue was $1.76 billion vs. $1.64 billion QoQ and $1.88 billion YoY.
Embedded revenue was $1.56 billion vs. $1.4 billion QoQ and $595 million YoY.
Client revenue fell from $2.12 billion to $740 million YoY. The Client segment shipped “well below consumption to work through inventory.” AMD thinks Q1 was the bottom for the segment’s demand.
Signed a new multi-year Samsung contract for its graphics suite.
Margin Context:
Xilinx is weighing down GAAP margins; GAAP NI margin was 12.8% ex-amortization charges.
Data center EBIT margin was 11.4% vs. 26.8% QoQ & 33.0% YoY.
Gaming EBIT margin was 17.8% vs. 16.2% QoQ & 19.1% YoY.
6.1% FCF margin vs. 7.9% QoQ and 15.7% YoY.
Macro:
“In the near term, we continue to see a mixed demand environment based on the uncertainties in the macro environment. Based on customer demand signals, we expect second quarter revenue will be flattish sequentially with growth in our client and data center segments, offset by modest declines in our Gaming and Embedded segments. We remain confident in our ability to grow in the second half of the year.” -- CEO Lisa Su
Enterprise sales are “falling due to end customer demand softening with near term macro uncertainty” per Su.
It expects server demand to stay mixed in Q2 and grow in Q3-Q4.
Program Highlights:
Azure, Google Cloud and Oracle all expanded AMD deployments for their infrastructure.
Closed multiple new Fortune 500 contracts during the quarter.
Its new Pensando Data Center chip is delivering 10x more connections per second vs. the old model for Azure.
Expects PC chip revenue to ramp throughout the year.
AI:
Customer interest is “increasing significantly” in AMD’s training and inference AI chips.
Its newer MI300 silicon chip for AI will launch this year.
Combined all AI teams into one unit during the quarter (just like Google did).
AMD is seen as a challenger in this space with Nvidia the tech and share leader at this time.
“We are in the very early stages of the AI computing era, and the rate of adoption and growth is faster than any other technology in recent history.” -- CEO Lisa Su
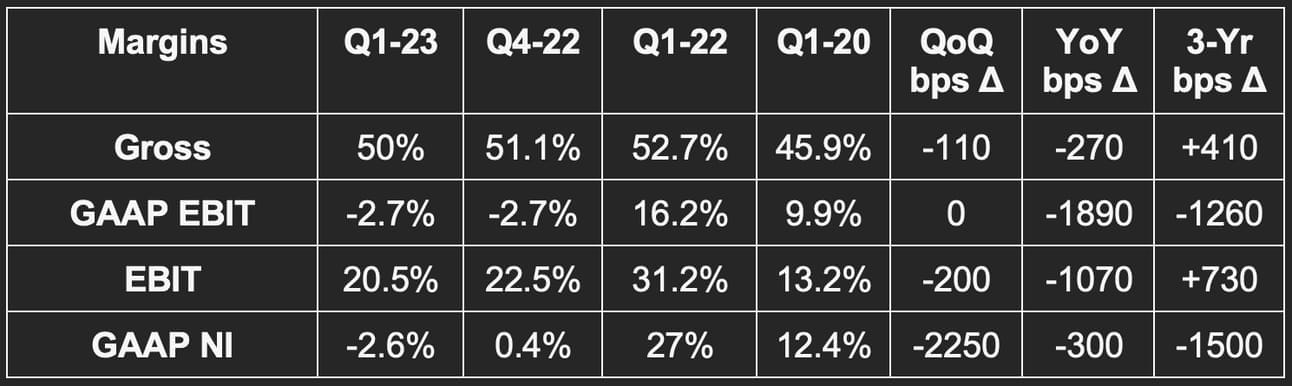
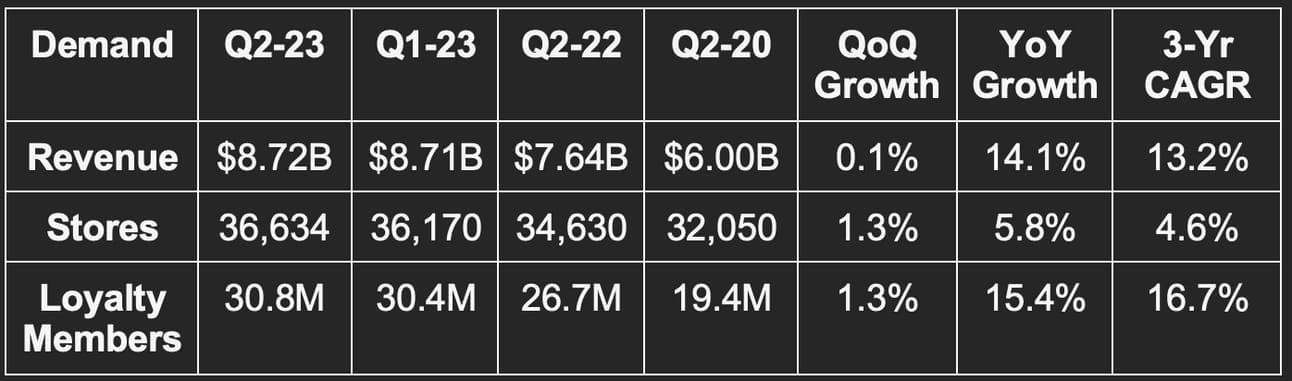
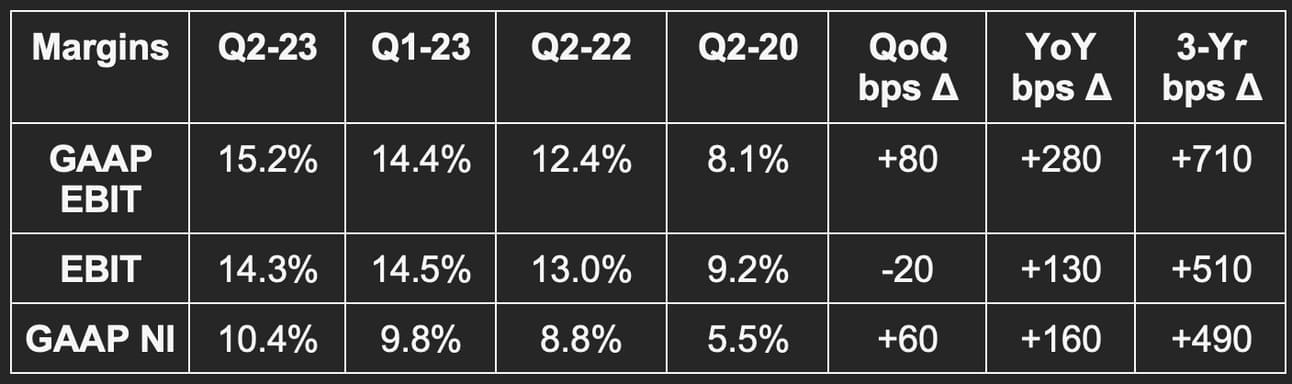
6. Starbucks (SBUX) -- FY Q2 2023 Earnings
a. Results
Beat revenue estimate by 3.4%.
Beat EBIT estimate by 12.1%.
Beat $0.65 GAAP EPS estimate by $0.10.
b. Guidance
Starbucks reiterated its guidance of 11% revenue growth and 17.5% EPS growth -- both at the midpoint. This compares to estimates of 12.1% revenue growth and 16% EPS growth.
“We expect Q2 demand to continue as we push the envelope with innovation.” -- CEO Laxman Narasimhan
c. Balance Sheet
$3.4 billion in cash & equivalents.
$13.5 billion in total debt.
Repurchased $480 million year to date (YTD) vs. $4 billion YTD YoY.
Dividends YTD are up 6.8%.
d. Call & Release Highlights
Demand Context:
13.2% 3-yr revenue CAGR vs. 7.1% last Q & 7.6% 2 Qs ago (easy pandemic comps).
Global comp sales rose 11% YoY vs. 5% last Q.
Revenue growth was impacted by a 200 bps FX headwind.
Its egg bites and other foods saw record revenue during the quarter.
Mobile Order + drive-thru + delivery = 74% of U.S. company owned revenue.
Mobile orders = 47% of sales vs. 43% YoY.
Rewards members = 57% of U.S. company owned revenue vs. 54% YoY.
Starbucks took more ready-to-drink category share to grow its leading position for a 2nd straight quarter.
International revenue rose 9% (19% FX neutral (FXN)) while North American revenue rose 17% YoY.
Priorities for new CEO Laxman Narasimhan:
Will try to morph store deliveries from a “one size fits all model with frequent out of stocks” to a lower cost, higher quality process over time.
Will streamline vendor purchasing to do things like condense its 1,500 cup and lid combos in the network.
He spoke on going “back to basics” for the company to streamline operations and become more efficient in several areas. This sounded a lot like Chipotle’s current initiatives.
New beverages like Oleato (olive oil infused coffee) is a top 5 product launch for Starbucks in the last 5 years.
To Narasimhan, evidence of his plan working can be seen in things like company margins and improved barista turnover. Its margins expanded materially YoY while barista turnover fell 9% YoY.
China:
Starbucks outperformance was attributed largely to China recovering “faster than expected.” This was Starbucks’ first positive comp sales quarter in that country since 2021. Comp sales growth was 3% there for the quarter and accelerated to 30% YoY in March. It reiterated 2023 China store opening plans and sees its decision to keep opening stores there during COVID as finally paying off.
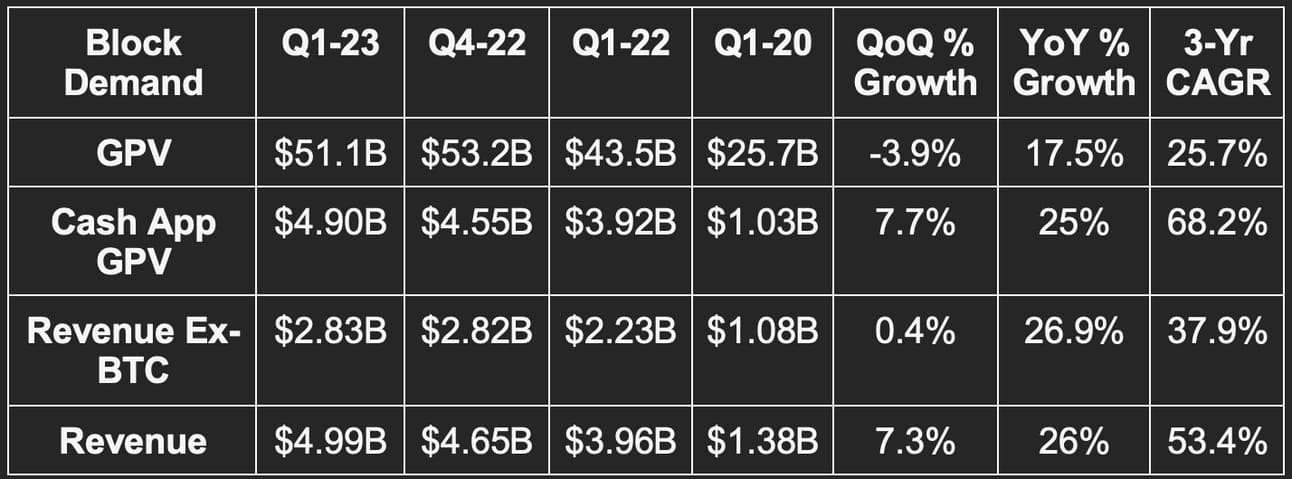
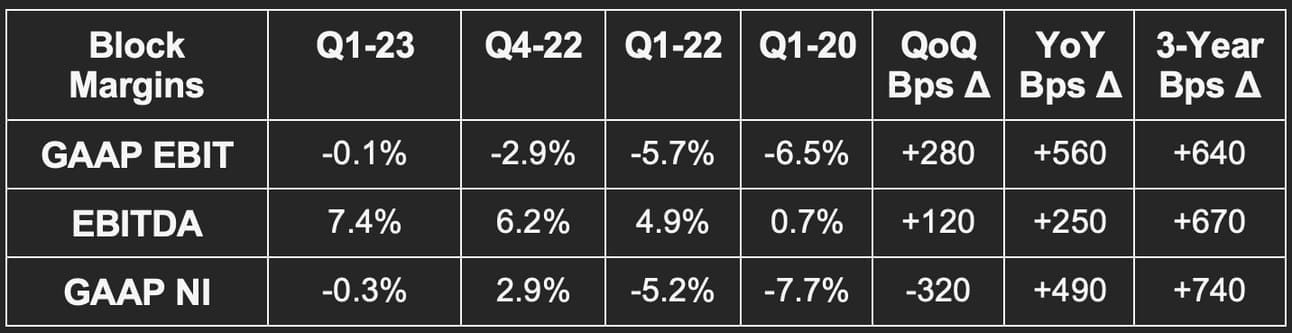
7. Block (SQ) -- Earnings Review
a. Results
Beat revenue estimates by 8.5%.
Beat EBITDA estimates by 38.8%.
Crushed -$124.5 million GAAP EBIT estimate by $118 million.
Beat $0.34 EPS estimates by $0.06.
Beat $0.18 GAAP EPS estimates by $0.15.
b. Balance Sheet
$6.1 billion in cash & equivalents and $7.6 billion in total liquidity.
$4.6 billion in debt with $600 million in revolver capacity.
Stock comp was 7% of sales vs. 6% of 2022 revenue and 7% of revenue in the YoY quarter.
Share count grew 11% YoY. This is being impacted by Afterpay M&A which closed in Q1 2022.
c. Guidance
Block raised its EBITDA guide by 4.6% which beat estimates by 1.5%. It also improved its adjusted operating loss guide from $150 million to $115 million. This non-GAAP metric is not comparable to consensus EBIT estimates.
It also told us that gross profit growth slowed from 32% YoY to 24% YoY as of April and that OpEx will grow by 12.7% QoQ next quarter.
d. Letter Highlights
Demand Context:
Block reported 53 million transacting monthly actives vs. 51 million QoQ and 46 million YoY. Unless this is a fraudulent metric (which we do not believe is the case), this further contradicts the arguments presented by the recent short report on Block.
Block enjoyed 34% YoY growth in cash app card actives to reach 20 million. Average spend for these users continues to rise. Cash app monthly actives now equate to 38% of total actives vs. 33% YoY.
Inflows per transaction active rose 8% QoQ. 27% YoY inflow growth was its fastest rate in over a year.
2 million direct deposit actives with paycheck deposit volume -- up 69% YoY.
Its savings account has 3 million actives just 3 months into launch.
38% of Squares sellers are mid-market or larger vs. 35% YoY.
Transaction revenue rose 15% YoY; subscription and services revenue rose 42% YoY.
Cash app revenue rose 33% YoY and 52% YoY when excluding Bitcoin.
Margin and Profit Context:
Gross profit is the key focus for Block. Cash app gross profit rose 49% YoY, Square gross profit was 16% YoY and overall gross profit rose 32% YoY. Ex-paycheck protection program profits, Square gross profit growth would have been 26% YoY.
16% of Square gross profit is now from international sellers vs. 13% YoY. International gross profit for Square rose 43% YoY as it launched products in Japan and extended global traction.
A shift from debit funded to credit funded transactions is hurting transaction margins like it has for every other payments company as we exit the stimulus era.
OpEx rose 22% YoY partially due to Afterpay. R&D continued to rapidly grow YoY while sales and marketing (S&M) fell slightly and general and administration (G&A) was roughly flat.
Generative AI:
Block talked about investing more heavily in generative AI. It launched suggested actions for Square sellers to guide them through orders and workflows. This follows its launch of suggested product descriptions which are being used with no manual edits 75% of the time.
Credit Quality:
Block’s transaction, loan and consumer receivables losses rose 40% YoY to $128 million. This is not ideal, but not surprising either. It’s an expected function of growing the cash app card. Loss rates for Square GPV, Square Loans and BNPL are stable.
8. Lemonade (LMND) -- Earnings Review
“Progress was in line with what we hoped to see… we don’t see this as limited to Q1 but believe Q1 will be reflective of a better trendline on our path to profitability.” -- Co-CEO Daniel Schreiber
a. Demand
Beat revenue estimates by 7.9% and beat its revenue guide by 8.2%.
Beat its In Force Premium (IFP) guide by 2.7%.
Beat its Gross Earned Premium (GEP) guide by 3.4%.
More Demand Context:
Metromile inorganic growth propped up YoY growth comps. Organic premium growth was 32%. This started boosting revenue in Q3 2022 (see chart above).
Lemonade launched several new products in 2021 and 2022. This is why you see the rapid QoQ premium per customer growth that has since slowed.
b. Margins
Beat EBITDA loss estimates by 18.3% and its guide by 20.6%.
Beat GAAP EBIT loss estimates by 16%.
Beat EPS loss estimates of $1.13 per share by $0.18.
Beat GPM estimates by 250 bps.
More Margin Context:
Loss ratios per product are all falling. The 3-year worsening of loss ratios is related to debuting new products. In Q1 2020 Lemonade was a renters insurance company. Now it offers every basic product and new products debut at peak loss rates before improving thereafter.
Inflation continues to hit gross margins hard. Claims float freely with inflation. Premium hikes must be approved initially by regulators. Lemonade was very behind a few quarters ago on rate change filings and has had to play catch up. That process is ongoing which should continue to bolster gross margin over the next several quarters.
S&M spend fell 26% YoY due to lower growth spend as planned.
R&D and G&A expense buckets rose due to Metromile.
Headcount rose 1% QoQ.
c. Balance Sheet
$993 million in cash & equivalents.
No debt.
Stock comp was 16% of sales vs. 17.7% QoQ and 31.8% YoY. Some progress here. More is needed and more is expected.
Share count rose 12% YoY due to M&A.
$358 million held by U.S. and Dutch insurance subsidiaries; $148 million of that is restricted for regulatory surplus requirements with the rest available for day-to-day claims paying.
d. Guidance
Q2 2023:
Beat revenue estimates by 6.7%.
Beat EBITDA estimates by 4.6%.
2023:
Raised its IFP guide by 0.7%.
Raised its GEP guide by 2.1%.
Raised its revenue guide by 4.5% and beat estimates by 3.4%.
Raised its EBITDA guide by 16.5% and beat estimates by 15.7%.
e. Call & Release Highlights
Inflation and Macro:
Lemonade continues to intentionally slow its growth spend and let unprofitable plans roll off of its book. It’s waiting on regulatory rate filing approvals to make the potential business worth pursuing once more. There is real progress being made here. In Q1, it enjoyed 55% more rate filing approvals vs. the YoY period. To give you an idea of how important this is, consider its pet product. Premium hikes that Lemonade Pet implemented in 30 states last year led to a 950 bps decline in loss ratios. This directly feeds gross margins and profitability.
Loss Ratios & Margins:
The company has a “line of sight” to its target loss ratios but still sees getting there as “several quarters away.” It will continue to hold back on growth until loss ratios have more time to improve. Still, it grew faster than it was supposed to and raised the top line guide as it “hasn’t mastered slower growth.” This isn’t impacting its loss ratio targets as the growth came from excellent marketing efficiency; each $1 in growth spend generated 12% more premiums vs. the YoY period. This is the best weak spot of a call ever: “Sorry about growing faster than we were supposed to despite cutting costs like we said we would.” Apology accepted.
Lemonade’s path to profits offered at its 2022 investor day is intact.
Operating expenses rose just 4% YoY and fell YoY when excluding the impact of Metromile M&A. It is tightening its belt considerably yet still delivering robust growth.
Lemonade also spoke extensively on the impact that AI will have on its business. It reminded us that the firm was born and raised from AI algorithms and models. It linked investors to a 2017 paper that it wrote which correctly predicted where AI was heading. AI is the “DNA of the company.” Conversely, it sees competition’s “broker distribution, siloed systems and disparate data” as “kryptonite” for leveraging AI utility. It thinks this will become a stronger and stronger competitive edge over time. Notably, the rapid EBITDA guidance improvement was partially attributed to more AI implementation across its operations. It expects “meaningful cost structure savings over the next 18 months” due to heavier AI usage. AI model quality is an abstract concept to grasp; better profit margins is the concrete evidence.
“Generative AI is not a course change, it’s an accelerant along the course we set at our inception.” -- Co-CEO Daniel Schreiber
Reinsurance:
As leadership has telegraphed since going public, the company will continue to limit usage of reinsurance as the business scales and its ability to absorb risk improves. It’s making “good progress” on new reinsurance contracts and will share the details when they’re finalized. Ceded premium rate fell from 71% YoY and 59% QoQ to 56% this quarter. We’ve been told to expect that trend to continue. As an aside, this was a small boost to revenue growth as ceded premiums cannot be recognized as revenue.
Final Notes:
Lemonade launched its new Chewy partnership in Arizona this week. The partnership will roll out to all 50 states this quarter.
Metromile’s data is now being used for Lemonade Car policy underwriting.
Lemonade generated $5.7 million in interest and investment income vs. $900,000 YoY. It expects this yield to consistently improve and bolster profitability over time.
f. Take
Last quarter was underwhelming; this quarter was excellent. The company showed faster progress in its path to profit than we were expecting and did so while delivering a sizable top line beat and raise. The cost cuts show it’s serious about being leaner; its stable growth paired with soaring retention rates show the loyalty of its customer base. The rate change filings are beginning to help gross margin with most of the benefit still to come. Lemonade has officially been removed from our “do not add” list. We will resume slowly accumulating shares over time.
9. JFrog (FROG) -- Earnings Review
a. Demand
JFrog beat revenue estimates by 1.8%.
Demand Context:
Cloud revenue is now 31% of total revenue vs. 30% QoQ and 26% YoY.
JFrog Complete (its full platform offering) is now 44% of revenue vs. 43% QoQ and 35% YoY.
JFrog’s gross retention rate is stable at 97%. There are zero churn issues here.
b. Margins
Beat EBIT estimates of $2 million by $700,000 or 35%.
MissedGPM estimates by 20 bps.
Missed -$0.16 GAAP EPS estimates by $0.05.
Beat $0.03 EPS estimates by $0.03.
Sharply missed $5.7 million FCF estimates with FCF of -$1.4 million.
Margin Context:
Cloud proliferation is the source of the GPM contraction. JFrog continues to expect a long-term GPM of 80%.
FCF missed due to timing of collections.
c. Balance Sheet
Cash and equivalents of $447.2 million,
No debt.
Share count is up 3.4% YoY. Its annual guide implies 1.8% share count growth over the next 9 months.
Stock based compensation was 24.9% of sales vs. 22.1% YoY and 24.5% QoQ. This is being heavily impacted by recent M&A and also equity packages that are valued based on the issue date for JFrog specifically. This makes stock comp dollars look worse than they actually are. Still, this needs to briskly revert.
JFrog’s remaining performance obligations rose 22.6% YoY to reach $210.6 million.
d. Guidance
Q2 2022 Guide:
$83 million in revenue for 22.4% YoY growth. This beat estimates by 0.2%.
$3.5 million in EBIT. This beat estimates by 5.1%.
$0.055 in EPS. This beat estimates by $0.025 or 83%.
2023:
$343.5 million in revenue. This represents a 0.4% raise to previous guidance and a 0.4% beat vs. estimates.
$19.5 million in EBIT. This represents an 8.3% raise to previous guidance and a 9.6% beat vs. estimates.
$0.20 in EPS. This represents a $0.01 raise to its previous guide and a $0.02 beat vs. estimates.
Reiterated FCF margin guidance in the single digit percent range for 2023. This shows the quarterly FCF miss truly was a matter of timing.
Cloud growth to be in the mid 40% range with potential usage-based growth upside.
After some other reports from software firms like CloudFlare, we were quite pleased with the small beats and raises across the board. Very tough environment to pull that off. And this guide also assumes usage optimization trends are not fully behind it while being called “appropriately conservative.”
JFrog surprisingly offered 2027 financial targets this quarter. It sees revenue compounding at 23% to reach $800 million by then. Cloud and security are set to be the two most powerful drivers of growth. It sees EBIT margin reaching 22% vs. 0.5% in 2022 and FCF margin reaching 27.5% vs. 6.1% in 2022. This cash flow margin represents $220 million in 2027 FCF. At just 15x free cash flow at that time and 2% annual dilution, JFrog’s return CAGR would be roughly 21%. The guide assumes poor macro persists for “several quarters” despite it already seeing improvements which continued into May. It assumes net revenue retention stays between 118%-120% during the period.
e. Call & Release Highlights
On Macro:
Unlike some other firms, JFrog cited recovering usage optimization trends this quarter and accelerating cloud usage as the source of its outperformance. The improvement was broad based. It saw the “first wave of cloud optimization” fading away, but again, it didn’t assume this would further improve in its forward guidance.
JFrog also credited its hybrid (cloud and on-premise) approach to DevSecOps for its strong results. This has meant that delayed cloud migrations don’t mean delayed revenue, just temporarily more on-premise revenue which is actually slightly higher margin business. This is ideal in today’s environment of up-selling caution. Furthermore, several deals that were delayed last quarter due to budget hesitation were encouragingly closed in Q1. And finally, its ramping partner initiatives were also a material results tailwind. It landed its largest Japan client ever, a U.S. federal agency, and a leading payment firm with 30 million users thanks to these partner channels.
“While the environment remains challenging, customers have pushed forward to expand infrastructure with JFrog. Some are delaying or re-scoping projects, but they ultimately need to move forward with high value initiatives based on our solutions.” -- Founder/CEO Shlomi Ben Haim
It was also asked about regional bank exposure. It has very little of it. Its banking client revenue largely comes from titans like Citi.
Product Updates:
JFrog Advanced security (the name of its new security product) launched for on-premise this quarter. The benefit of this offering is expected to be material by the end of this year.
JFrog’s platform won “most comprehensive DevSecOps” solution from the Cyber Defense Magazine.
This was a banner quarter for its new security suite displacing legacy point solutions.
Case Studies:
Box went with JFrog to raise software release cadence by 90x in 2 years.
Cisco went with JFrog Enterprise+ to vastly bolster its own software release cadence.
Client List:
JFrog’s client list comprising nearly 90% of the Fortune 100 is often underrated by the investor community. This graphic from the presentation does a great job pointing this out:
f. Take
This was a boring quarter in the best of ways. No negative surprises. Just small positive surprises despite daunting macro headwinds that others blamed for poor results. The 2027 targets are very reachable and the risk/reward for this name (in our view) is quite compelling. Not to get too excited, but the assumptions baked into the long-term forecast are pessimistic if anything and leave more room to the upside. Expect more delightfully boring execution from this rock-solid team over the planning period.
10. Match Group (MTCH) -- Earnings Review
a. Demand
Match missed revenue estimates by 0.9% and its guide by 1% at the midpoint. Tinder Direct revenue met its flat YoY growth (4% FX neutral) guide while Hinge also met its 25%+ YoY growth guide with 27% YoY growth (30% FX neutral).
Demand Context:
Foreign exchange headwinds hit revenue by $7 million more than expected. This was the entire source of the small miss.
FX neutral (FXN) revenue growth was 3% YoY.
RPP growth was 6% FXN.
Payer declines are as expected following Match’s move to raise Tinder subscription pricing to maximize revenue. This was amplified slightly by softer new user growth than expected, but the price hike was the main reason.
Subscription revenue growth remains healthy; a la carte revenue growth remains challenged.
Hinge Payers now exceed 1 million with RPP over $25 vs. about $5 in 2019.
Match Group Asia saw a 13% YoY revenue decline.
Evergreen & Emerging revenue fell 8% YoY overall (-6% FXN) but emerging brands enjoyed over 50% YoY growth which met its internal expectations.
b. Margins
Match beat EBITDA estimates by 3.6% and beat its guide by 4.0%. It beat GAAP EPS estimates of $0.40 by $0.03 and beat GAAP gross margin (GPM) estimates by 10 bps.
Margin Context:
Uniquely easy 3-year margin comps.
The EBITDA beat despite the revenue shortfall was via “stronger expense discipline in the quarter vs. expectations.”
Product and development costs rose 25% YoY mainly due to previous hiring in 2021 and 2022. It represented 12% of revenue vs. 10% YoY.
In app payments as a percent of revenue rose 150 bps YoY as app store policy regulation continues to slowly unfold. That benefit is expected to boost margins starting in 2024.
c. Balance Sheet
$575 million in cash & equivalents with an expectation to generate $800 million in free cash flow this year. It will return at least half of that to shareholders and more than half if there’s not another good usage of the capital.
$3.84 billion in long term debt.
Stock compensation was stable at 5.3% of revenue.
Match authorized a new $1 billion buyback as its trailing 12 month net leverage ratio is now down to its goal of 3x vs. 3.7x YoY. This represents just over 10% of its overall market cap. Aggressive.
d. Guidance
Match reiterated its expectations for flat or slightly expanded EBITDA margins YoY which is in line with expectations. It told us that its previously forecasted 5%-10% revenue growth guide for 2023 could likely be closer to 5% due to $17 million more in FX headwinds vs. expectations. This represents a slight miss vs. expectations. Still, it reiterated exiting the year with revenue growth in the double digits.
“We’re already seeing improvement in April with initiatives that could drive better growth this year. We are eager to see the progress.” -- CEO Bernard Kim
For next quarter, the company’s revenue and EBITDA guidance was actually above estimates. This, however, is a matter of timing as the full year guide was not raised. The team expects Tinder Direct revenue to grow in the low single digit range YoY and low to mid-single digit range QoQ. It sees Tinder Payers falling via price hikes. It expects faster YoY Hinge growth this quarter vs. last quarter. Asia revenue declines will moderate and growth will be flat YoY FXN. It will continue aggressively marketing Tinder, Hinge and The League. The FX headwind is set to shrink to 100bps.
e. Call & Letter Highlights
Tinder:
The team is “executing against 2023 goals” with ramping product velocity. The first product initiatives from the new team rolled out at the end of this quarter in price optimizations and weekly subscriptions. And again, the price hikes are designed to maximize revenue while accepting some payer churn. These launches will be rolled out globally this quarter. As you can see from the chart below, the changes are working quite well so far in Q2:
In other Tinder news, the company’s global marketing campaign to re-define its brand image is underway. So far in the USA and UK, it has raised brand consideration and intent by 3.3% and 3.7% respectively for females aged 18-24. The new team sees Tinder’s years of reliance on organic virality as now hurting its brand perception and user growth. It is trying to take back control. Importantly, this is not leading to growing marketing spend as these dollars are coming from marketing reductions for its established brands.
Tinder also debuted new ad formats, a “Just for You” curated profile function and more granular profile descriptions. Its high-end subscription tier will launch in the fall. Finally, it’s hard at work on eliminating users on the app solely to promote their other products and social media profiles.
Hinge:
Global expansion continues to go very well here. It’s now #2 in UK downloads as of March (behind Tinder), 2nd for downloads in France 10 months after launching there and top 3 in Germany and the Nordics. It’s ready to lean into external marketing following great organic traction. It will ramp marketing spend in Italy, Spain and the Netherlands this quarter.
Interestingly, Hinge’s success is actually driving better download growth for Tinder in countries like France. This is because it’s driving overall industry traction which Tinder (as the share leader) inherently benefits from. Specifically, a large chunk of Hinge users are on Tinder and 10% of Tinder’s lapsed users are on Hinge.
20% of new users are opting into its premium HingeX subscription tier. This is in line with internal expectations. The tier rolled out in late February with the revenue benefit expected to ramp all year.
Hinge revenue per payer is now $25 vs. around $5 in 2019.
Match Group Asia:
Azar is showing signs of a revenue growth acceleration via product enhancements such as better matching algorithms.
Match expects Hyperconnect (Azar + Hakuna apps) EBITDA margin to be 10% for 2023.
Japan remains very soft for dating demand but Pairs (its app there) was the only to grow YoY revenue during the quarter and remains the clear share leader.
Evergreen & Emerging Apps:
Match Group “identified a new opportunity for a large addressable market to serve.” Its developers are building an app that it thinks will be “superior to existing offerings in the space.” This will launch during the summer.
e. Take
Another underwhelming quarter for Match Group. The new team has the next three quarters to show brisk signs of turning the tide at Tinder. We are confident in Kim as his track record with Zynga is relevant and impressive. The robust April commentary with an improving Tinder revenue trend was a great step in the right direction.
If that progress doesn’t come with fading FX headwinds, easier comps and better Tinder execution, I’ll exit. This is a global share leader in a space poised for brisk annual growth. The odds of success are skewed in its favor, but it still needs to execute far better than the old team did. Again… optimistic but we’ll have to see how things shake out. For now, it is on the do not add list.
11. Mercado Libre (MELI) -- Earnings Review
a. Results
Beat revenue estimates by 5.4%.
Beat GAAP EBIT estimates by 18.8%.
Beat $3.13 GAAP EPS estimates by $0.84 or 26.8%.
b. Balance Sheet
$4.5B in $ & equivalents.
$2.8B in card receivables vs. $2.95B QoQ.
$1.9B in loan receivables vs. $1.7 billion QoQ
$2.5 billion in loans payable and other financial liabilities.
c. Call & Letter Highlights
Results:
Its 67.1% 3-year revenue CAGR compares to 64.5% last quarter and 64.7% 2 quarters ago. Revenue growth was hit by a massive 2300 FX headwind and would have been roughly 58% YoY FXN. Impressively, it delivered over $800 million in cash from operations vs. burning through operating cash in the YoY period. This isn’t a matter declining headcount either as it continues to aggressively hire.
Commerce:
Mercado Libre called the Commerce segment the quarterly standout. Commerce revenue rose 54% YoY FXN and 31% with the FX headwind which was the fastest rate of growth in over a year. Commerce take rate rose from 16.7% to 17.8% YoY. Items sold growth accelerated from 11% YoY last quarter to 16% YoY this quarter. FXN GMV growth accelerated from 35% YoY last quarter to 43% YoY this quarter. The firm’s work to improve its first party business service throughout 2022 also led to 28% YoY growth vs. 8% YoY growth last quarter. Strong.
And the highlights continue…
Successful sellers rose 23% YoY -- well ahead of expectations.
It took more market share in Brazil and Mexico.
Brazilian fulfillment penetration rose from 37% to 41% YoY as shipping profits expanded and its delivery times remained best in class (like in its other markets).
Argentina items-sold growth (independent from inflation) turned positive at 3% YoY growth vs. -1% YoY growth last quarter. Chile GMV growth turned back positive as well.
Inventory turn is accelerating.
Unique buyers rose 16.4% YoY and slightly QoQ. Transactions per buyer of 6.7 was flat YoY and fell from 7 QoQ (seasonality).
Same day and next day delivery rate is 53% vs. 51% QoQ. Its managed fulfillment network covers over 90% of all its largest markets.
Advertising:
Ad revenue = 1.4% of total GMV vs. 1.1% YoY.
Ad revenue rose 62% YoY.
Financial Services/Mercado Pago:
TPV rose 96% FXN and 46% in U.S. dollars. Revenue rose 64% FXN which was the slowest rate of growth since inception. Growth will always decline with scale, but tough comps pronounced this trend for the quarter.
Digital wallet payers grew 20% YoY.
It processed 1.8 billion transactions, up 72% YoY.
Fintech take rate fell from 3.84% last year to 3.68% this quarter.
Its POS devices sold fell under 1 million in Brazil as it shifted to focusing on larger merchants. TPV per device rose 26% YoY for evidence of this working.
It has 44.5 million unique active fintech users, up 25% YoY and 1.8% QoQ.
Fintech revenue growth slowed.
Credit Performance:
Its credit portfolio is roughly $3 billion in size. While it barely grew QoQ, it did grow 26% YoY as it maintains “cautious origination posture.”
Interest margin after losses sharply rose to 38.8% vs. 24.7% YoY.
Under 90-day non-performing loan rate fell to 9.5% vs. 10.3% QoQ and 13.4% YoY; over 90-day non-performing loan rate spiked from 14.2% to 28.2% YoY but fell from 29.6% last quarter.
12. Fortinet (FTNT) -- Earnings Review
Fortinet offers a variety of cybersecurity solutions within both network and endpoint niches. For this reason, it can be seen as a decent hint for CrowdStrike’s upcoming report along with SentinelOne, Zscaler and others. It’s also relevant to compare its results to other network security vendors like CloudFlare to gauge how much of macro issues are truly macro-related and what portion is company-specific. Fortinet’s strong results made a case for the company-specific argument and raised the performance bar for the rest of the industry.
a. Results
Beat revenue estimate by 5% and its guidance by a similar margin.
Beat billings guide by 4.2%.
Beat EBIT estimate by 17.6% and its guide by 18.4%.
Beat $0.23 GAAP EPS estimate by $0.08.
Beat $0.29 EPS estimate by $0.05 and its guidance by $0.06.
Beat FCF estimate by 54%. This was helped by the timing of collections.
b. Balance Sheet
Added $1 billion in buyback capacity with now $1.53 billion in total buyback availability.
$2.9 billion in cash & equivalents.
$990.9 million in long term debt.
Share count fell 2.5% YoY.
c. Guidance
2023:
Raised its billings guide by 0.4%.
Raised revenue guide by 1% and beat revenue estimates by 0.8%.
Slightly raised EBIT guidance and met estimates.
Reiterated EPS guidance and beat estimates of $1.42 by $0.04\
d. Call
Fortinet’s ability to consolidate network and security point solution vendors and lower total cost of ownership continues to be especially coveted in this chaotic environment. This is why its service revenue growth eclipsed 30% YoY for the first time since 2017.
Its Service Defined Wide Area Network (SD-WAN) and operational tech (OT) buckets represented 25% of total bookings. Its secure SD-WAN approach continues to take share vs. traditional WAN approaches. Secure SD-Wan allows for automated uncovering of the best traffic route and emulates a virtual network that vastly lowers cost and raises bandwidth for customers vs. legacy approaches. It is making progress in its goal to become the share leader here.
It reiterated its 2025 revenue and profit targets while raising pieces of its 2023 guide and maintaining the rest. While some software vendors (selling perhaps more discretionary products) are struggling, Fortinet is not. Its backlog cancellation rate was better than expected, its supply chain issues are being resolved and its large customer business is booming with $1 million deals rising 38% YoY. Rock solid report. Rock solid guide. No issues to pick at.
13. Nano-X Imaging (NNOX) -- Clearance
Well isn’t this a site for sore eyes. In somewhat surprising news, Nanox finally secured multi-source FDA clearance for its Nanox Arc system. Through accusations of fraud and a breathtaking share decline, we held the small stake and that now looks like the correct decision. This is why position sizing is so vital. Finite downside and infinite potential upside is a wonderful thing. Diversification allows that downside to be more palatable while infinite potential upside allows success to still be rewarding. This lottery ticket may finally be starting to pay off.
We were very tempted to add following this news. We will likely wait until commercial distribution begins, but this was the main hurdle to clear. Go Nanox.
Let’s do some fun math. Assume 6,000 machines under contract (lower than what they say). Also assume 10 scans per day (the contractual minimum), $14 in revenue per scan and 250 days of machine usage per year. This puts the firm at $210 million in annual revenue which will be “mostly gross profit.” Pessimistically assume this means a 51% gross margin and we get $105 million in gross profit which should be exponentially growing at that time. Just putting a market gross profit multiple on that represents a 15% return CAGR if it takes them 3 years to fully ramp. We think all of these numbers are pessimistic -- and intentionally so.
With clearance secured, demand should start flooding in. This is the lowest temperature, lowest cost X-ray machine to be cleared on the market. There’s zero reason to believe it won’t find brisk traction with the FDA’s blessing in hand.
14. Revolve Group (RVLV) – Earnings Review Coming
Revolve’s quarter was underwhelming as luxury discretionary spend struggles. We worked non-stop all week to get all of this content to readers and ran out of time here. We know this name carries little reader interest. We will publish the earnings review in next week’s edition. We have no plans to add or trim following the weak report.14. Revolve Group (RVLV) – Earnings Review Coming
Revolve’s quarter was underwhelming as luxury discretionary spend struggles. We worked non-stop all week to get all of this content to readers and ran out of time here. We know this name carries little reader interest. We will publish the earnings review in next week’s edition. We have no plans to add or trim following the weak report.
15. Macro
a) Powell Presser
Monetary policy:
Hiked policy to 5%-5.25%.
Continue to reduce the balance sheet via QT.
Removed language on more hikes and hawkish policy being expected. Will take a “data driven approach” to future policy decisions.
Will take time to assess the cumulative impact of 500 bps of hikes in 14 months.
Banking Sector:
Conditions have improved since March with the system “sound and resilient.”
SVB issues are unique to a smaller cohort of the banking sector and less systemic in nature.
Hinted at new supervision for the sector coming from the SVB turmoil.
Economy:
Powell’s base case remains slow growth throughout 2023.
Returning inflation to 2% requires more work and likely a period of below trend growth.
Interest rate sensitive sectors like housing have weakened considerably with weakening in less rate sensitive sectors expected to come this year.
Business fixed investment growth continues to weaken.
Credit conditions continue to tighten which will likely weigh on output and employment.
Employment:
Labor market remains “very tight” but with “signs of better supply demand balance” forming.
Nominal wage growth is easing with lower vacancies and more progress needed here.
Still 1.6 job openings per unemployed individual. This was closer to 2 last year.
Inflation:
Long term inflation expectations remain “well anchored.”
The main takeaway is that more rate hikes are no longer expected. The 25 bps hike was unanimous this meeting but with conversation shifting to a near term pause. The Fed will continue to assess if rate hikes bring policy to restrictive territory over time. Powell reminded us that the current fed funds rate is now where the mean terminal rate projection was for board members as of March. Following this release, JP Morgan came out saying multiple rate cuts this year are possible. The Fed’s base case remains no cuts in 2023.
The Fed is likely done raising rates; a cut this year is possible and cuts by Q1 2024 are all but inevitable. We’re far closer to the end of this tightening cycle which makes the Fed’s policy course less important for long term investing (in our view). Those decisions mattered a lot more when we debated hiking another 100 bps or 400 bps. It matters less now with the debate shifting to 25 bps or zero.
b) More Data from the Week
Output Data (above 50 = expansion)
Manufacturing Purchasing Managers Index (PMI) for April was 50.2 vs. 50.4 expected and 49.2 last month.
The Institute of Supply Management’s employment reading for April was 50.2 vs. 47.9 expected and 46.9 last month.
ISM Manufacturing PMI was 47.1 vs. 46.8 expected and 46.3 last month.
S&P Global Composite PMI for April was 53.4 vs. 53.5 expected and 52.3 last month.
Services PMI for April was 53.6 vs. 53.7 expected and 52.6 last month.
ISM Non-Manufacturing PMI for April was 51.9 vs. 51.8 expected and 51.2 last month.
The Fed’s balance sheet shrank slightly month over month (m/m).
Employment and Consumer Data
JOLTs job openings were 9.59 million vs. 9.775 million expected.
ADP nonfarm employment rose 296,000 vs. 148,00 expected.
Nonfarm payroll rose 253,000 vs 180,000 expected.
Jobless claims of 242,000 roughly met expectations.
The unemployment rate fell from 3.5% to 3.4%.
Inflation Data
Average hourly earnings rose 0.5% m/m vs. 0.3% growth expected.
News of the Week (May 1 - 5)
Such a GOOD read ❤️❤️throughly enjoyed it.
Excellent update, thanks!