
Welcome to the hundreds of new subscribers who have joined us this week. We’re delighted to have you and determined to provide as much value as possible.
1. SoFi Technologies (SOFI) -- Leadership Interview
We published a defense of the SoFi bull case after Wedbush aggressively downgraded the name for reasons we disagreed with. Well? This week, CEO Anthony Noto sat down with JP Morgan for a conference. Most of the same topics were covered and his answers were nearly identical to the explanation we provided.
Direct Deposits:
The strong deposit trends SoFi enjoyed in Q1 continued into May. CEO Anthony Noto reiterated plans to add at least $2 billion in deposits this quarter. He was expecting just 35% of new accounts to utilize direct deposit but 50% of its accounts are doing so. The company has plans to continue rapidly growing its deposit base to fund originations thanks to the “very high quality” of these deposits, its bank charter, and its conservative leverage ratios. Interestingly, these deposits are not coming from the Silicon Valley Bank debacle, they’re coming from large money center banks. That points to this trend being durable and not a temporary reaction to a systemic shock.
Personal Loans:
- SoFi continues to reject 70% of applicants and continues to tighten its credit parameters. It never got too liberal with credit bands during the pandemic boom. In other words, the rapid origination growth is not coming at the expense of credit quality.
- It continues to be able to pass on higher rates to customers. This works wonders in maintaining loan valuations as well. Its average interest rate is rising faster than benchmark yields, demonstrating its pricing power.
- Its life-of-loan loss rate continues to be FAR below its risk tolerance. It’s 4.5% vs. a 7%-8% loss rate tolerance.
- Loss curves continue to outperform as its newest loans season.
Macro:
SoFi’s guide continues to assume -2.5% GDP growth. That’s likely too pessimistic and a better result would feed its growth.
Fair Value Accounting vs. At Cost Accounting:
Noto called fair value accounting the best method for loan valuation. Why? Because under fair value, loans are marked-to-market every 3 months with those impacts being reflected on the income statement and balance sheet that same quarter. That’s not the case with at-cost accounting at other banks. Under that method, banks set current expected credit losses (CECL) upfront and adjust occasionally over time based on performance. Noto pointed out that at cost accounting frees companies to report healthy equity balances one day and be taken into receivership the next as they hadn’t recorded losses on financial statements to accurately portray capital ratios.
He corrected the Wedbush analyst who downgraded SoFi partially due to concerns of loan valuation falling because of changing loan classification from held-for-sale to held-for-investment. That change has zero impact on valuation methodology.
Finally, Noto spoke on fair value adjustment assumptions from last quarter. SoFi was criticized for raising the fair value of its loans amid soaring rates and rising risks. Two things. First, this is related to its strategy to hedge away all interest rate risk. It locks in cash flow to remove downside and forgoes some potential upside in doing so. That’s why the balance sheet loan balance impact has been so small. And again, credit quality is why the losses have been so tiny. Secondly, he told investors that its 2.97% loss rate for Q1 was assumed to rise above 4.5% based on economic outlook. That likely pessimistic forecast was part of the fair value adjustments… which again are set by a third-party firm and not SoFi directly.
On No Loan Sales Last Quarter:
SoFi’s singular goal in the holding or selling loans decision is ROE optimization. Recently, it has been able to generate a 6% net yield from holding vs. 4% for selling. With its excess liquidity and conservative leverage ratios, it has the freedom to select the best yield… so that’s what it’s doing. It did the same thing 5 years ago when rates were rising amid the 2018 taper tantrum. When conditions improved and selling yields became more attractive, it resumed loans sales once more.
Noto is fully confident in capital market demand being there to sell loans at favorable gain on sale margins. He talked about the Q1 ABS deal, exploding net interest income, low charge-offs, comparable deals and discussions with the demand side as evidence.
On the Tech Platform (Galileo + Technisys):
- Total contract value from the current “robust pipeline” is “multiples higher” than at any point during Noto’s tenure. The pipeline consists of far larger customers than what the tech segment had been pursuing and servicing in the past.
- The revenue ramp from these wins will not be immediate. It will start with moving new customers to the updated tech stack and then eventually migrating the client’s pre-existing user bases to the platform.
- The firm is confident in growth here accelerating towards 20% by end of year.
- Real time asset and liability management in light of the Silicon Valley bank issues has been a compelling selling point. Its ability to track deposits in real time and by customer segment is a small but tangible edge.
Non-Financial Services:
Noto told us to expect travel to simply be the first non-financial service offering to allow members to save on purchases and to expand SoFi use cases. He teased auto and entertainment ticketing products. He expects this vector, financial services and the tech platform to lead to more of its growth coming from non-lending segments over time.
SoFi in 5 Years:
Noto thinks the pace of quarterly member adds (currently around 400,000) could at least double by 2024. He wants SoFi to have over 20 million members 5 years from now and 40 million total products. His goal is for SoFi to be a top 10 financial institution in the USA with plans to expand globally from there (first in Latin America). It’s in Hong Kong currently, but not with the full product suite or anything close to it.
2. Nvidia (NVDA) -- FY Q1 2024 Earnings Review
This was the best large cap beat & raise I’ve ever covered. I do not own any shares. I’m just wildly impressed.
a) Results
- Beat revenue estimate by 10.3% & beat guide by 10.6%.
- Beat EBIT estimate by 19.1% & beat guide by 20%.
- Beat net income estimate by 19.4% & beat guide by 20.4%.
b) Guidance
- $11 billion revenue guidance beat estimates by 55%.
- gross margin (GPM) beat by 330 bps; EBIT beat by 93%.
c) Balance Sheet
- Stock based compensation = 10.2% of sales vs. 12.2% Q/Q & 7% Y/Y.
- No buybacks this quarter vs. $2 billion Y/Y.
- Dividend payments were flat Y/Y.
- Inventory rose 45.9% Y/Y but fell 10.7% Q/Q as levels appear to have peaked.
- $15.3 billion in cash & equivalents; $11 billion in debt (with $1.3 billion current).
d) Call & Release Highlights
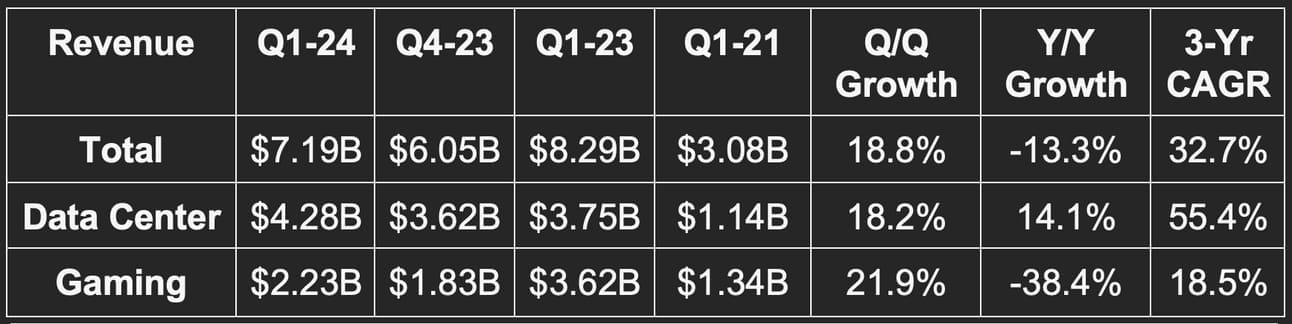
Demand Context:
- 32.7% 3-yr revenue CAGR vs. 24.8% last Q & 25.4% 2 Qs ago.
- Data center revenue powered the outperformance here as AI use cases and compute needs explode higher.
- Auto revenue was flat Q/Q and more than doubled Y/Y on a very small base of $138 million.
- Professional visualization revenue rose 30.5% Q/Q and fell over 50% Y/Y on a small base of $622 million.
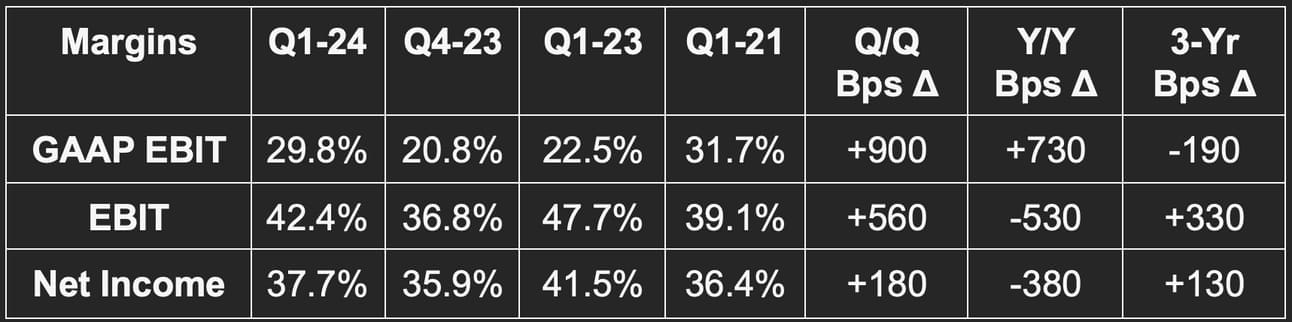
Margin Context:
- GPM was 66.8% vs. 66.1% Q/Q & 67.1% Y/Y.
- GAAP operating expenses fell 3% Y/Y despite this massive demand outperformance. Wonderful combination.
Gaming, Auto & Professional Visualization Platforms:
- Both segments are “emerging from inventory corrections.”
- Gaming demand demonstrated “resilience amid a challenging consumer backdrop.”
- Its auto design pipeline is now $14 billion over the next 6 years vs. $11 billion Y/Y.
Data Center – the AI-powered standout of the quarter:
The explosion of generative AI and language learning model (LLM) interest is vastly bolstering Nvidia’s growth. Leadership says that it has the most “versatile, energy efficiency and lowest cost approach to train and deploy AI.” The demand here is broad based. Cloud titans are all “racing” to deploy its graphics processing unit architecture in Hopper and Ampere. Jensen Huang called generative AI an “iPhone moment” and Nvidia was ready to pounce before the ChatGPT demand spike began. Its experience with building 5 of its own data centers and full stack approach also makes it an ideal partner to hold client hands and steer them to evolve in the most optimal manner possible.
- Despite players like Amazon hard at work on building its own training and inference chips, it’s still relying heavily on Nvidia.
- Meta also recently added Nvidia’s H100 GPUs built on Hopper to power its supercomputers.
- BloombergGPT and AT&T are also utilizing it along with more large enterprises than for any competitor out there.
Its next generation of H100 (called DGX) is now being shipped. This extends use cases to on-premise environments and offers firms pre-trained templates to use to fortify models with 1st party data. ServiceNow was called out as an early DGX adopter.
Beyond AI model training, model inference is another Nvidia strength facilitating this historically strong print. It sees its inference capabilities as “orders of magnitude ahead” of others with “unmatched versatility across different workload types.” Importantly, data center revenue should keep growing sequentially in Q3 and Q4. This is not just a Q2 anomaly but the beginning of a more durable demand trend. It also expects to secure a lot more needed supply to meet pent up demand for H100 and its Hopper/Ampere infrastructure by Q3.
3. Snowflake (SNOW) -- FY Q1 2024 Earnings Review
a) Results
- Beat product revenue guide by 3.4%; beat revenue estimate by 2.4%.
- Crushed $4.5M EBIT estimate by nearly $30M; crushed EBIT guide.
- Beat $0.05 EPS estimate by $0.12.
- Beat free cash flow (FCF) estimate by 54%.
b) Full Year Guidance
- Lowered product revenue guide by 4%.
- Lowered EBIT margin guide from 6% to 5%.
- Reiterated 76% gross margin.
- Raised adjusted FCF margin guide from 25% to 26%.
Next quarter EBIT margin guidance implies a material miss vs. estimates.
Despite this disappointment, it reiterated its schedule and path to $10 billion in annual recurring revenue.
c) Balance Sheet
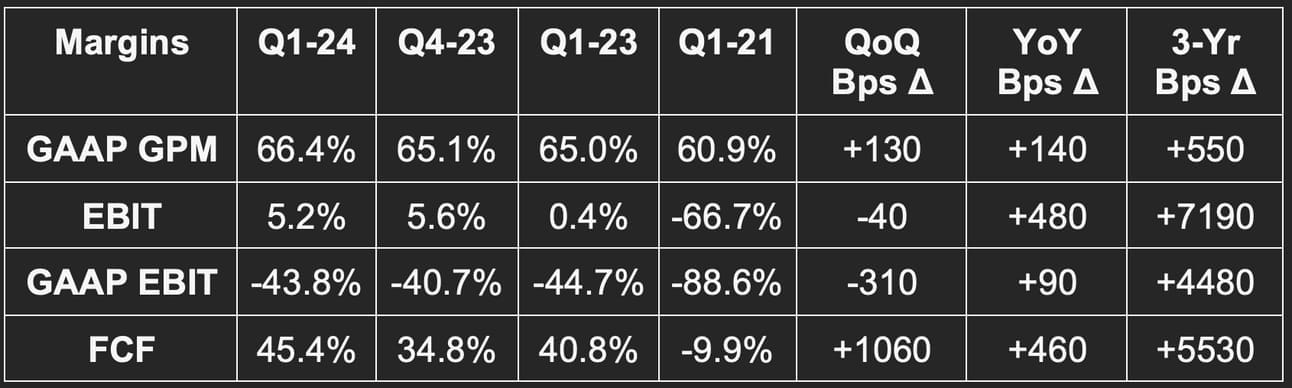
- Stock comp was 42.4% of sales vs. 42.5% Q/Q. This is quite elevated to say the least, but it did offset about 72% of that compensation with stock repurchases.
- Stock comp = 108% of total FCF generation.
- Roughly $4 billion in cash & equivalents. No debt.
d) Call & Release Highlights
Macro:
“We are operating in an unsettled demand environment and we see this reflected in consumption patterns across the board. While enthusiasm for our products is high, enterprises are preoccupied with costs in response to their own uncertainties… This may continue near term.” -- CEO Frank Slootman
Consumption was strong through March but has been weak from Easter up until now. Week over week (W/W) growth ground to a halt. Its guidance assumes W/W growth resumes but doesn’t fully recover. Snowflake attributed this slowing to uncertain macro leading customers to seek cost optimization. They’re doing so by deleting stale data. Less storage means less revenue based on Snowflake’s consumption revenue model. Some of its largest customers switched from 5-year data storage to 3 years. Data query requests are still rapidly growing at 55% Y/Y… They’re just costing customers less due to less storage and so quicker fetching.
Its consumption-based model means it’s easier for customers to add or subtract costs vs. a software as a service-based (SaaS-based) approach with more pre-set commitments. This will mean slightly more downside amid poor macro and potentially more upside when things are good.
Importantly, leadership told us multiple times that this has nothing to do with competition. Its win rates are stable. This is a matter of weaker bookings trends as customers are “hesitant to sign large deals.” Still, when a firm carries one of the most expensive valuations in the market, misses are not easily forgiven.
“Productivity is not where we want it to be… we are not satisfied with our results.” -- CFO Michael Scarpelli
As an important aside, Snowflake and AWS have significant customer overlap. So? AWS slowing to 11% Y/Y growth in April can be taken as a decent hint of demand softening for Snowflake. SNOW investors should pay close attention to AWS Q2 growth rates to gauge how pessimistic Snowflake’s guidance could turn out to be.
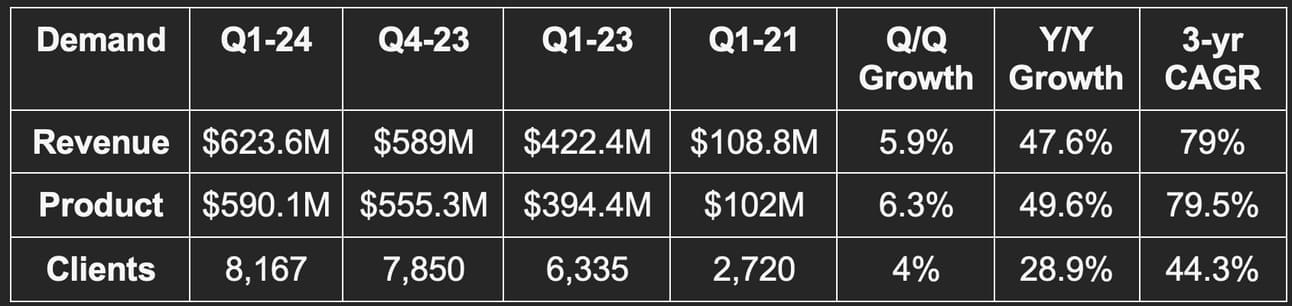
Demand Context:
- 79% 3-yr revenue CAGR vs. 88.7% last Q & 96.9% 2 Qs ago.
- 373 customers with over $1M in product rev vs. 330 QoQ & 206 YoY. It calls 590 of the Forbes Global 2000 its customers vs. 580 Q/Q and 513 Y/Y.
- NRR was 151% vs. 158% QoQ and 174% YoY. 151% is still elite.
- Remaining performance obligations (RPO) of $3.4 billion rose 31% Y/Y. 57% of its RPO is current.
Margins and cost cutting:
While poor macro persists, Snowflake will intentionally cut back on growth marketing and will slow the pace of hiring.
Snowpark:
Snowpark is a newer Snowflake tool which frees developers to write and build within Snowflake and in a wide range of source code languages. This merges Snowflake’s data storage, querying, organization and leveraging prowess with an actionable ability to utilize this insight to create applications all in 1 place. This cuts down data transference costs while fostering cohesive simplicity and productivity. It also means developers can tap into data cleansing and quality issues in real-time while they build.
30% of all Snowflake customers are already using Snowpark weekly vs. 20% Q/Q. Consumption of this service rose 70% Q/Q. Its cost advantages over alternatives like Spark were cited as reasons for this strength.
AI:
AI relies on vast quantities of data to train models and make them valuable. How do customers combine and access all of their fragmented data silos in one place? With firms like Snowflake. That, to leadership, will make it a prominent piece of the current generative AI wave. This quarter marked the beginning with Snowflake delivering 91% Y/Y growth in AI/ML customers.
Snowflake’s recent acquisition of Applica (which creates language models to “solve real business challenges and understand unstructured data”) will be a key piece of its participation. It will also acquire Neeva for its “next generation search capabilities” to enhance Snow customers’ ability to build “rich, search-enabled and conversational consumer experiences” -- similar to Bard and ChatGPT. Neeva allows this to happen with significantly less technical expertise to lower the barrier to model building. To help ease usage further, it released new standard query language (SQL) tools to power data anomaly search without “mastering data science.”
Final Notes:
- Launched a manufacturing data cloud for supply chain management. Blue Yonder (a software supply chain company) is the first to re-platform onto Snowflake for this tool.
- Gross margin strength was via more favorable cloud service provider contracts and the marketing pull-back helped EBIT margin further.
- FCF was boosted by early May receivables collections.
- There was no change in the firm’s approach to guidance. It’s not being more pessimistic than it has been in past quarters.
- Azure revenue growth is now outpacing AWS and Google Cloud for Snowflake following Microsoft naming Snowflake a tier 1 partner. It appears this relationship is becoming more & more friendly.
4. PayPal Holdings (PYPL) -- Investor Conference
On Macro Trends:
- The year continues to be off to a better start than expected with e-commerce growth assumptions rising from about 0% to low single digit % growth. PayPal’s growth is tightly correlated to this as a predominately online discretionary checkout player.
- Discretionary spending is “returning a bit.”
- Reiterated expectations for high single digit revenue growth for the year vs. original guidance calling for mid-single digit growth.
- Newer custom cohorts continue to “perform extremely well” and engage more frequently with the brand.
Margin Drivers:
- E-commerce growth re-accelerating will feed PayPal growth and allow it to extract more value from its now leaner fixed cost base.
- Cross-border volume (especially in China) is beginning to stage a comeback. This is higher margin transaction revenue for PayPal. The U.K. is even starting to show signs of a rebound which has been its weakest market recently due to the structure of their mortgage laws and spiking rates.
- The unbranded segment moving downstream with PayPal Commerce Platform (PPCP), expanding globally and adding other high margin services. This has been a key theme of PayPal’s conferences in recent weeks and its last earnings call. It has a clear line of sight to unbranded margin expansion. It expects expansion to begin later this year.
- Accelerating branded growth which is expected to come throughout the year.
Unbranded & Branded Teamwork:
Unbranded continues to perform extremely well for PayPal with a “really strong pipeline” and existing customers allocating more and more volume to Braintree. PayPal will take all the unbranded growth it can get despite the lower margin vs. branded revenue. Why? Because Braintree and PPCP come with the latest branded integrations for PayPal and Venmo branded checkout which bolsters its branded share.
PayPal’s long history means a maze of legacy integrations that need updating. Winning Braintree business gives them an easy touchpoint to implement these modern checkout flows. It has 1 out of 3 of its largest merchants on its latest flows which will reach 50% by year’s end. Its new PPCP tool for smaller businesses should expedite reaching 100% as it sells through channel partners. This mean all merchants under that single partner will be automatically upgraded to the latest and greatest PayPal/Venmo process.
On PPCP Prospects:
Schulman alluded to “massive pent-up demand for unbranded products” geared to smaller businesses. That’s what this is. He repeated sentiment around the old version of this (PayPal Pro) being “completely insufficient to address market needs.” PPCP, conversely, is “state of the art.” He expects this to be “one of the most successful product launches it has ever had” and compared his excitement to the BNPL roll out which rapidly rose to top 3 in the world despite a large head start for other players.
Venmo:
Teen accounts on Venmo are now live. This adds millions of potential users to its addressable market with a large chunk of those potential customers already having parents with a Venmo account.
Apple Pay:
PayPal saw its checkout preference and adoption rise from 2021 to today at roughly the same rate as Apple Pay. It outpaced Apple Pay in 2022 but is slightly lagging behind so far in 2023 according to Schulman. This performance would shock investors if they paid close attention to the growing FinTwit narrative of PayPal being a dinosaur. Not only are Venmo and Braintree not dinosaurs, but legacy PayPal also isn’t either. This preference is being powered by its omni-channel ubiquity and the fact that the world is split between iOS and Android. PayPal offers a unifying layer for both. It offers more checkout options than anyone else and sees no quality gap between its latest checkout integrations vs. any other products on the market. Not Shop Pay, not Google Pay, not Apple Pay… nobody.
Still, PayPal’s main source of competition isn’t other digital wallets, it’s other antiquated forms of checkout. 65% of checkout volume still uses manual data entry or card on file by single merchant. Digital wallets are more convenient and utilitarian vs. these other options. Digital wallets will keep taking share and branded PayPal is positioned to benefit.
Next Generation Checkout:
PayPal’s password-less, 1 click next-gen checkout is now rolling out to a select group of merchants. Its massive consumer scale means massive data scale and a massive card vault to store data and remove the need for customers to enter any data manually. All they need to do is verify their identity with duo authentication. Schulman said the team showcased this at a closed sales conference with “huge excitement.”