

News of the Week (November 6 - 10)
News of the Week (November 6 - 10)
Duolingo; Progyny; Datadog; Celsius; Hims; Axon; Robinhood; Upstart; Toast; Amazon; Meta Platforms; Lemonade; Disney; Macro; Portfolio

Today’s Piece is Powered by my friends at StockOpine:

1. Duolingo
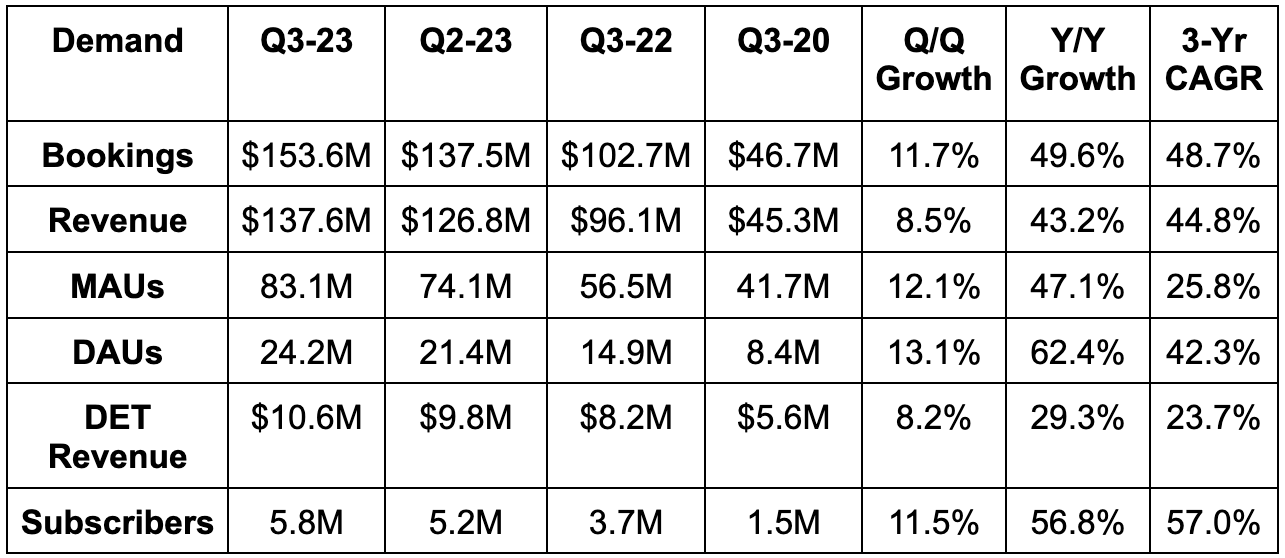
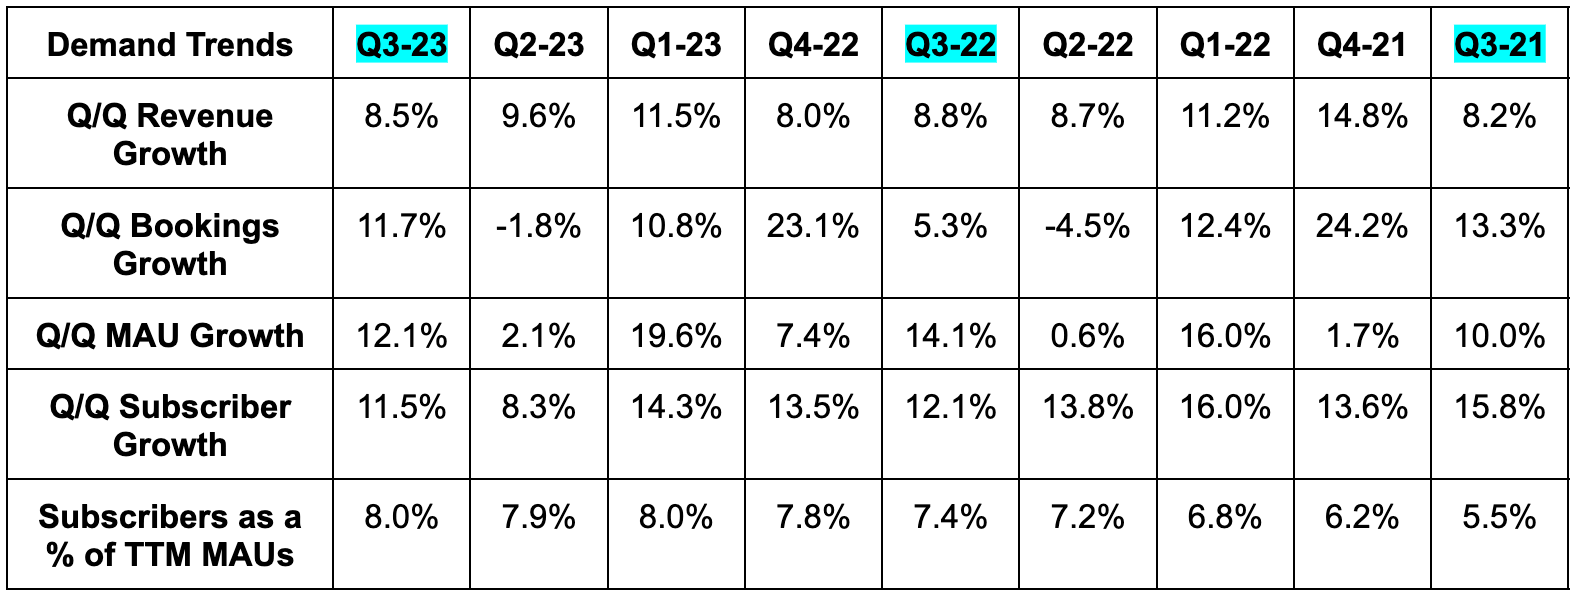
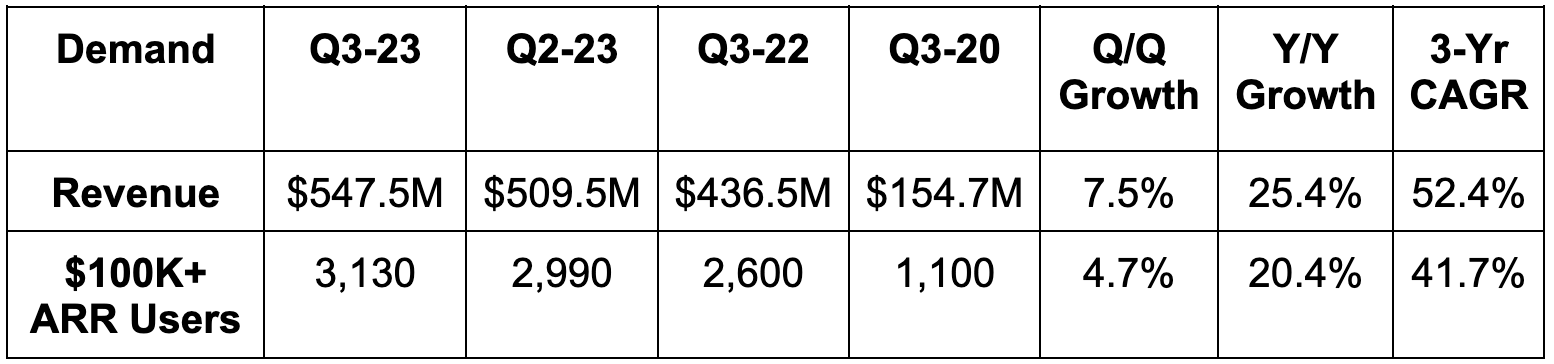
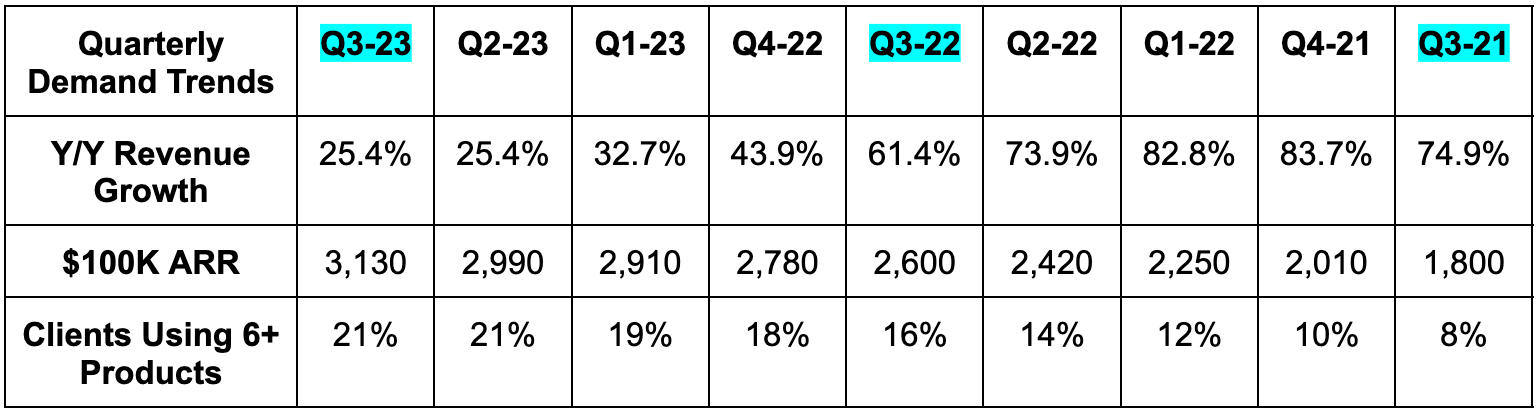
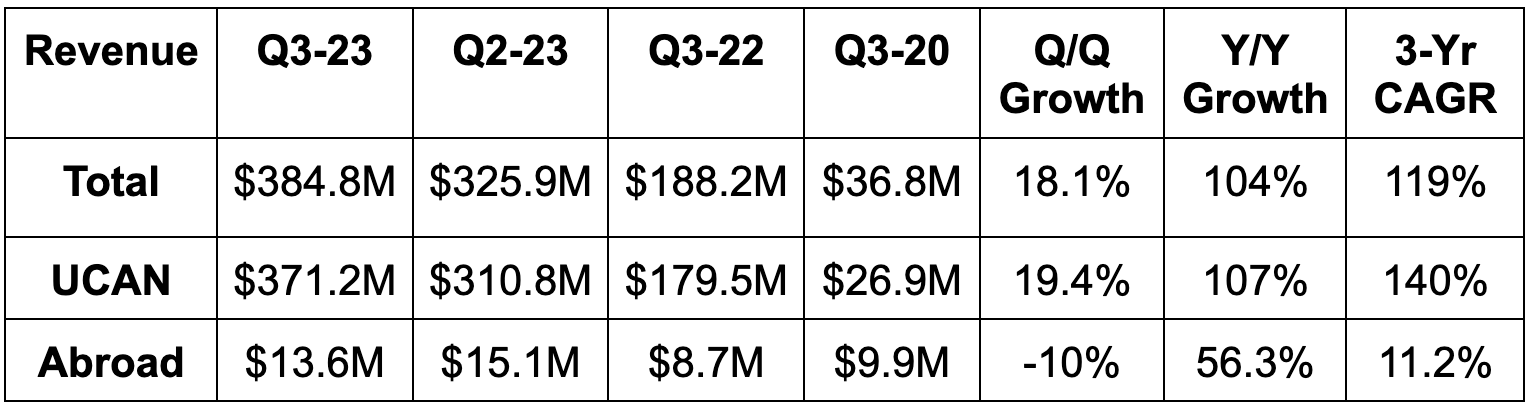
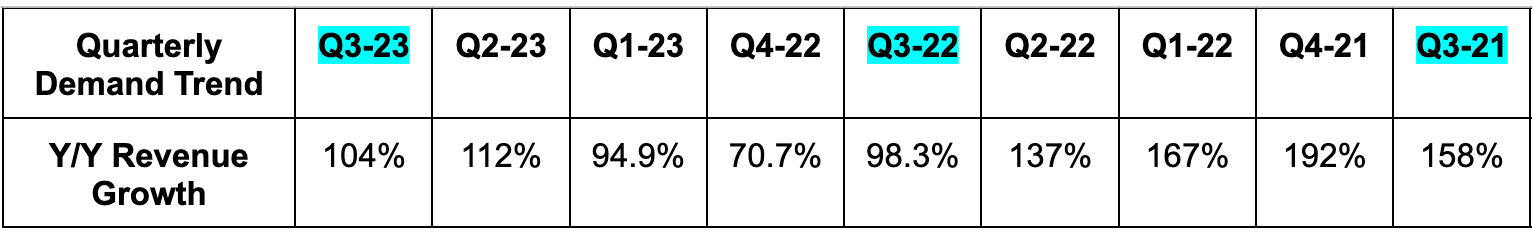
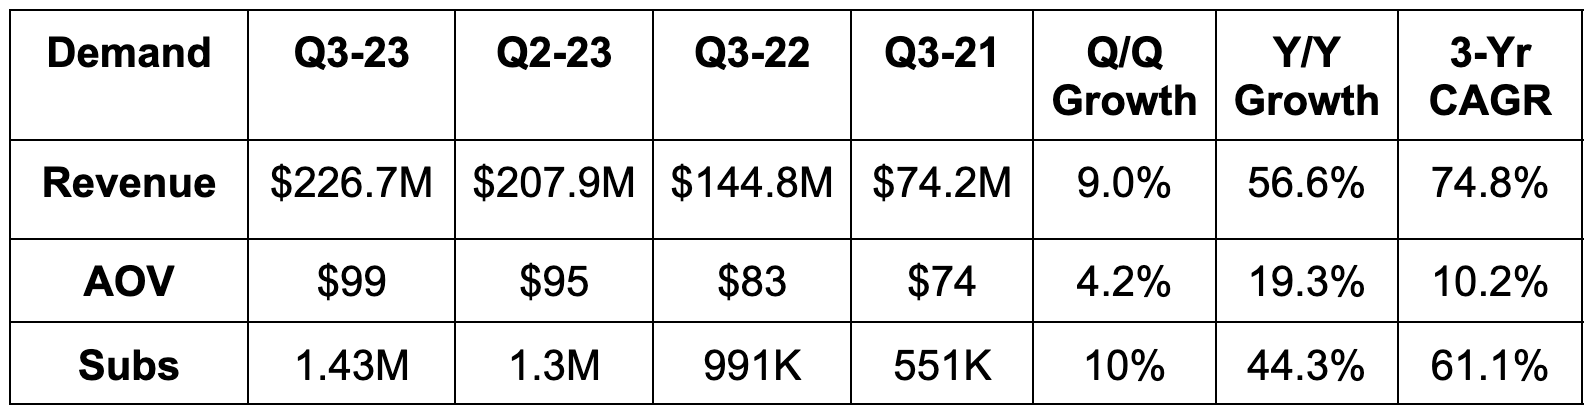
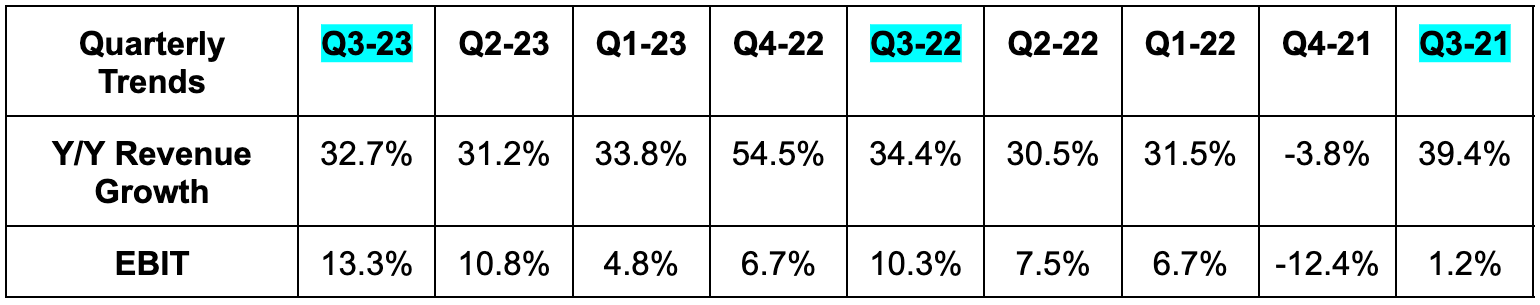
a. Demand
Beat bookings estimates by 11.3% & beat bookings guidance by 11.3%.
Subscription revenue rose 47% Y/Y.
Advertising revenue rose 10% Y/Y.
Duolingo English Test (DET) Revenue rose 30% Y/Y.
Other Revenue (in-app purchases) rose 86% Y/Y.
Beat revenue estimates by 4.2% & beat revenue guidance by 5.0%.
The 44.8% 3-year revenue compounded annual growth rate (CAGR) compares to 46.9% Q/Q & 60.3% 2 quarters ago.
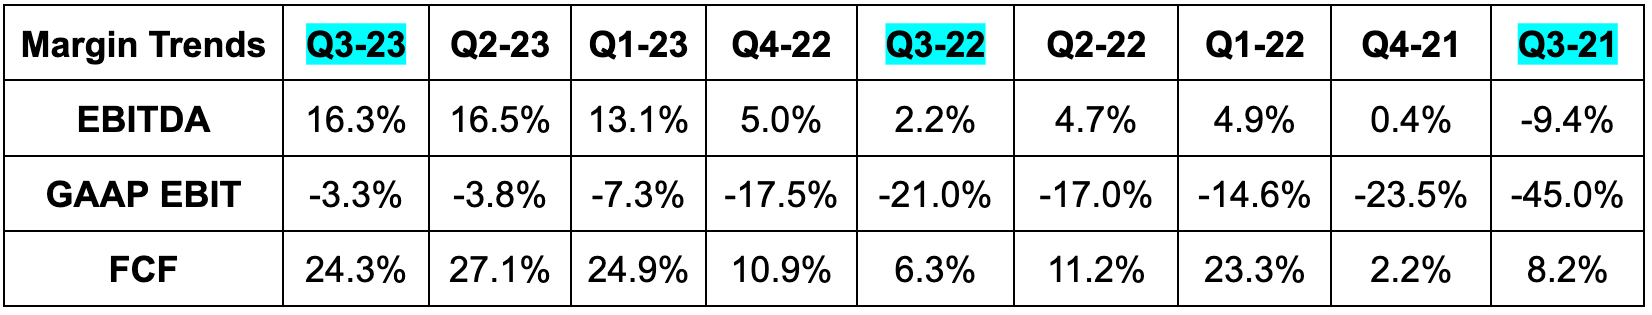
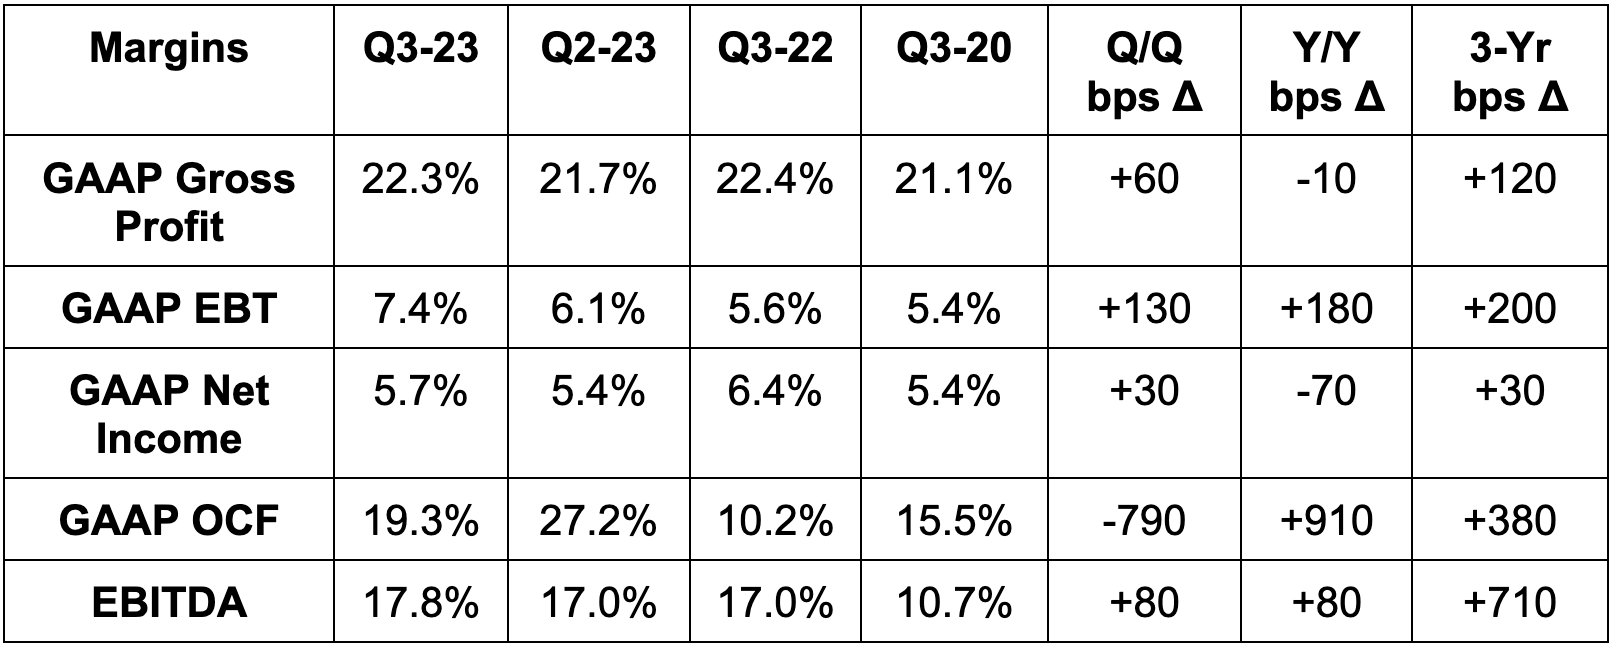
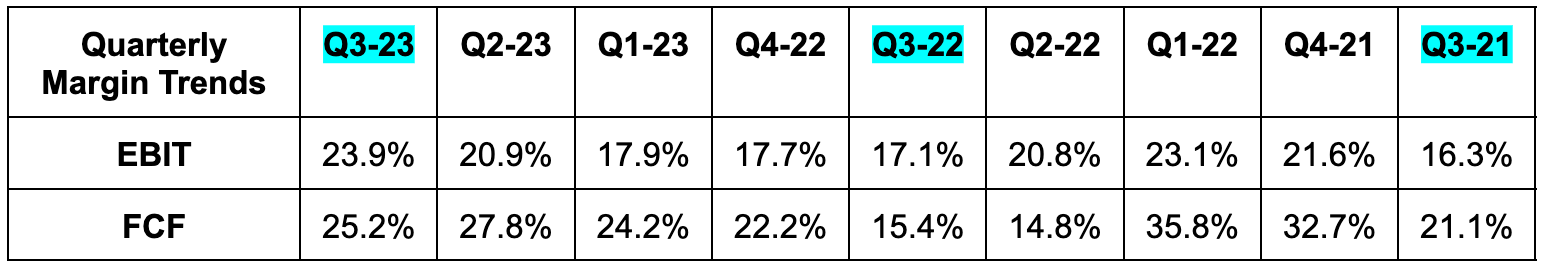
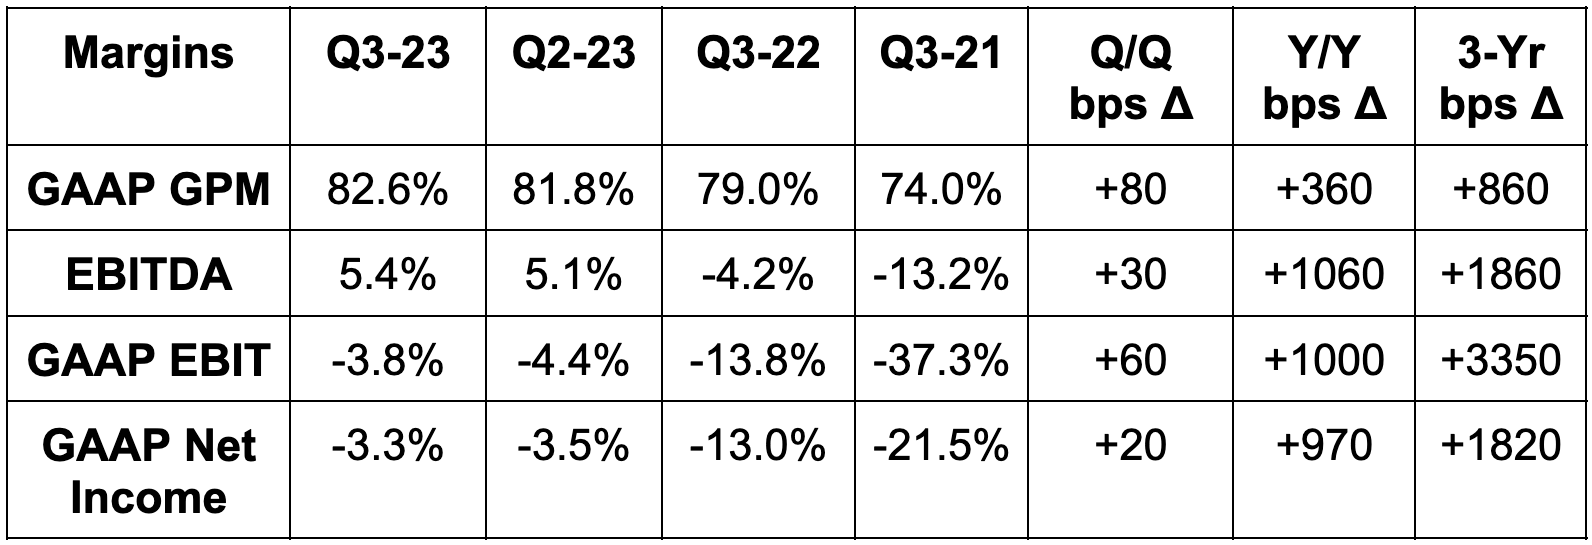
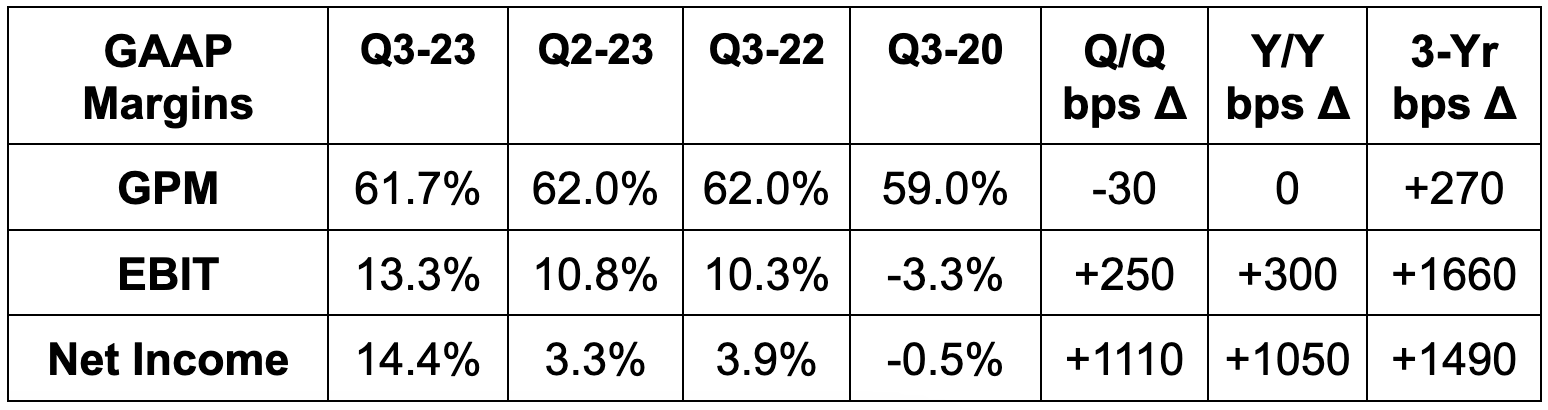
b. Profitability
Beat EBITDA estimates by 20% & beat EBITDA guidance by 27.1%.
Beat -$0.12 GAAP earnings per share (EPS) estimates by $0.19. GAAP EPS positive for the first time thanks to interest income. But that’s the luxury of a pristine, debt-free balance sheet and strong cash flows.
It also beat GAAP EBIT loss estimates by more than 50%.

c. Guidance
Duolingo materially raised its full year guidance across the board. This was not solely powered by Q3 outperformance, but also expectations of outperformance in Q4. Specifically, for Q4:
Beat bookings estimates by 6.9%.
Beat revenue estimates by 3.6%.
Beat EBITDA estimates by 33.0%.
d. Balance Sheet
$700 million in cash & equivalents. This is approximately 8% of its market cap.
No debt.
Share count rose by 5% Y/Y. This is being heavily influenced by IPO-related awards and must slow. Thankfully, it is fully expected to do so as the firm has consistently guided to 2% annual dilution. It actually lowered this dilution guidance to 1.5%. Good news.
e. Call & Letter Highlights
The Learning App:
Duolingo is evolving from a language learning app to a general learning app. While Duolingo’s revenue represents less than 1% of the current total addressable market, it has broader ambitions than language learning.
It already launched Duolingo ABC for literature, Duolingo Math and just launched Music courses too. Importantly, all of these new courses will be integrated into the central Duolingo app we all know and love. This consolidation, it thinks, will drive greater user value, faster scaling, better engagement and more success overall. It will allow the firm to more quickly borrow insight from the core language courses.
Split Testing Machine:
Split testing means testing a single variable within a user experience with two options to see which is better received. It could be as simple as making a button green or orange to observe which is better for engagement.
Duolingo continues to generate almost all growth organically and continues to vastly outperform across the board. But if external marketing isn’t driving this fabulous success, what is? A fixation on product iteration and perfection. This company is a split testing machine as it’s constantly testing various pieces of the user experience (UX) to directly observe what works and what doesn’t. This leads to a more engaging product, more word-of-mouth growth and less reliance on paid user acquisition. With its unmatched dataset within language learning, this is an edge that it can continue to leverage. Its award-winning, viral and hilarious social media presence certainly helps too.
But when it does sparingly lean into marketing, campaign iteration via ample split testing is working wonders too. As an example, the firm’s back to school campaign this year delivered 50% more user growth than the Y/Y period with flat Y/Y costs. That is not a typo. Split testing refines everything they do and drives incredible improvements. It’s one thing to guess what will be effective… it’s a better thing to observe what actually is. Duolingo observes and reacts.
Duolingo Max:
Duolingo’s new premium subscription called Duolingo Max is slowly being rolled out to users. It’s seeing “increased usage” of the AI features meant to differentiate that tier from other paid tiers.
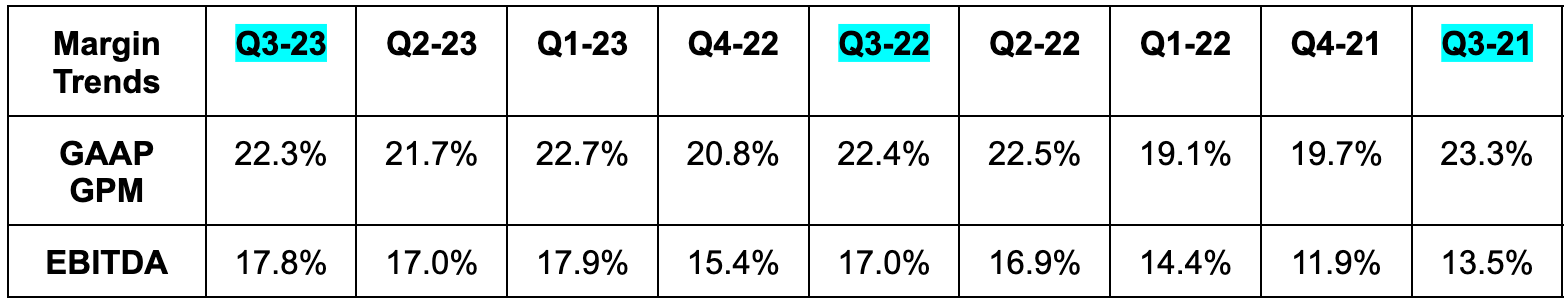
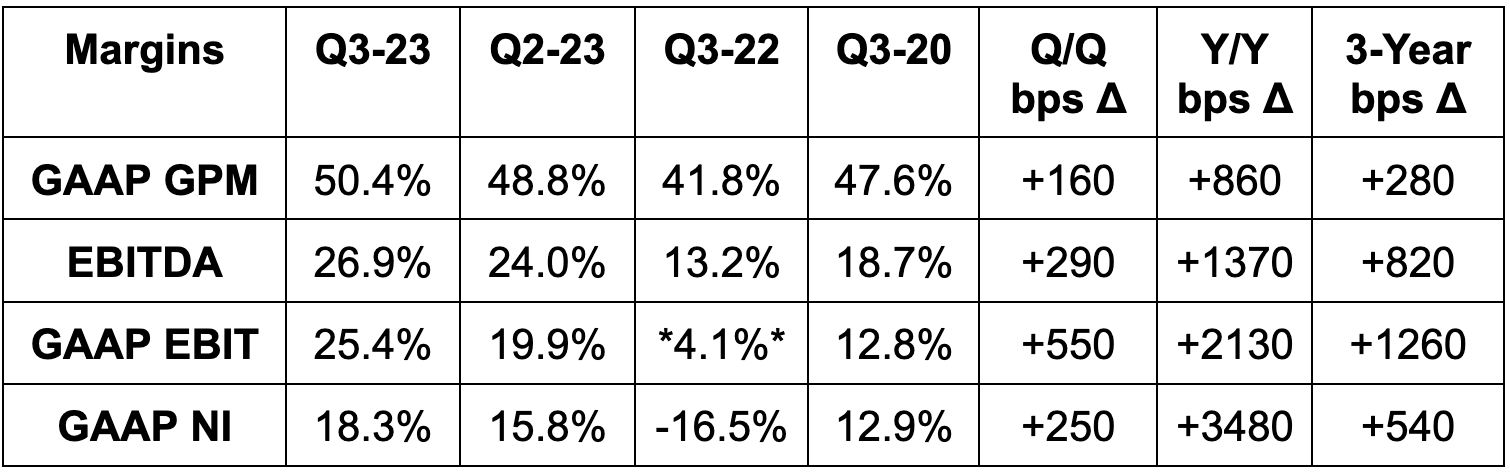
Margins:
Duolingo capitalized some incremental R&D costs this quarter vs. the Y/Y period related to its new apps and subscriptions. EBITDA margin would have ~only~ expanded by 1200 bps Y/Y without this help.
Gross margin was helped by lower 3rd party payment processing fees and price hikes for Duolingo English Test. Weak advertising demand was a gross margin headwind during the quarter. Within operating expense buckets, the company enjoyed significant leverage across the board in both GAAP & non-GAAP terms.
Of the $26 million in stock-based compensation, about $7 million was from pre-IPO founder awards. These count as stock comp dollars even if share price targets needed for this comp to vest are never realized. That reality is another reason why I prefer tracking share count growth over stock compensation dollars.
Revenue per Subscriber:
Revenue per subscriber fell by around 8% Y/Y. This was due to better-than-expected user acquisition in lower priced countries as well as foreign exchange headwinds. It is also related to regional pricing changes implemented last year. The firm had one fixed price across all countries. It changed that pricing structure to mirror the GDP of each individual country. It will lap this pricing change next quarter and expects revenue per subscriber growth to resume in 2024. It will also ”experiment with raising prices over time.”
e. Take
The quarter was flawless as we’ve been groomed to expect since Duolingo went public. The execution is admirable to say the least and there’s no slowdown in sight. With all of that said, this is still a very expensive name. Even after large sell-side upward profit revisions, it’s still expensive at 73x 2023 earnings. Not egregious, but expensive. As I sit on 130%+ profits, it feels prudent to take some off the table. So I did. I view this firm in a very similar light as Shopify and The Trade Desk. All are elite companies with valuations that sometimes get out of hand. When that happens, I will trim as I’ve done with all 3 names this year. When the flip side happens (like with TTD this quarter), I will look to add. Another perfect quarter. Go owl go.
2. Progyny (PGNY) – Earnings Review
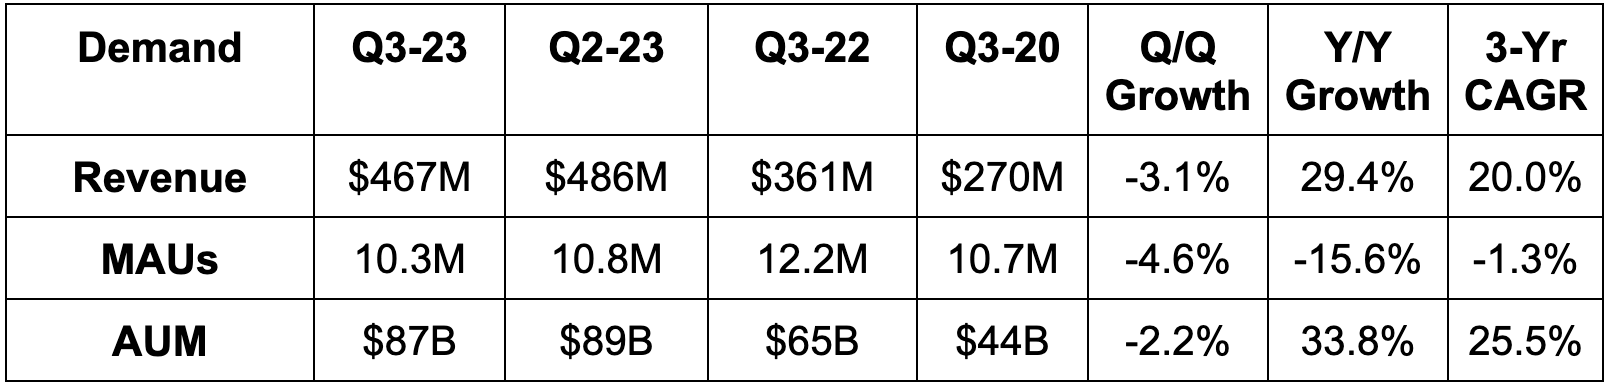
a. Demand
Progyny beat revenue estimates by 3.5% & beat guidance by 3.8%. Its 41.6% 3-year revenue CAGR compares to 62.9% Q/Q & 47.2% 2 quarters ago.
Note that member growth experienced a uniquely tough comp. In Q3 2022, Progyny added an abnormally large chunk of early covered lives in the range of 250,000. This threw off typical seasonality for the quarter.

b. Profitability
Progyny beat EBITDA estimates by 8.9% and beat its EBITDA guidance by 9.9%. It also beat GAAP earnings before tax (EBT) estimates by 42%.
Its incremental EBITDA margin was 19.9% vs. 17.3% Q/Q & 21.7% Y/Y. This directly points to more leverage ahead.
Its $0.16 in GAAP earnings per share (EPS) was $0.05 ahead of estimates and $0.07 ahead of its guidance.
EPS and net income rose by 23.1% Y/Y despite a $5 million tax charge vs. a $1.7 million tax benefit in the Y/Y quarter. With the same tax impact Y/Y, EPS would have risen by 71% Y/Y.
c. Guidance
Progyny’s Q4 guidance was 0.8% light on revenue and 5% light on EBITDA. It was in line with estimates on GAAP EPS. Importantly, full year guidance was raised across the board. This points to the “Q4” miss being more related to timing of revenue and profit recognition than anything. It makes the large Q3 beat a tad less impressive, but still impressive.
Progyny expects to add 85+ new clients to reach “at least” 460 in 2024. It also expects to add 1.3 million covered lives for 2024 with near-100% client retention. This represents 24.3% Y/Y client growth as well as 24.1% Y/Y member growth. Analysts were expecting 474 clients for 2024 with this guidance keeping that firmly on the table. It usually adds a handful of smaller clients that go live early during that same year. Analysts were also expecting 6.4 million covered lives with Progyny’s guidance about 4.2% better than that estimate.
Importantly, 300,000 of these members are from its first federal government agency. This deal includes only its patient care advocates and case management. Meaning? It will come with a lower revenue contribution during year one with Progyny optimistic that it can up-sell more services thereafter. This revenue will also be higher margin than the rest of its business. Without this help, member guidance was roughly in line. But again, Progyny generally adds more clients and members within a given year. It’s not solely last year’s selling season that feeds next year’s growth for the firm.
Margins will fall Q/Q in the fourth quarter as it adds the talent needed to support all clients going live in 2024. This is typical.
The Q4 revenue guide, conversely, represents negative Q/Q growth which is different from last year. This bothered me, but I reached out to my contact with the firm to clear things up. The abnormally large batch of early go-lives in Q3 2022 impacted seasonality. When a client launches, it takes a while for coinciding members to work through courses of treatment. These members also start with lower dollar services (like diagnostics) vs. higher-value treatment. The development of cycles takes time. So? Because so many early launches happened in Q3 2022, Q4 2022 revenue was abnormally high. The same abnormally large early-go-live factor played out in 2019; the pandemic threw off seasonality in 2020 and 2021 via clinic closures and subsequent re-openings. This is Progyny finally getting back to normal seasonality. And again, the full year raise is really what I care about.
d. Balance Sheet
$336 million in cash & equivalents. This is over 10% of its entire market cap.
Share count rose 1.0% Y/Y.
No debt.
e. Call & Release Highlights
Overall demand environment & wrapping up the 2023 selling season:
Member engagement remains healthy as family building remains a top priority for younger employees. Progyny’s better treatments with 7 years of growing outcome leads, better cost structure, better support and better specialist network is all helping to continue to drive robust demand. Secular tailwinds like the later age of average pregnancy and rising same-sex marriage rates are helping too. Its value proposition is best in class in an industry ripe for improvement and growth. Good spot to be in.
“Given the results of the sales and renewal season we just completed, we are entering 2024 well positioned to deliver another strong year of growth.” – CEO Pete Anevski
Competition seems to be falling further behind. Anevski thinks the sector is getting “less competitive” as “known losses were way lower than last year.” It continues to briskly take more market share.
Labor Market Health:
As the team has told us would be the case, it’s seamlessly overcoming layoff headwinds from 2023. Meta, Microsoft, Amazon and several other giants are all Progyny clients who have conducted large layoffs to right-size the cost base. This led to investor concern about its membership growth. Just like we were told, the hit from these layoffs was as expected and more than offset by non-tech clients adding more employees.
Domino Effect:
Progyny leadership constantly talks about a domino effect for its industry penetration. After it lands a bellwether from a certain sector, competition generally follows suit to ensure they remain competitive in talent recruiting. This year, winning its first sports team soon led to it winning an entire sports league. It’s also gaining rapid traction within labor union populations after landing its first contract there last year. Today, it has clients representing 46 sectors overall.
Up-Selling:
Up-selling momentum continues. Its new clients went with 2-3 treatment cycles per employee on average which is consistent with previous years despite heightened budget focus. Notably, 20% of existing clients are adding more services for 2024 vs. 25% doing so last year. This decrease is simply because its Rx penetration is now much closer to 100%. 98% of its new clients selected ProgynyRx for its highest attach rate ever. In 2024, its overall Rx attach rate will rise to a new record of 93%. It just keeps climbing. This is why it’s so important that Progyny not only fosters better outcomes but also cuts significant costs. Its better practices mean less NICU usage, less treatment per fertilization and better adherence to fertility meds. All of this helps Progyny outperform when times demand budget scrutiny like right now.
Its pre-conception, maternity support, postpartum and menopause offerings will go live in 2024 to create more up-selling potential. Its male infertility product just recently went live this year.
Today’s Not-Nows are Tomorrow’s Wins:
Progyny’s “Not-Nows” are clients that want to launch but aren’t yet ready to do so. The proportion of not-nows in its selling season this year may have ticked higher. It was unclear in the call if that rate was steady or modestly elevated. Either way, this is not a concern considering robust 2024 member and client guidance.
Not-now motivation is (or might be) elevated because of a few items. First, poor macro leads to sales cycle elongation and budget tightening. Progyny, with the non-discretionary nature of its service, is insulated but not immune from this. Furthermore, this budget tightening trend is coinciding with an explosion in weight loss drug demand. This means another priority for employers to gauge in a growingly complex balancing act. Benefit plans have finite budgets.
“Even with these factors, we’ve seen fertility remain a significant priority as we enter 2024 with meaningful tailwinds behind us.” – CEO Pete Anevski
Whatever it is… again… it’s not concerning even if the rate did tick higher. Why? Every year, Progyny’s not-nows represent a large chunk of its client wins in the following year. We have years of evidence pointing to not-nows actually being not-nows rather than not-evers. In 2021, it cited this same factor due to pandemic issues and that backlog converted into accelerating client growth as forecasted. It expects 2024 to be no different with most early client wins coming from this bucket.
“We have a very healthy pipeline of advanced opportunities… pipeline is larger than a year ago which is really positive.” – CEO Pete Anevski
Margins:
Progyny continues to generate operating leverage within the general & administrative (G&A) cost bucket. Specifically, G&A was 10.5% of sales vs. 11.5% Y/Y. More leverage here is expected to come. This is powering Progyny’s 20%+ incremental EBITDA margin expectation for 2023. That expectation offers concrete evidence of more overall margin expansion to come.
The income statement leverage is more telling and relevant than cash flow statement leverage. Operating cash flow is being positively influenced by new Rx contracts changing cash collection seasonality. I do love more free cash flow, but this needs to be called out.
f. Take
Great quarter. The Q4 revenue number is the lone weak spot which becomes somewhat meaningless given the strength of 2023 and 2024 overall. I care more about 8 quarters than 1. The sector is big enough to support rapid growth for years to come while not being too big to invite more competition. It’s a great spot for Progyny as the employer cost, employee cost and patient outcome leader. Rock-solid execution from a talented team with a defensible value prop. I added following the negative stock price reaction.
StockOpine is one of my favorite fundamental analyst shops. Their newsletter fixates on quality stocks that exhibit robust financials and a defensible moat. The goal is not to sell you anything or to convince you of anything either. It's for stock picking inspiration. StockOpine provides you with the tools, information and bias-less feedback needed to make an informed investment decision.
Better yet, they do so in a fraction of the time that it would take on your own. Their work is delivered in an elusively noise-free manner with carefully curated content to surface only the most compelling ideas. You could say that I'm a fan, and I don't use that word lightly. Sign up here for 2 in-depth reports per month, investment case descriptions, earnings reviews, portfolio updates and more... you will not regret it.

3. Datadog (DDOG) — Earnings Review
For those of you who follow this closely, last quarter was ugly. Macro headwinds were blamed while others cited improvement with those headwinds. Some were understandably concerned. Fast forward to this quarter, and things are looking so, so much better. Great results. Let’s dig in.
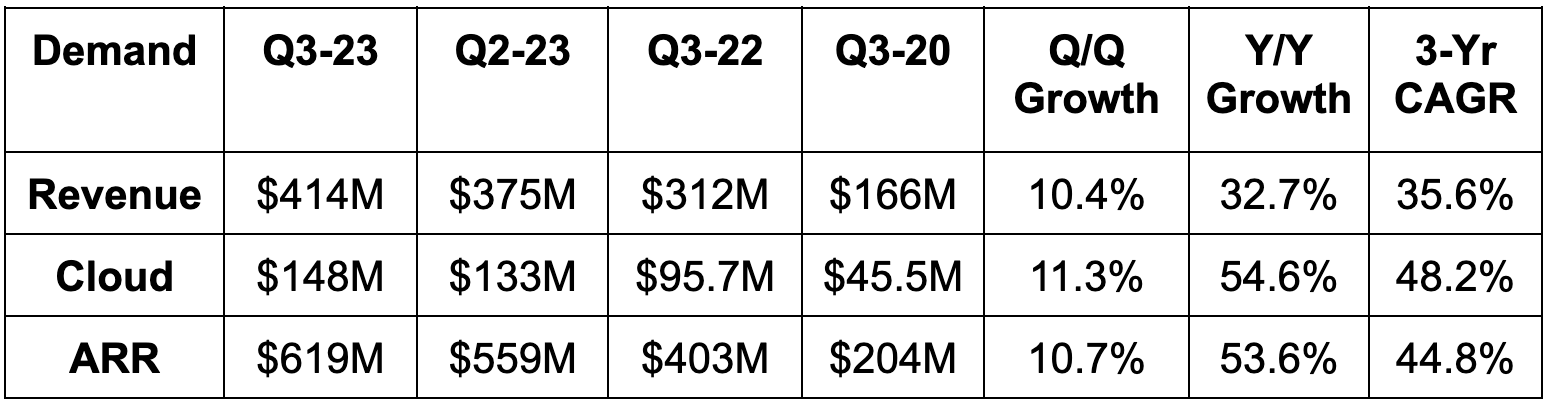
a. Demand
Datadog beat revenue estimates by 4.4% & beat its revenue guidance by 4.7%. Its 52.4% 3-year revenue CAGR compares to 53.8% last quarter and 54.2% 2 quarters ago.
b. Profitability
Beat EBIT estimates by 30.2% & beat EBIT guidance by 30.8%.
Beat $0.34 EPS estimates & its same guidance by $0.11 each.
Beat FCF estimates by 67%.

c. Fourth Quarter Guidance
Beat revenue estimates by 4.0%.
Beat EBIT estimates by 27.2%.
Beat $0.34 EPS estimates by $0.09.
d. Balance Sheet
$2.3 billion in cash & equivalents.
$740 million in senior convertible notes due in 2025.
No debt.
Share count rose by 3.0% Y/Y.
e. Call & Release Highlights
Demand & Macro:
Datadog enjoyed “robust” new logo bookings. Product usage growth for Q3 rebounded vs. Q2 and resembled more normal levels of demand. Q2 is looking like it was an anomaly. The team is seeing clear signs that cloud optimization is moderating. The headwind is not gone, but its “breadth and intensity are moderating.”
As seen in the firm’s 6+ product adoption trend, Datadog is transforming into a platform play within DevSecOps (Development, Security and Operations infrastructure). Its ability to consolidate and replace point solutions on its platform is both a cost saver and value builder. That’s how companies like ServiceNow outperformed this quarter and is how Datadog did too. Point solutions are not working in this cost-obsessed world we live in. This platform approach is working. It signed 4 deals in the 7-figure range during the quarter. All 4 replaced multiple point solutions (12 were replaced in one deal) and enjoyed better customer service, infrastructure maintenance, innovation and cost. That’s the formula here as Datadog enjoyed another record quarter for $100,000+ customer adds. Trust the process? No. Trust the platform.
“The use of our cloud cost management product plays a large role in delivering cost performance and efficiency improvements.” – Datadog CEO and Co-Founder Oliver Pomel
The 3 Pillars of Observability:
Datadog is a new name in the coverage network for me. I wanted to spell out the various pieces of its niche to set the table for future coverage. Observability simply refers to the ability to monitor an entire software ecosystem to track issues, vulnerabilities and performance. It further splits this Observability niche into 3 smaller buckets: Infrastructure Monitoring, Log Management and Application Performance Monitoring (APM).
Infrastructure Monitoring: Provides a holistic view of assets like servers and networks. It automates the collection of traffic and overall usage insights. That means it can expediently fix and uncover infrastructure issues.
Log Management: Consumes “timestamped records of events” occurring across the entire infrastructure. These logs are organized and utilized within Infrastructure Monitoring and other use cases to identify things like customer service issues.
This product routinely supports infrastructure monitoring, BUT there’s a key difference between the two. Log management handles event-based data while Infrastructure Monitoring (as the name indicates) handles infrastructure-based metrics.
Application Performance Monitoring (APM): Tracks app performance and uncovers/prioritizes performance issues to be remediated.
Infrastructure monitoring surpassed $1 billion in annual recurring revenue (ARR), the APM product suite crossed $500 million in ARR and log management crossed $500 million in annual revenue as well.
Within the APM suite, Datadog introduced a new tool. It allows software engineers to unlock APM “across all apps without core changes to operations.” This should accelerate traction considering the diminished friction it should deliver.
Within log management, its Flex Logs product was called out as a highlight. Per Datadog, this allows for easily scaling storage and computing in a parallel, independent manner. It’s a similar concept to headless commerce for Shopify, which allows for the separation of front and back-end maintenance. This separation, in both cases, unleashes far more data scalability, customization and cost optimization for clients.
Product Breadth:
An obvious expansion of DataDog’s use cases is movement into cloud maintenance and security. It already handles network viability which makes this quite the adjacent and relevant growth vector. Products like Cloud Infrastructure Entitlement Management (CIEM) for example ensure identity controls are strict and minimum access permissibility is in place. It diminishes risk of identity attacks in a cloud environment. Its Security Information and Event Management (SIEM) product allows for “long term data log visualization for security investigations.” DataDog is actively tearing down what had been siloed products within Development, Security and Operations (DevSecOps). It wants to do all three for its clients.
Generative AI:
Datadog estimates that about 2.5% of its total ARR is from AI native customers. These are the main users of its Gen AI products today. As a data observability tool, Datadog is poised to benefit from GenAI without any work. Large Language Models (LLMs) are massive consumers of data and compute infrastructure, which should be a nice overall demand tailwind for Datadog’s services. But it’s also creating tools to directly benefit from this wave. It’s building custom LLMs and infusing GenAI wherever it can across its suite. Bits AI, for example, is an assistant that gleans insight from customer behavior to resolve issues more quickly.
Serverless Containers:
Serverless containers refer to containers that are managed by a public cloud provider. A container is a software package. The public management enhances the firm’s access to needed data for better customer support. The removal of self-managed infrastructure requirements also frees up time and budget to create more apps. That helps Datadog too. 46% of containers are now server-less vs. 31% Y/Y as the move to hyper-scalers continues. This benefits Datadog.
f. Take
What a bounce-back quarter this was for Datadog. There’s absolutely nothing to pick at in these numbers. Congratulations to shareholders who stuck with this name. Every great company has a bad quarter here and there. When these bad quarters become a frequent trend rather than an anomaly is when to be worried. There’s no trend to worry about here.
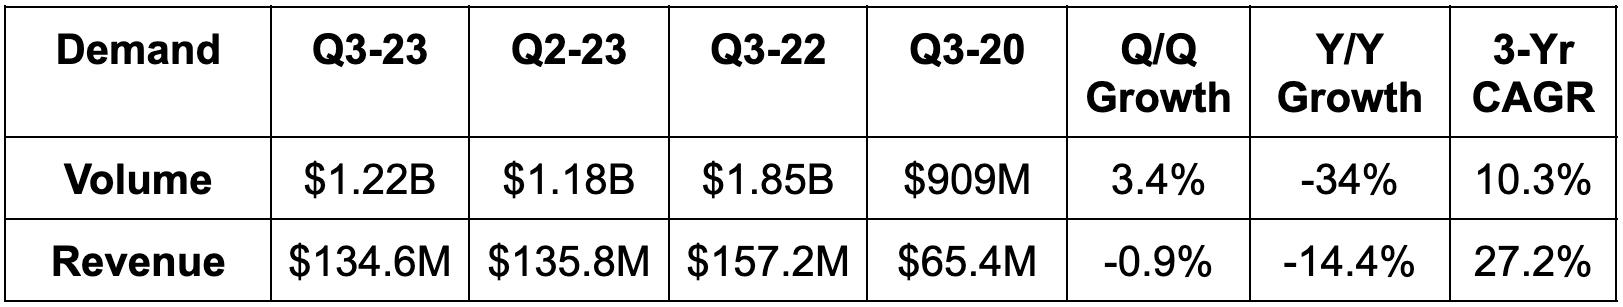
4. Celsius Holdings (CELH) – Earnings Review
Celsius sells energy drinks.
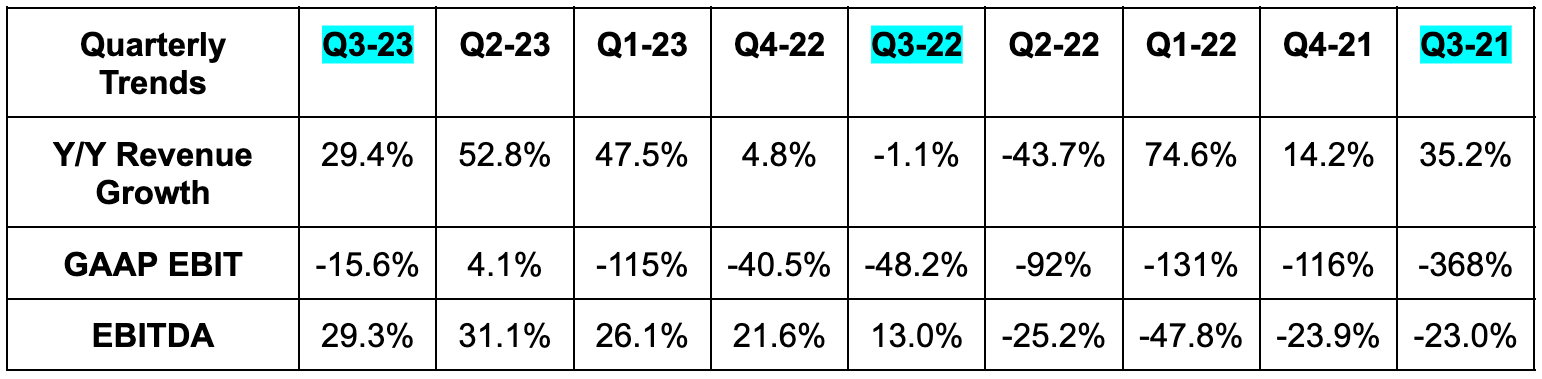
a. Demand
The firm beat revenue estimates by 9.5%. Its 119% 3-year revenue CAGR compares to 121% Q/Q & 110% 2 quarters ago.
b. Margins
Beat EBITDA estimates by 61%; Beat GAAP EBIT estimates by 65%.
Beat GAAP gross profit margin (GPM) estimates by 430 bps.
Beat $0.51 GAAP EPS estimates by $0.38.

c. Guidance
The firm doesn’t offer formal guidance. On the call, leadership did tell us that Q4 inventory partners (Pepsi) may be a bit more conservative than they normally are. This is due to a buildup of inventory within its primary distribution partners during this quarter. It also said that the pattern it’s seeing could just be typical Q4 seasonality. We shall see.
d. Balance Sheet
$760 million in cash & equivalents.
No debt.
Shares up 1.6% Y/Y.
e. Call & Letter Highlights
Domestic Demand:
Celsius continues to outperform the category by a mile and a half. It’s now number one on Amazon with 21.4% market share vs. 18.5% just one quarter ago. It’s the fastest growing brand within multi-outlet + convenience (MULO+C) in the USA in terms of dollar and unit growth. Overall, it owns 10.5% of the U.S. market vs. 4.4% Y/Y. Its trailing 12-month growth of 144% compares to 28% Y/Y for the category. For an idea of where market share can go, consider the most mature South Florida market. There it has 24.1% market share vs. 17.7% Y/Y. It expects other markets to eventually approach these levels.
Growth is broad-based across all channels. Club revenue rose 83% Y/Y, Amazon sales rose 42% Y/Y and it claimed the top share position on Instacart for the first time.
Other channels like foodservice, universities, hospitals and all others continue to rapidly grow as well. The brand is now available in 2,000 Jersey Mike’s locations and will be in 3,000 Dunkin Donuts stores in the coming quarters.
Convenience store revenue is… you guessed it… also rapidly growing. It grew by 96% Y/Y which marks a material acceleration from 73% Y/Y growth in Q3 2022.
The Pepsi partnership is clearly working like a charm. Celsius gets world-class manufacturing and distribution support while Pepsi gets a piece of the most attractive brand in the space.
International Demand:
Celsius is gearing up to fully launch across Canada. It has dabbled in some international markets, but really has not put any distribution or promotional effort into it until now. It will enter a “handful of new countries” in 2024. These will likely be Canada, Western Europe and/or Mexico.
International revenue growth is showing signs of life at 58% Y/Y. This is thanks to rising brand awareness even before Celsius leans into these markets.
Sports Drinks:
Celsius just launched “Celsius Essentials.” This is a sports drink with caffeine, essential aminos and more. This market is nearly $30 billion in size and traction here would be another welcomed growth vector to join its energy niche.
Margins:
The explosion in gross margin is being powered by lower package and raw material costs, less waste and lower freight rates. Less promotional intensity is helping too. The rapid expansion in other margin lines was helped by a couple of unique items. Sales & marketing leverage benefited from a lack of legacy distributor termination charges. It incurred these charges last year as it transitioned to Pepsi. Sales and marketing as a % of revenue fell from 23% to 19.1% Y/Y as a result. General & administrative benefitted from a lack of legal settlement charges in the quarter. Without that charge, the cost bucket was 6.0% of revenue vs. 14.6% Y/Y. Regardless, impressive leverage.
e. Take
What else is there to say but great quarter? The next Apple is not supposed to make cell phones. The next Amazon will likely not be a logistics titan. The next Monster is not supposed to be an energy drink company… but it may be just that.
5. Earnings Round-Up – Hims; Axon; Robinhood; Upstart; Toast
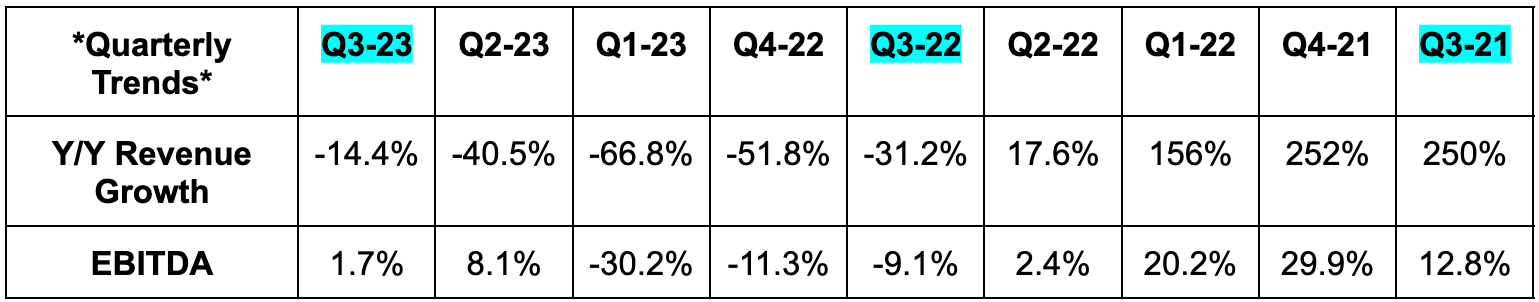
a. Hims
Results:
Beat revenue estimates by 2.9% & beat revenue guidance by 3.3%. Its 74.8% 3-year revenue CAGR compares to 80% Q/Q & 91% 2 quarters ago.
90%+ of this revenue is recurring.
Beat EBITDA estimates by 3.8% & beat EBITDA guidance by 6.5%.
Missed GAAP EBIT estimates by 12%; Beat GAAP GPM estimates.
Missed -$0.03 GAAP EPS estimates by a penny.
Q4 Guidance:
Beat revenue estimates by 7.9%.
Beat EBITDA estimates by 45%.
Balance Sheet:
$210 million in cash & equivalents.
Inventory flat year-to-date.
New $50 million buyback. Share count rose by 2.4% Y/Y.
30,000 Ft. View:
This company relies heavily on external marketing for growth. That led many to believe it couldn’t possibly keep scaling without diminishing returns. Well? This quarter, it has continued to rapidly scale with significant operating leverage and a gross profit payback period of under 1 year. The marketing machine continues to effectively hum.
It also continues to find success with prescription personalization and is wrapping up “migration to affiliated facilities” to enhance its ability to provide granular care. The runway also remains long. Within its 4 core categories (men’s/women’s health, dermatology & mental health), it only offers 11 of its potentially planned 20 products. It also expects to eventually be in weight loss, pain management, fertility and diabetes. It has proven that it can successfully launch products and build meaningful traction through marketing. These launches should be no different.
If customer acquisition cost continues to be well controlled, this should continue to work. If not, it likely won’t. I candidly do not have a good sense of direct-to-consumer prescription market dynamics, so will leave it to you to decide.
b. Axon (AXON)
Results:
Beat revenue estimates by 5.7%.
Its 35.6% 3-yr revenue CAGR compares to 38.5% Q/Q & 32.6% 2 quarters ago.
122% net revenue retention vs. 122% Q/Q & 120% Y/Y.
Beat EBITDA estimates by 20%.
Beat gross profit margin (GPM) estimates by 120 bps.
Beat $0.38 GAAP EPS estimates by $0.40.
2023 Guidance Updates:
Raised revenue guide by 2.0% which beat estimates by 1.3%.
Raised EBITDA guide by 5.9% which beat estimates by 4.7%.
Balance Sheet:
$480 million in cash & equivalents.
Basic share count roughly flat Y/Y.
c. Robinhood (HOOD)
Results:
Missed revenue estimates by 2.3%.
$80 average revenue per user vs. $84 Q/Q & $77 2 quarters ago.
Trailing 12-month deposits of $17.3 billion vs. $16.1 billion Q/Q & $17.1 billion 2 quarters ago.
Beat EBITDA estimates by 7.9%.
Met -$0.09 GAAP EPS estimate.

2023 Guidance Updates:
The firm raised its GAAP operating expense guide for 2023. This was related to a $104 million regulatory accrual during the quarter. Regulatory accruals are adjustments to account for future expected regulatory liabilities.
Balance Sheet:
~$5 billion in cash & equivalents.
Shares up 1.5% Y/Y.
d. Upstart (UPST)
This quarter did not do anything to make me entertain owning this name again. If anything, it did the opposite. Clearly, macro is heavily weighing on its violently cyclical model. I think poor leadership is amplifying the pain. Just look at Pagaya’s outperformance for evidence.
Results:
Missed revenue estimates by 3.7% & missed guide by 3.9%.
Missed fee revenue guide by 2.1%.
Missed -$0.02 EPS estimates & missed same guide by $0.03.
Missed EBITDA estimates by 54% & missed guide 47%.

Next Quarter Guidance:
Missed revenue estimates by 14.4%.
Missed $10.5 million EBITDA estimates by $10.5 million.
Missed $0.06 EPS estimates by $0.22.
Balance Sheet:
$516 million in cash and equivalents.
Loan balance roughly flat at $1 billion year-to-date as expected.
Share count rose by 3.3% Y/Y.
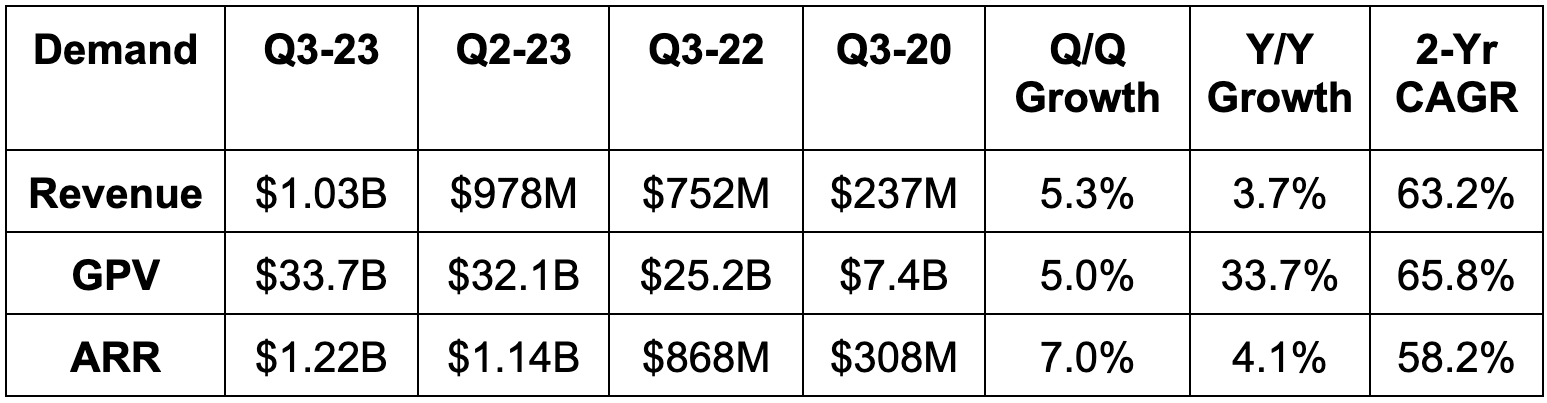
e. Toast (TOST)
Results:
Roughly met revenue estimates & beat guidance by 1.0%.
63.2% 3-year revenue CAGR compares to 51.5% Q/Q and 70% 2 quarters ago.
Locations up 6.5% Q/Q and 34% Y/Y.
Beat EBITDA estimates by 75% & beat its same guidance by 75%.
Beat free cash flow (FCF) estimates by 33%.
Met -$0.10 GAAP EPS estimates.
Q4 Guidance:
Missed revenue estimates by 1.5%.
Missed EBITDA estimates by 16%.
Balance Sheet:
$1.03 billion in cash & equivalents.
No debt.
Share count up 4.4% Y/Y.
5. SoFi (SOFI) – Noise
Just like any disruptor, when SoFi’s stock price falls, bears emerge with new risks to consider. When the stock rises, these same folks mysteriously vanish. What a coincidence. Most of the time, ~brand new~ risks are quite creative, to put it kindly. Sometimes they’re legitimate, but often not. There have been 3 items brought forth by SoFi bears this week that I wanted to address. I consider all three to be in the “creative” risk bucket. I’ll cover them here.
a. Fair Value Markings
The first “risk” from this week was SoFi's 5.1% gain on sale margin from a personal loan sale being misleading. A few concerns were included in this item. First, SoFi only sold about $15 million in loans. Some think this means that it can’t sell more. Not so fast. SoFi’s Northstar is maximizing return on assets and equity (ROA & ROE). It simply makes more today by holding personal loans than it can with a sale. If it has the capital ratios to store more loans, which it does, why not do so and earn more money? That’s exactly what SoFi is doing.
These small sales are symbolic nods to the investor community that capital markets remain wide open to the firm. It will only sell loans if it becomes capital constrained (topic of the next risk) or if it can swap this credit out for higher margin assets. And furthermore, it has already secured $100 million in credit in Q4. It also locked in another $2.5 billion as part of a forward funding agreement and an asset-backed securitization deal with Blackrock. Again, capital markets remain wide open to this company as or if it feels the need to use them.
The second risk within this bucket regards where that 5.1% in transaction profits came from. All of that premium came from servicing rights rather than from the actual principal. Thankfully, I went to grad school to explicitly learn about items like this and was able to dust off a textbook to refresh my memory. Long story short, this is nothing burger. Why?
Servicing rights are not randomly and independently assigned to deal terms. They’re tightly correlated with the overall compensation actually received. Thinking this isn’t the case is like thinking rainy days don’t make umbrellas more common. Premium was shifted from principal and interest payments to servicing rights to lower the upfront payment from the capital market buyer to SoFi. As a reminder, SoFi continues servicing the loans after the sale is closed. This SoFI concession was highly intentional and savvy. It allowed it to secure MORE profit over the term of these loans via a higher servicing revenue share agreement with these buyers.
The CFO confirmed that idea when we spoke with my friend (@DataDInvesting on twitter) this week.
As long as SoFi remains confident in the health of its credit book, this is a no-brainer. And that book continues to vastly outperform loss ratio benchmarks as its credit standards remain highly stringent. Its borrower’s FICO is well over 750 and their annual income is well over $150,000. This accounting is not only entirely normal, but it meshes perfectly with its aforementioned priority of maximum ROE. Why not assume more present value at the time of a sale?
One final note on this which is a bit of a review for consistent readers. Skeptics of SoFi claim its fair value accounting is shady. They think Current Expected Credit Loss (CECL) accounting is better. Couldn’t disagree more. CECL isn’t better, it’s more commonly used and is, in my view, worse. It requires less frequent credit markings and so a higher risk of pent-up unrealized losses building on the balance sheet. Instead, SoFi recognizes these losses quarterly. Furthermore, it uses an independent 3rd party to mark its credit. The assumptions embedded in the markings assume 5% unemployment, -2.5% GDP growth and loss rates materially higher than what SoFi has actually realized. The markings are intentionally and wildly pessimistic. That is another reason why it continues to sell credit blocks well over these markings; they represent a worst-case scenario that has not come close to manifesting.
b. Loan Growth
The second risk cited is that SoFi will soon become capital constrained and loan growth will grind to a halt. I don’t see this happening for a few reasons.
SoFi’s capital ratios remain in excellent shape. Still, total risk-based capital ratio will likely be the first bottleneck. It sits at 14.5% today vs. a 10.5% minimum. This ratio simply divides its $3.34 billion in risk-based capital by quarterly average assets of $24.2 billion. At current risk-based capital levels, this only allows SoFi to grow its quarterly average assets by $7.5 billion. With $2.5 billion in locked up funding supply, we can call this cushion roughly $10 billion. That gives it just two more quarters of origination runway before it approaches the 10.5% minimum that it will try to stay well above. Ok, well this makes it sound like SoFi’s lending growth can’t continue for much longer. It makes bears sound right. But let’s take this thinking a level deeper.
There are two reasons why this isn’t the case. First is clear and easy access to capital market funding supply. As covered in risk #2, SoFi has demonstrated an ability to tap into capital markets at hefty premiums. It has seamlessly done this during one of the worst backdrops in recent history. We’ve already covered why those premiums are entirely legitimate. Credit spread dynamics will eventually improve for the industry and SoFi’s seemingly best in class access to capital markets will only strengthen further from here. If it has the ability to secure $2.5 billion in forward funding TODAY, do we really think it can’t access capital markets during more tranquil times? That’s counterintuitive.
Easy access to capital markets at a time when those markets shuttered for many underwriters is key. It means it can recycle lower margin credit for more appealing credit. It also means the firm can sell off high margin credit at favorable terms to reload the quiver with more origination capacity. That, in turn, means SoFi can continue to grow origination volume rather than simply holding it steady for the next 6 months and beyond.
Finally, net income feeds tier 1 capital. I think it will earn about $500 million in GAAP net income through the end of 2025. That added capital raises its quarterly average asset capacity to add more average assets from $10 billion to roughly $13 billion. Net income will allow it to rely less on capital market sales and to focus more exclusively on maximum ROE in the years ahead. It’ll still need capital markets, just not as intensely. This is why the current profit inflection expected next quarter is so vitally important.
This doesn’t even consider the fact that SoFi also has about $4 billion in available warehouse capacity. If there’s some credit shock and capital markets close for SoFi, this gives it another quarter of originations. Yes, the margin would be lower by about 150 basis points considering the higher cost of capital, but it would still be favorable. And SoFi could easily sell off those warehouse-funded loans when capital markets bounce back to replace the credit with higher return assets. I don’t see why capital markets would close to this company considering they haven’t closed through all of the macro and regional bank-specific turmoil. But even the worst-case scenario is easy to digest.
Finally, lending is NOT supposed to drive 2024 revenue growth. Financial services and its technology platform will. 67% of its growth came from those 2 buckets this quarter and that trend is expected to continue.
c. Insider Selling
Viral social posts have circulated claiming “this insider sold 30% or 50% of their shares.” That makes for a juicy headline, but more content is needed. The insiders cited directly own a small fraction of their overall SoFi interest in common equity. Most of it will be earned through its long term incentive plan (LTIP) as well as restricted stock units (RSUs) which vest over time. So? Sure they sold 50% of what they own today. For example, Chad Borton technically sold 49% of his share this week for $1.2 million. When actually digging into the proxy statement however, it explicitly states that he will earn $7.6 million in equity awards for the most recent year. So? He sold 11% of his shares when considering this award. He sold a much smaller percent of his shares when considering all of the equity he knows he has coming in years ahead. He makes $500,000 a year in base salary, which makes equity his main form of compensation. Can you really blame him for selling some? I don’t. We all have bills and we all boats. The same is true for the other two executives who sold this week.
Considering this, I find this insider selling to be noise and not signal as it usually is. This is especially true considering both Anthony Noto and CFO Chris LaPointe bought more shares this week. Small purchases, but still notable.
6. Amazon (AMZN) – Subscriptions, No Subscription Needed & More
a) Healthcare
Earlier in the year, Amazon purchased One Medical for $4 billion. The company provides virtual care services and a large network of primary care office relationships. As part of this deal, Amazon will launch a new Prime benefit for $9/month ($99/year). This subscription will offer 24/7 virtual care access at no added cost and “easy to schedule office visits” for same day care in select cities. In the One Medical app, users can easily communicate with doctors and manage medications. Members can also add additional people to their subscription for another $6/month each.
Amazon Prime is perhaps the most compelling subscription in the world. It laces together countless value-add services to motivate strong retention and customer lifetime value. The better retention at scale allows Amazon to offer access to promotions that others simply can’t afford. Some think AWS is the only thing that funds Amazon Prime, but North American EBIT margin trends tell a different story. The release simply fortifies this equation. It should increase overall Prime utility and motivate even lower churn.
b) Grocery
Amazon is opening up its Amazon Fresh grocery delivery to non-Prime members. This will start in U.S. Cities where its Amazon Fresh stores are available (not many) and also with grocer partners like Bristol Farms. Whole Foods will be added to this service in the near future.
Interestingly, this news coincided with an update to its brick-and-mortar Fresh Stores. Experiments conducted on store updates in Chicago are promising with a 90% customer satisfaction rate. That’s what happens when your stores have Krispy Kreme shops inside (kidding). This success will lead it to implement the new model in its 3 L.A. stores while opening more in 2024.
c) More
Amazon conducted a round of layoffs within its music streaming business.
Rumors are circulating that it will bid on Premier League broadcasting rights.
7. Meta Platforms (META) – China
Meta and Tencent have agreed to a new partnership. In China, Meta will exclusively sell a cheaper VR headset through Tencent starting next year. Meta’s apps are banned there, but this gives it a foot in the door to re-enter the market. It’s a very small foot considering how tiny this revenue segment is and will be in the near future.
8. Lemonade (LMND) – Various News
Lemonade crossed 2 million customers this week as expected.
It filed a new shelf offering giving it the ability to raise capital in the future. These raises will not be until the firm is profitable in 2025. We’ve been promised that many, many times by leadership. I fully expect them to keep their word.
9. Disney (DIS) — The Marvels
Headlines are swarming about The Marvels being one of “Disney’s worst box office openings ever. More context is needed:
Actor strikes have thrown a wrench in title promotions. Disney had just a few days of promotion with its lead actors. That’s also partially why Sony’s title released this week is struggling early on.
It was fully expected to be one of Disney’s worst openings ever.
International results are faring better than they are domestically.
Elemental had an awful opening weekend and proceeded to rebound thereafter.
This is based on Thursday data, with the expectation of children flocking to theaters on Friday due to the holiday.
Changes to content creation approach at Disney will take time to play out. Films include multi-year contracts which means changes made this year will unfold over the coming years.
10. Macro
Output data:
Atlanta Fed GDPNow forecast for Q4 is 2.1% as expected.
Inflation data:
This week’s 10-year note auction closed at a 4.519% yield vs. 4.610% last month.
Michigan 1-year inflation expectations for November are 4.4% vs. 4.0% expected and 4.2% last month.
Michigan 5-year inflation expectations for November are 3.2% vs. 3.0% expected and 3.0% last month.
Consumer & employment data:
217,000 initial jobless claims vs. 215,000 expected and 220,000 last week.
Michigan Consumer Expectations for November came in at a reading of 56.9 vs. 59.5 expected and 59.3 last month.
Michigan Consumer Sentiment for November came in at a reading of 60.4 vs. 63.7 expected and 63.8 last month.
11. Portfolio
I added to Progyny following its earnings report and trimmed Duolingo after it reported earnings this week.
A note on future Stock Market Nerd portfolio disclosures. I am not a portfolio or money manager. I create equity research to provide investors with real time analysis and insights to assist your own investing approach. My aim is to save you significant time in your research, not to direct your funds.
I have been doing portfolio disclosures on my personal holdings simply for transparency. That is all. I do not expect or want readers to unconditionally follow me into transactions. You should be thinking critically and making your own decisions based on personal risk tolerance, age, living costs, funding availability, discretionary income and non-equity assets.
I am considering a change in how I disclose my holdings and I may implement this in the near future. I like the idea of sharing transactions while markets are closed, and we all have time to appropriately contemplate if the move is right for you. If not, I fear some folks will impulsively follow my every move. I know for a fact that some of you do, and candidly that bothers me. My personal financial situation, risk tolerance and goals are not yours and our portfolios should reflect those differences.
Additionally, I don’t think the information is accurate as I frequently add material chunks of cash to the portfolio. This means my performance vs. a benchmark like SPY is not apples to apples. I also would love for my portfolio to have accurate cost bases, which is not the case as the numbers are currently disclosed. Most of my positions have done better than the listed returns on the currently used site indicate. This is because the data only goes back a year there. For example, I’ve held CrowdStrike since its IPO price of $34/share, yet my cost base on the site is listed as $160.20. It’s closer to $80.
With all of this said, I am considering going back to weekly portfolio updates without the full portfolio listings. If I do this, I will continue to share holdings and transactions weekly, as transparency is my number 1 priority. That will not change.
As always, I want to thank all of my readers and assure you that this will not affect the stream of quality content that I strive to provide. I am determined to provide you with maximum value.
Best,
Stock Market Nerd

Don't agree with all your perspectives on companies, but this has become one of my most liked finance Substacks because of the breadth of coverage and simple consistency!
The best quarterly earnings reviews. They are thorough, insightful and to the point. I appreciate your opinion and transparency. Thank you!