

News of the Week (October 16-20)
News of the Week (October 16-20)
Taiwan Semi; Intuitive Surgical; Duolingo; Disney; SoFi; Apple; Nvidia; SolarEdge; Shopify; Amazon; The Trade Desk; CrowdStrike; SentinelOne; Visa; Mastercard; PayPal; Macro; Portfolio

1. Taiwan Semiconductor (TSM) – Earnings Review
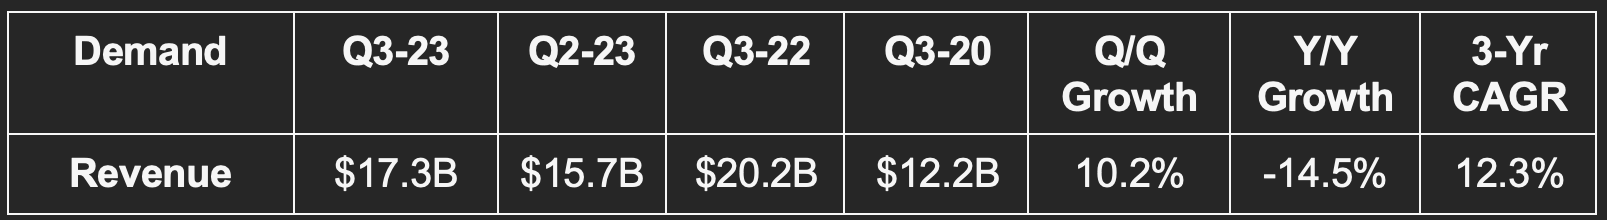
a. Demand
TSM beat revenue estimates by 3.6% and beat its own quarterly revenue guide by 1.2%. This quarter’s 12.3% 3-year revenue compounded annual growth rate (CAGR) compares to 14.7% last quarter and 17.2% 2 quarters.
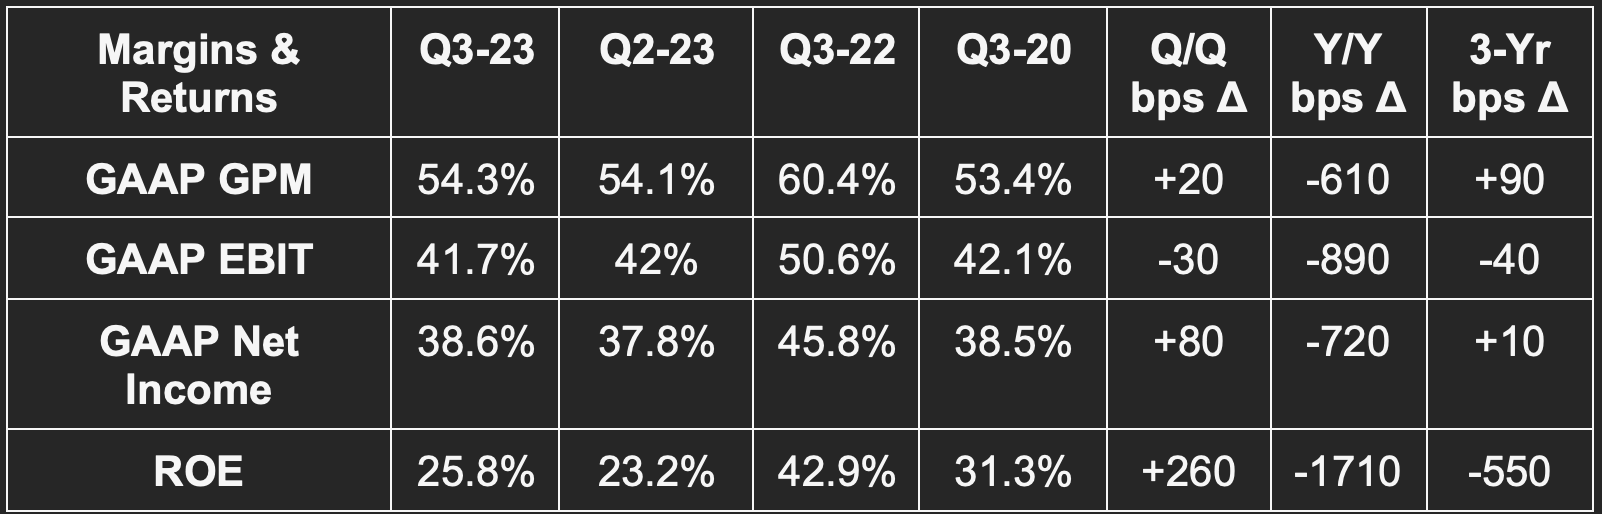
b. Margins
Beat GAAP gross profit margin (GPM) estimates by 130 basis points (bps) & beat guidance by 180 bps.
Beat GAAP EBIT estimates by 7.4% & beat guidance by 8.1%.
Beat GAAP net income estimates by 11.4%.
c. Balance Sheet
$48B in cash, equivalents & marketable securities.
$28.9B in bonds payable.
Inventory rose 20% Y/Y & 11.8% Q/Q.
Dividends rose 9% Y/Y.
d. Next Quarter Guidance
Taiwan Semi beat revenue estimates by 4.9%, beat EBIT estimates by 5.8% and beat 52.3 GAAP GPM estimates by 20 bps.
e. Call & Release Highlights
Needed Definitions:
Fab means a Factory
Nanometer (NM) describes the chip technology. Smaller NM is more advanced as it uses smaller transistors. Its newest 3 NM technology also includes an upgraded transistor technology to bolster the capacity. This means TSM can add more transistors to a single chip while making those chips more energy efficient and cost-effective.
Wafer refers to the raw materials (like silicon) that are used to manufacture chips and manipulate the materials with desired tasks.
Macro & Inventory:
TSM sees its client base’s “inventory digestion” (AKA slower buying) continuing into Q4. Most clients are quite cautious in the current macro and geopolitical environment and so are buying more sparingly. This impacts TSM’s demand as the manufacturer of chips for these clients. Importantly, it’s seeing “early signs of demand stabilization” within its 2 largest end markets: Personal Computing and smartphones. This, despite timid buyers, will allow TSM to reduce its inventory position Q/Q in Q4 and as we head into 2024.
Demand by Technology Bucket & Use Case:
Advanced technology refers to all technology buckets using 7 NM or below. This now represents 59% of TSM’s total wafer revenue vs. 53% Q/Q. 3 NM became a new disclosure this quarter as that technology ramps up. It now represents 6% of total wafer revenue. Its newest N2 technology demand is being supported by the generative AI explosion. Again, lower NM means more energy efficiency. Gen AI models are voracious consumers of energy. Any efficiency gains for clients here will be met with real interest. TSM will be ready to produce chips with 2 NM technology in 2025.
By platform, high performance computing (HPC) represented 42% of sales vs. 44% Q/Q and 39% Y/Y. Smartphone represented 39% of sales vs. 33% Q/Q and 41% Y/Y. Internet of Things (IoT) and Auto remain its 3rd and 4th largest use case platforms.
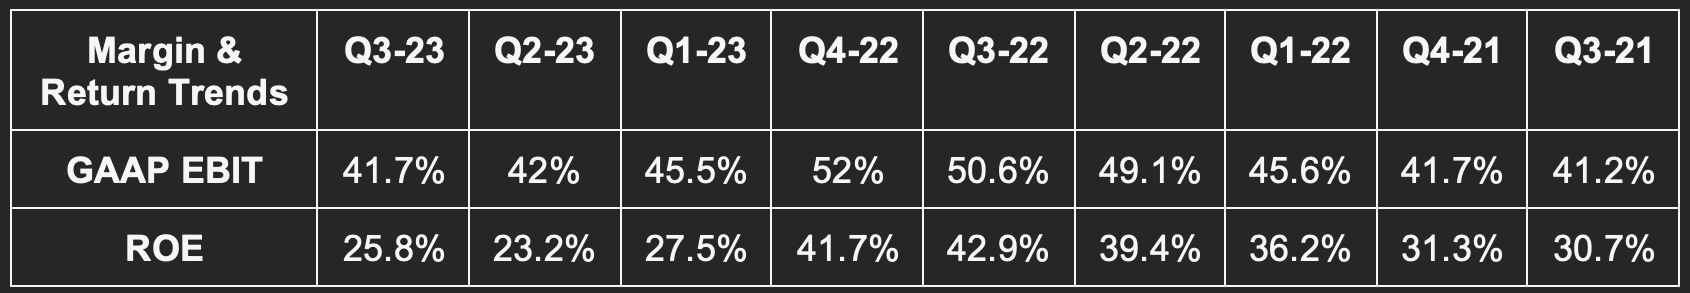
Margins:
More favorable foreign exchange (FX) rates drove the gross margin outperformance. Higher capacity utilization helped too, but FX was the primary factor. Margin expansion also would have been more meaningful without the headwind from its aggressive ramping of 3 NM production. New technologies start with lower margins and those margins expand with scale… similarly to most business models.
The company reiterated its long-term 53%+ gross margin and 25%+ return on equity (ROE) targets.
Global Fab Expansion:
In Europe, the European Commission and local regulatory bodies in Germany continue to support TSM’s expansion needs. It will build a new plant in Germany for auto and industrial use cases with 12-28 NM technology. Construction should start next year and end in late 2027.
In Arizona, it “continues to develop a positive relationship with regulators.” It’s making “good progress” on the labor and material shortage issues that had been impacting its progress on various fab plans. It has now hired 1,100 employees to help build the plant. Most are from Taiwan and are experienced. It thinks it will be ready for scaled production here in early 2025. Finally, the Japan factory is on track for scaled production by the end of next year. All of these projects are margin headwinds until reaching scale. TSM is fixated on cost and efficiency controls to ensure it remains at or above long-term margin targets while these projects develop.
f. My Take
The quarter was fine and the guide was great. Semiconductors are as violently cyclical as any other industry. TSM’s guidance being so far ahead of depressed consensus AND that it’s already seeing demand greenshoots are both great signs. An impressive company that continues to effectively endure difficult times in my outsider perspective.
2. Intuitive Surgical (ISRG) – Earnings Review
a. Demand
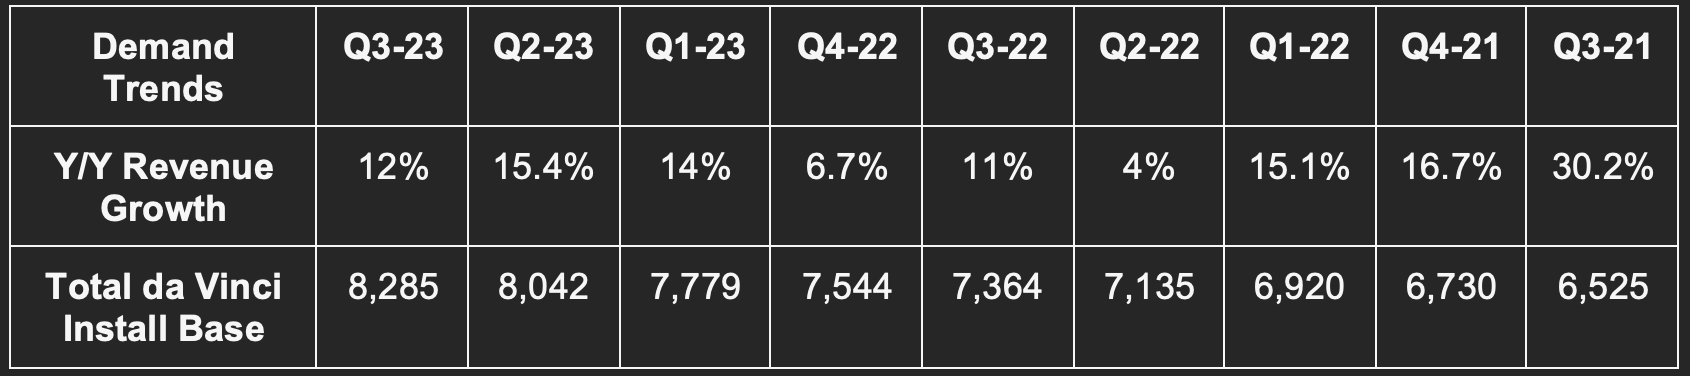
ISRG missed sell side revenue estimates by 1.7%. It does not guide to quarterly revenue. Its main surgical system (da Vinci) enjoyed 19% Y/Y procedure growth vs. 22% Q/Q and 26% 2 quarters ago. Recurring revenue rose 21% Y/Y.
b. Margins
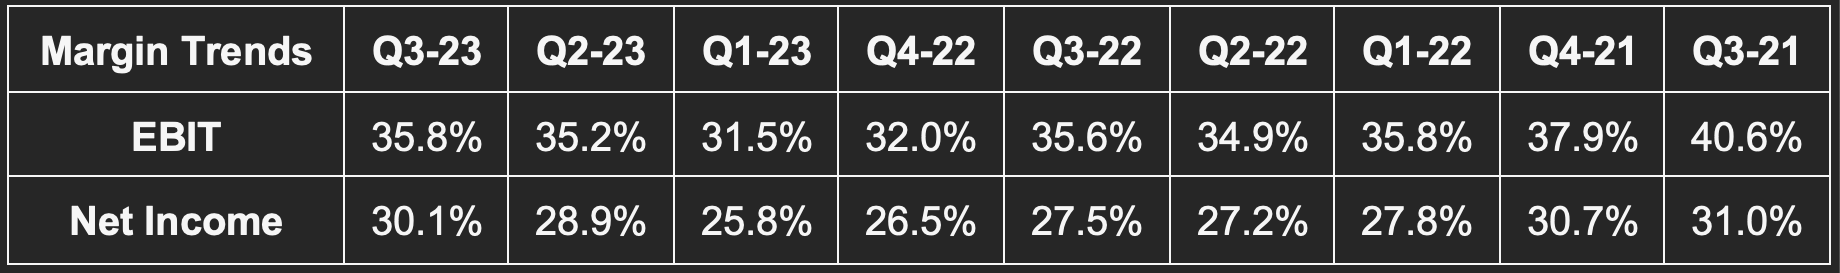
ISRG beat non-GAAP EBIT estimates by 1.3%, met non-GAAP GPM estimates and beat $1.42 non-GAAP EPS estimates by $0.04. It does not guide to specific quarterly profit metrics.
EPS rose 23% Y/Y.
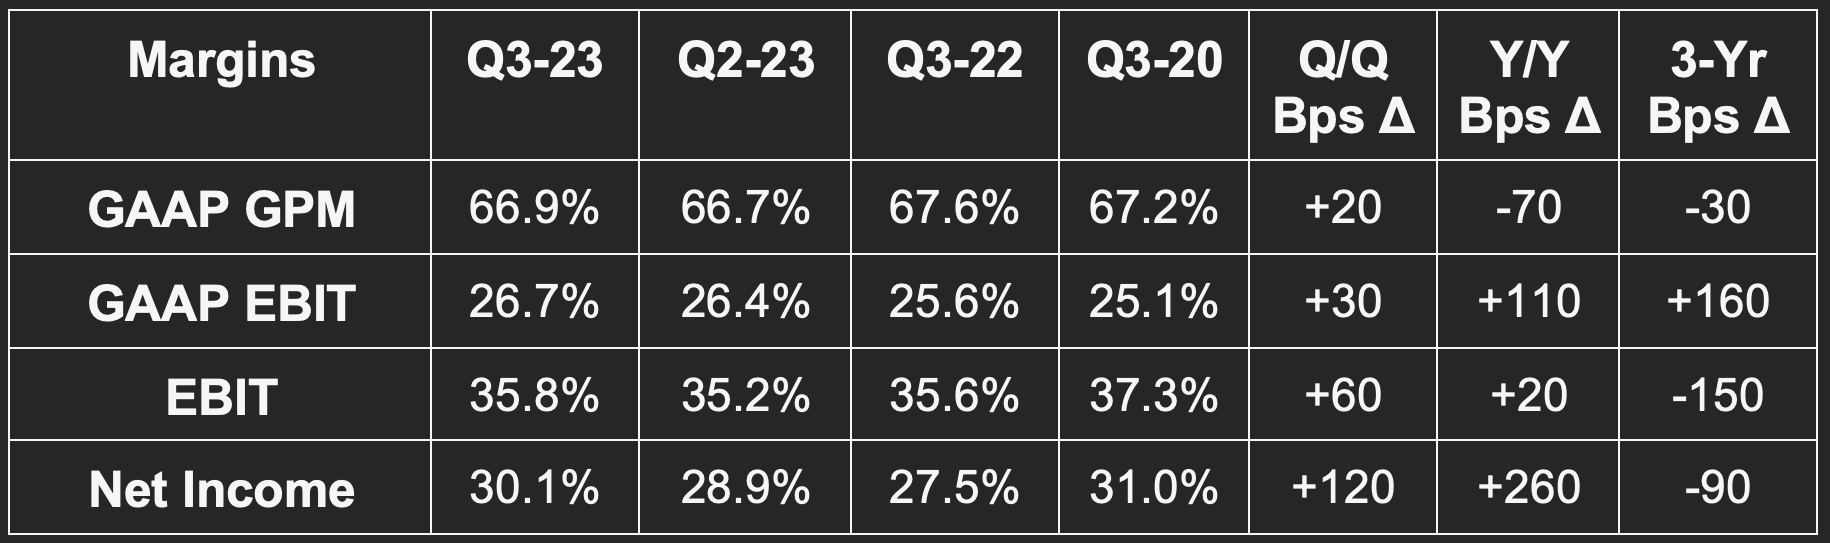
Gross margin fell by 20 bps Y/Y when excluding a one-time Q3 2022 tax benefit.
c. Balance Sheet
$7.5 billion in cash & equivalents.
No debt.
Basic and diluted share counts fell by about 1% Y/Y.
Inventory is up 28.4% year to date.
d. Full Year Guidance
Raised annual procedure growth guidance from 21% to 21.5%.
Lowered its annual GPM guidance slightly from 68.5% to 68.25%.
Lowered its annual operating expense (OpEx) guide from 13.5% Y/Y to 13.0% Y/Y.
It expects more interest income for the year than it did last quarter via higher rates and its strong, cash-rich balance sheet.
Quarter to date, it has placed 60 surgery systems in Europe vs. 54 Y/Y, 32 in Japan vs. 32 Y/Y and 10 in China vs. 15 Y/Y. Chinese regulators continue to clamp down on anti-fraud and corruption of some ISRG customers. This pushback is slowing ISRG’s system placement growth and will continue to do so into Q4.
e. Call & Release Highlights
Macro Backdrop & Demand:
Market conditions for ISRG are “stable” Q/Q. Single port (single incision machine) installs for its Da Vinci surgical hardware accelerated a bit sequentially. Utilization growth slowed from 9% Y/Y last quarter to 6% Y/Y this quarter with general surgery across all core markets the main growth contributor. For its newer Ion surgical system hardware, procedures grew by 125% Y/Y on a smaller base vs. the da Vinci system. It placed 55 Ions vs. 50 Y/Y. For context, it has 490 Ion systems in the install base vs. 8,285 da Vinci systems.
While demand stayed relatively strong, a lot of that demand is shifting to per usage leasing contracts. 52% of placements were lease-based vs. 37% Y/Y. Customers understandably are seeking less up-front cost commitment amid these chaotic times. Leasing means lower short-term revenue collection, but features a similar lifetime value compared to an outright sale.
“Leasing allows customers the flexibility to build new capacity when and where they need it with predefined pathways for the new technology.” – CEO Gary Guthart
“Broadly speaking, da Vinci is operating at global scale and embedded in a robust ecosystem… acceptance of Ion is strong… Single port da Vinci system acceptance is accelerating with new pipeline indications… digital tools are building momentum through their early stages.” – CEO Gary Guthart
Margins:
For a complex healthcare hardware company, 2022 supply chain issues were a large headache. Rather than focusing on margin preservation, ISRG worked to “support its customers through the shocks.” Per leadership, this “diverted resources from cost reduction.” It’s now in a position where supply chains are healthy and it can refocus on operating leverage. It sees significant room for margin expansion within the Ion platform specifically.
Digital Traction:
ISRG’s SimNow is its digital surgery simulator to help professionals practice in 0-consequence environments. As a nerd, I find this to be so cool. Renewal rates for subscription-based access to SimNow have been “outstanding.” Its “My Intuitive App” is essentially a customer dashboard to access outcome, utilization and patient history data. Usage of this app rose 140% Y/Y with “strong Net Promoter Scores.”
Bariatrics (Weight Loss Surgery):
ISRG is one of the companies impacted by weight loss drug ripple effects. The drugs diminish bariatric surgery demand and started slowing the company’s growth within this segment last quarter. Growth continued to dwindle sequentially this quarter. This type of surgery represents about 4%-5% of its total volume.
f. My Take
The quarter was pretty much as expected without potential negative surprises overly impacting results. The leasing trend is eerily similar to B2B software companies seeing customers demanding shorter-term contracts to avoid hefty up-front spend. Margin expansion should continue now that it’s through the worst of supply chain shocks. This high-quality company should continue to attractively compound demand while that margin expansion takes place. Boring company in the best of ways.
3. Duolingo (DUOL) & Alphabet (GOOGL) – English Practice
a. The news
This week, Google debuted a new tool within search to practice english. It offers speaking and translation lessons with granular feedback to explain concepts and sharpen comprehension. Its “Deep Aligner” generative AI model is a key piece of this; it helps learners understand single word meaning and how word meaning can change as sentence structure is altered. This model supposedly improves sentence alignment error rates (AER) significantly vs. other models like Hidden Markov Models (HMMs). Duolingo uses HMMs as a small piece of its own language learning toolkit. Learners can sign up for daily alerts to remind them to complete lessons.
b. My Assessment
Complements:
This was undeniably an intimidating headline for Duolingo shareholders like myself. After digging all the way in, however, I don’t see this as breaking the investment case or serving as a red flag of any sort.
First and foremost, Google’s blog post explicitly says that this is “designed to be used alongside other learning services.” This is not a substitute for approaching English fluency. It offers a small, small subsection of the learning capabilities provided by Duolingo, Babbel and others. It’s not designed to push beginners from newbies to experts… the tool is designed for more barebones learning. The main motivation for English learning across the globe is economic and educational mobility. Learning a sentence here and there doesn’t accomplish that.
Some will disagree, but I view this as a COMPLEMENT to Duolingo rather than a substitute. I’d even argue that this will be a net positive. It will push language learning to the forefront of searcher minds. Some of those searchers will inevitably want to get deeper and more advanced. When that happens, they’ll seek out apps like Duolingo which can provide that advancement.
The Opportunity & Data:
For a mid-cap like Duolingo, the $70 billion global language learning opportunity is gigantic. For a firm like Google, it’s far less so. Google is likely just doing this to boost engagement and advertising revenue. As an aside, Duolingo offers a very popular free tier as well where it monetizes via ads. So that lack of paywall friction isn’t a differentiator here.
While language learning is priority 1 for Duolingo, it will likely be priority 40 for Google. One can argue that Google has more data, so it will eventually reach Duolingo’s efficacy. To that I say not so fast. Data scale is one thing, but data scale and relevance is the real formula for success. Duolingo leads here by miles with billions upon billions of lessons in its data lake that its 70 million+ active users complete. This means unmatched access to hyper-granular and pertinent data to glean patterns and sharpen the app with endless split-testing.
Gamified Learning:
One of the keys to Duolingo’s fabulous success has been its gamification of language learning. Turning fluency into a competition to beat a friend naturally drives retention, engagement and word-of-mouth growth. It morphs learning into a bit of an addiction for users. Specifically, word-of-mouth drives over 90% of Duolingo’s demand and user growth. I look at Google’s new product and do not see how that success driver is being emulated in any way. That’s just seemingly not the aim for the search giant. Duolingo learners enthusiastically take to social media to share badges, post Duolingo memes and bond. While that is a somewhat abstract driver of lifetime value, it has proven to be a large one since this company’s inception.
It will take this same approach with it as it expands into math, literature and music.
Not New:
Google has provided language learning tools for a long time. I shamelessly used Google Translate throughout my high school and undergrad Spanish classes while most peers did as well. It also previously offered tools to help searchers with sentence structure, speech and feedback. This gained very little traction. It’s unclear if this search giant’s landing page is a relevant enough destination for searchers to spend an extra several minutes. Their initial intent was to rapidly get search results in seconds. But again, even if it is relevant enough, this product is not a substitute for apps pushing learners far closer to fluency.
Conclusion:
As consistent readers know, I’ve been trimming my Duolingo stake this year. The company’s execution has been masterful, yet the stock is very expensive. If this pullback becomes meaningful enough, I’d entertain resuming accumulation. That has not happened yet. I’m being very picky considering it’s still a speculative stock and already a large position. I’d like to see it move back to its 200 day moving average around $135 to add. I have no clue if it will get there. I’m fine with not owning more shares today.
4. Walt Disney (DIS) – ESPN
The News:
As expected, and as part of Disney’s plan to change reporting in Q4 2023, it just published newly organized financials. The new reporting segments are now Entertainment, Sports and Experiences. This is part of its aim to more transparently disclose financial performance, create team accountability and “restore creativity to the center of the company.” It could also be a planned step for ESPN in anticipation of mega-cap tech partnerships, minority investments or even an outright sale.
As an important aside, the Entertainment bucket will receive a proportion of revenues collected by consumer product sales within the Experiences segment. This proportion will “reflect the royalties of merchandise licensing revenues generated from Entertainment’s intellectual property (IP). This practice mimics its direct competitors. Interestingly, a piece of Entertainment’s revenue creation will come from “subscription video on demand services.” This hints at Disney re-embracing licensing deals with streaming competition, which would be the correct decision.
The Financials:
Disney reported newly organized 2022 and 2021 financials for the 3 segments. The highlights are as follows:
ESPN:
Revenue rose by 8.1% Y/Y from 2021 to 2022 to $17.3 billion
EBIT rose by 0.7% Y/Y to reach $2.71 billion. EBIT margin fell from 16.9% to 15.6% Y/Y.
So far this year, ESPN has generated $13.2 billion in revenue and $1.5 billion in operating income. Q4 is a big quarter for this segment.
Entertainment:
Revenue rose by 8.4% Y/Y from 2021 to 2022 to reach $39.6 billion.
EBIT fell by nearly 60% Y/Y from 2021 to 2022 to $2.1 billion. This is because streaming losses ramped and because ESPN is no longer in this segment to buffer the declines.
So far this year, Entertainment has generated $31.1 billion in revenue and $1.2 billion in operating income.
Experiences:
Revenue rose by 75.6% Y/Y from 2021 to 2022 to $28.1 billion as parks reopened around the globe.
EBIT rose from -$120 million to $7.3 billion also as parks reopened around the globe.
So far this year, Experiences generated $24.4 billion in revenue and $7.2 billion in EBIT. International park reopening continues to make for easy Y/Y comps.
Paramount, Netflix and Warner Brothers boast a blended EBIT multiple of 23.4x. Assuming 2024 EBIT merely reaches 2022 levels for ESPN, it would be worth about $63 billion at that multiple. I realize this is not a perfect comparison considering streaming deserves a higher multiple than linear. Conversely however, live sports is the remaining healthy piece of linear and should fetch a multiple more closely resembling its streaming counterparts vs. decaying linear assets. Still, to be safe, let’s assume an 18x EBIT multiple for the segment. That would still make ESPN worth about 33% of the company’s current market cap. Assuming an 18x EBIT multiple for its Experiences segment gets us to 115% of Disney’s market cap and over 90% of its enterprise value. This does not even consider any value from its Entertainment segment.
I posted this math briefly on Twitter but candidly did not feel like dealing with permabears telling me 18x EBIT was ridiculous. This is why I love talking to you all a lot more than the masses on Twitter. Everyone has an opinion, most opinions are not reasoned. 18x is not at all ridiculous given the strong business moat, even in today’s high cost of capital environment. Not only will Disney compound profits by more than 18% for the next few years, but its decades of success and stability should also be reflected in the multiple. Look at direct comps. Look at other companies with similar rates and longevity of compounding.
I added to my stake this week.
5. SoFi Technologies (SOFI) – Galileo
Galileo debuted another business-facing product this week. It’s a dashboard to organize and consolidate bill pay and credit limits. Staying up to date with multiple payment and accounting vendors is annoying and this tool helps.
Taken in isolation, this news is not monumental or game-changing. When considering this product news in aggregate with the rest of Galileo’s recent releases, it’s much more meaningful. Galileo is actively rounding out its embedded services suite beyond its original payment processing niche. This is vital for attracting larger clients as the segment moves away from focusing on client quantity to client size and quality. SoFi’s technology segment has been the weak spot for the firm in 2023 as it embarked on this operational pivot.
Growth there needs to reaccelerate going forward and that reaccelerating is fully expected to come. This playing out would likely lead to a certain level of margin expansion as the high margin, un-commoditized, enterprise-facing revenue takes up a larger portion of the overall pie.
6. Apple (AAPL), Nvidia (NVDA), SolarEdge (SEDG) – Relevant Tech & Energy News
a. Apple (AAPL)
Apple’s Tim Cook again visited China this week. He spoke with the nation’s commerce minister about the government employee iPhone ban. This comes as Apple continues to shift more manufacturing resources to India and Vietnam to trim reliance on that unpredictable nation.
b. Nvidia (NVDA)
The Federal Government is further restricting advanced AI chip exports to China. Several Nvidia chipsets including H100 will be impacted. China is the 2nd biggest revenue geography for Nvidia with a 20% revenue contribution. Considering how supply constrained these advanced chipsets are, it’s hard to believe this will be a 20% revenue headwind. The impact will surely be smaller as it sells more to other nations and tries to sell eligible chipsets to China. The hit will still be material. Edward Jones sees the 2024 revenue impact being 7.5% of its total sales.
c. Solar Edge (SEDG)
SolarEdge pre-announced poor results this week. Revenue was 20% lighter than expected, gross margin was 900 basis points lower than expected and operating income 80% lower than expected. Solar deployment demand is directly hurt by rate hikes as those same deployments become more expensive. This space is quite cyclical. California restricting the value of excess solar energy credits adds to the challenges. Taken together, you’re left with a struggling sector. All players in the space fell in sympathy with this headline.
Commercial deployments should theoretically be more insulated from macro vs. residential and SEDG does have a large commercial business. Others lean more towards residential demand where individual consumers are more vulnerable to economic cycles.
7. Shopify (SHOP) – Channel Checks
RBC published some promising channel check findings this week. It sees adoption of Shopify’s large enterprise subscription tiers as “strong.” This follows channel checks from several other institutions during the quarter with similar findings. Most recently, Deutsche Bank also arrived at the same conclusion this week. RBC thinks there could be some positive surprises with revenue. Under new CFO Jeff Hoffmeister, revenue outperformance has directly meant profit outperformance. That could certainly be the case this quarter as well.
The company born to arm the rebels now readily arms the generals too. Through its Shopify Plus subscription and a la carte Components by Shopify offering, it has seen large merchants flock to the platform – especially in the last 18 months. These merchants add more Shopify products, boast better retention and serve as a stamp of approval for other large and small players following suit. If it’s good enough for Meta, it’s likely good enough for you too.
8. The Trade Desk (TTD) – Retail Report
TTD released its latest retail report. The trends described in this report are both promising and unsurprising. Most advertisers plan to raise their investments in retail data while most that don’t harness retail data plan to do so in the near future. It offered a Halo Top case study as the brand utilized Kroger’s retail data for the first time to drive 470% return on ad spend (ROAS). Fruit of the Loom plugged into Walmart’s data to boost its ROAS by 20% vs. other options. Case studies like this were numerous and all reiterated the same thing: More data and better identifying drive superior targeting and better campaign performance.
Who has an end-to-end platform to service these needs? Who can identify users in a responsible and more frequent manner? Who allows clients to unleash their data and tap into countless 3rd party sources? Who can connect individual marketing dollars to the specific sales they directly fostered? Who does this all with transparent reporting and unmatched efficacy? The Trade Desk. That’s why Walmart, Home Depot, Macy’s and many other giant retailers utilize it along with virtually all large agencies and buyers across the globe. Instacart joined that list of partners this week. More advertisers are embracing 4+ media partner data sources (35% vs. 15% in 2021) which makes this network all the more valuable.
95% of surveyed buyers also “reported challenges with walled-garden networks.” Problems include less than objective measurement and lack of platform interoperability. No kidding. Most prefer an open internet platform with self-service capabilities like TTD provides. Retail media will continue to be a compelling growth area for TTD to join streaming. This report confirms that point yet again while TTD remains in a great position to capitalize.
9. Amazon (AMZN) – Various News
The initial Satellites launched as part of Project Kuiper are fully intact and working as planned in space. The aim of this project is to cloak the world in free internet. That could quickly turn into yet another perk for Prime Subscribers and a source of pricing power.
Amazon will launch an online marketplace in South Africa next year.
Amazon signed a $1 billion contract with Microsoft to utilize its productivity apps.
Amazon launched a new AI model to better optimize warehouse processes and workflows.
Amazon debuted drone-powered pharmacy deliveries. This will be offered in 3 U.S. cities, Italy and the United Kingdom. Autonomy would certainly be a powerful margin lever over time for its delivery business. It also launched a new humanoid robot for tedious manual tasks.
10. Meta Platforms (META) & Alphabet (GOOGL) – Advertising Channel Checks & More
Bank of America sees Reels monetization and overall revenue outperforming when Meta reports Q3 earnings. It also sees strong profit and overall results for Alphabet when that search giant reports. Both of these tidbits bode very well for the programmatic advertising space as a whole.
Google Various News:
Google Cloud and Infosys are partnering on development and go-to-market for Generative AI models.
Google introduced new Generative AI features for advertisers to further automate campaign creation and sharpen performance. Meta debuted very similar tools earlier in the month.
Google is accelerating investments in India with plans to produce more Pixel phones there in 2024.
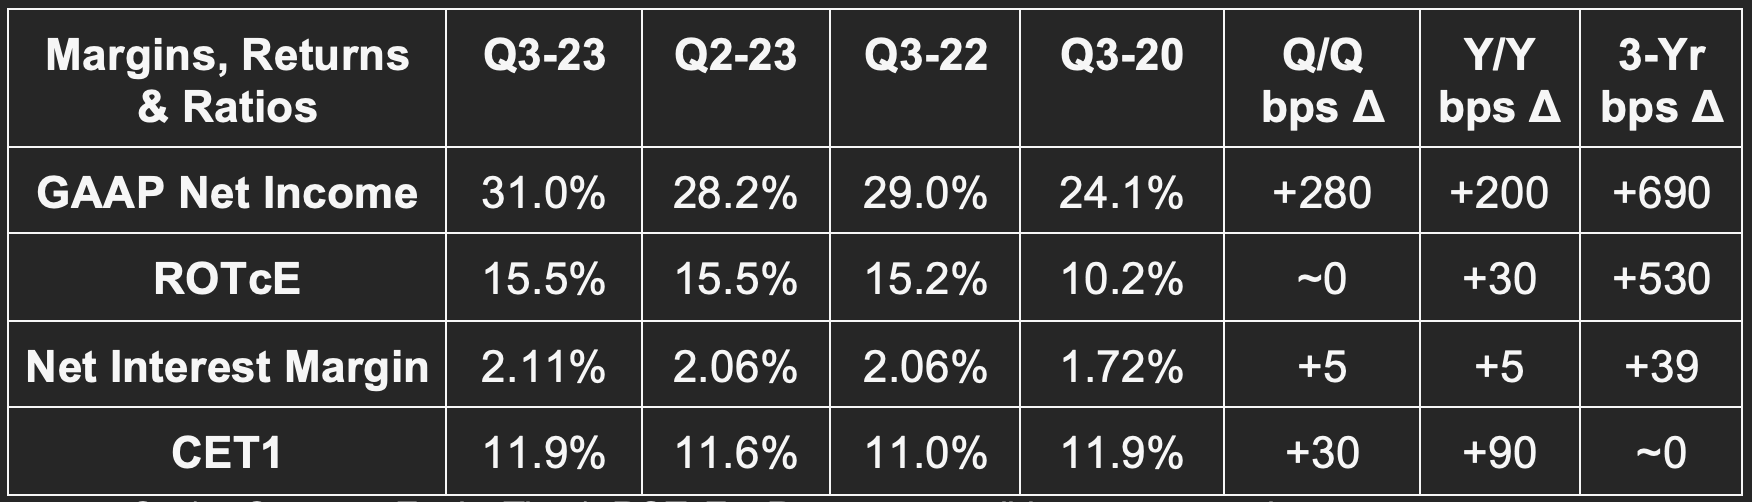
11. Bank of America (BAC) – Earnings Summary
a. Results vs. Expectations
Beat revenue estimates by about 0.4%.
Beat $0.82 GAAP EPS estimates by $0.08.
Beat 0.90% return on asset (ROA) estimates by 9 basis points (bps).
Beat 10.2% return on equity (ROE) estimates by 104 bps.
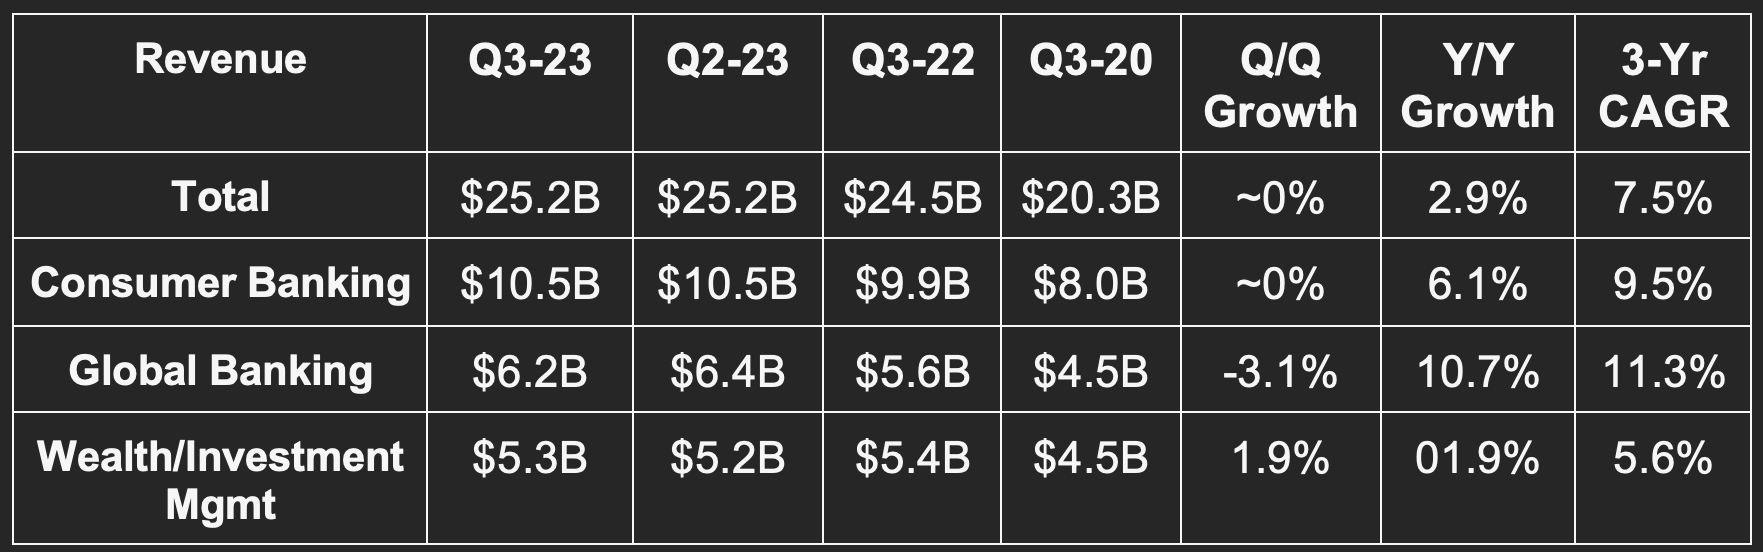
b. Balance Sheet
$379 billion in cash & equivalents.
Loans and leases rose 1.2% Y/Y.
$1.2 billion in credit loss provisions vs. $1.1 billion Q/Q & $900 million Y/Y.
Share count fell 1% Y/Y.
Dividend payments rose 6.3% Y/Y.
$131.6 billion in unrealized losses for its held to maturity debt securities portfolio vs. $109.6 billion Q/Q. This issue was the source of regional banking chaos earlier in the year. Bank of America’s asset quality is higher than the banks impacted as it’s not lending predominately to risky tech start-ups and venture capital firms. Its relatively affluent consumer deposit base is also much stickier.
Deposits rose slightly for the overall corporation, but fell slightly for consumer banking. The modest overall growth came from interest bearing deposit growth within the global banking segment. It’s paying 31 more bps for its deposits Y/Y.
Bank of America leadership on the call laid out how newly proposed banking liquidity regulations would impact the company’s balance sheet. Under current legislation, if passed, its risk weighted asset base would rise by about 20%. This would raise its common equity tier 1 (CET1) dollar requirements from $163 billion to $195 billion. The $195 billion assumes a 10% CET1 minimum vs. 9.5% as the 9.5% threshold will rise to 10% on January 1st. Bank of America’s CET1 dollar amount as of this quarter was $194 billion – placing it right at that new potential minimum. Importantly however, the proposed changes would be implemented over a 4 year span. This would give the firm, with its ample profits, the ability to slowly “build the buffer” over a string of 16 quarters rather than immediately. All in all, while Bank of America doesn’t see these changes as necessary (shocking), they really would not diminish its balance sheet flexibility all that much.
c. Guidance
Bank of America is now expecting 9% Y/Y net interest income growth for 2023 vs. 8% Y/Y growth as of last quarter. It also expects expenses to continue sequentially falling in Q4.
d. Earnings Notes
Bank of America’s Take on the Economy:
Per Moynihan, BofA’s economists still see a soft landing for this cycle as the most probable economic outcome. It “sees that in consumer data and the 37 million checking accounts” in its database. Consumer spending growth continues to slow, but remains firmly positive. Payments volume growth year-to-date (YTD) sits at 4% vs. 12% last year. 4% is in line with growth Bank of America saw in the 4 years leading into the pandemic.
“We are in a healthy, but slowing economy with consumers spending more than last year, but continuing to slow.” – CEO Brian Moynihan
Consumer Banking:
Bank of America remains ranked first in the U.S. for retail deposits and also customer satisfaction. It added 200,000 net checking accounts and enjoyed $51 billion in net client inflows. Consumer credit net charge-off (NCO) rate of 2.72% worsened from 2.60% Q/Q and 1.53% Y/Y as credit normalization post stimulus continues. Net charge offs overall remain below pre-pandemic levels.
Digital Growth:
Erica (its digital banking assistant) interactions rose 27% Y/Y while users rose 16% Y/Y to reach 19 million.
CashPro App (business banking) sign-ins rose 41% Y/Y.
Zelle (peer-to-peer payment platform) transactions rose 27% Y/Y.
Margins:
As telegraphed on the firm’s last call, this quarter marked a pause in consistent operating leverage. That pause was related to tougher net interest income comps. Costs overall continue to shrink sequentially and will do so in Q4 as well. In Q1, it incurred $16.2 billion in operating expenses (OpEx) with Q4 expense guidance at $15.6 billion. That Q4 cost guide would represent 1% Y/Y growth.
More Notes:
Book value per share rose 9% Y/Y.
Net interest income rose 4% Y/Y via higher rates while non-interest income was flat Y/Y.
Earnings per share rose 10% Y/Y for the quarter and is up 15% year-to-date vs. 2022.
Organic client and account growth continued “across all businesses.”
Global investment banking fee market share rose 78 bps Y/Y as the bank remains ranked third in this category.
e. My Take
I don’t think anyone is expecting bank earnings this quarter to be close to stellar. This was basically in line with lowered expectations. The commentary on the economy is something investors should find somewhat encouraging. Bank of America as a consumer banking giant has an unmatched feel for the shape and path of the U.S. economy.
12. CrowdStrike (CRWD) & SentinelOne (S) – Endpoint Disruptors
Forrester ranked CrowdStrike 1st in its Q4 2023 endpoint graph for strongest offering. It’s ranked 4th in strategy behind Trend Micro, Microsoft and Bitdefender. SentinelOne was not in the leader category but is getting closer. It ranked 7th in offering as well as 5th in strategy.
The report praised CrowdStrike’s endpoint breach prevention capabilities and its “superior vision.” It called its data security tools “on par” with others. High costs and expansion to non-endpoint areas diluting focus were the concerns.
For SentinelOne, the findings were somewhat similar. Automation and rapid innovation were cited as strengths while cost was called a weakness. Remediation is another SentinelOne strength. Conversely, data security requires separate product purchases and is a “challenge to update” per the surveyed customers.
Both continue to rapidly gain market share. Both have more work to do on perfecting their suites.
13. Visa (V), Mastercard (MA), PayPal (PYPL) Etc. – Regulation
The Federal Reserve posed a new regulatory threat to card networks and the payment landscape this week. The regulatory body is exploring a lower ceiling on interchange fees for processing debit transactions. If card networks aren’t able to charge as much, it’s intuitive to think gateway margins for firms like PayPal and issuer margins for banks would fall in a reactionary manner. Card networks will want to find a way to preserve their own transaction margins while overall transaction dollars per debit transaction could potentially fall.
This would be a margin headwind for all companies involved in the processing ecosystem despite it being the most direct for card networks. It would likely be a boost to operations for retailers as prices on an apples-to-apples basis for consumers would fall. The current cap is $0.21 + 0.05% of the transaction and was set over a decade ago. The Fed will meet next week to continue ironing out this potential proposal.
14. Macro
Consumer & Employment:
Core Retail Sales M/M for September rose 0.6% vs. 0.2% expected and 0.9% last month.
Retail Sales M/M for September rose 0.7% vs. 0.3% expected and 0.8% last month.
Initial Jobless Claims came in at 198,000 vs. 212,000 expected and 211,000 last month.
Output:
New York Empire State Manufacturing Index for October was -4.6 vs. -7.0 expected and 1.9 last month.
Industrial Production M/M for September rose 0.3% vs. 0.1% expected and 0% last month.
Housing Starts for September were 1.358 million vs. 1.38 million expected and 1.269 million last month.
Philly Fed Manufacturing Index for October was -9 vs. -6.4 expected and -13.5 last month.
Existing Home Sales for September were 3.96 million vs. 3.89 million expected and 4.04 million last month.
Powell spoke this week. Great attention was paid to the talk, yet we learned nothing new. Inflation is moderating and needs to moderate more. Rates could be hiked again if inflation data worsens and vice versa. The employment market is hanging in their. Unemployment will likely need to rise a bit while economic growth slows to achieve its inflation mandate.
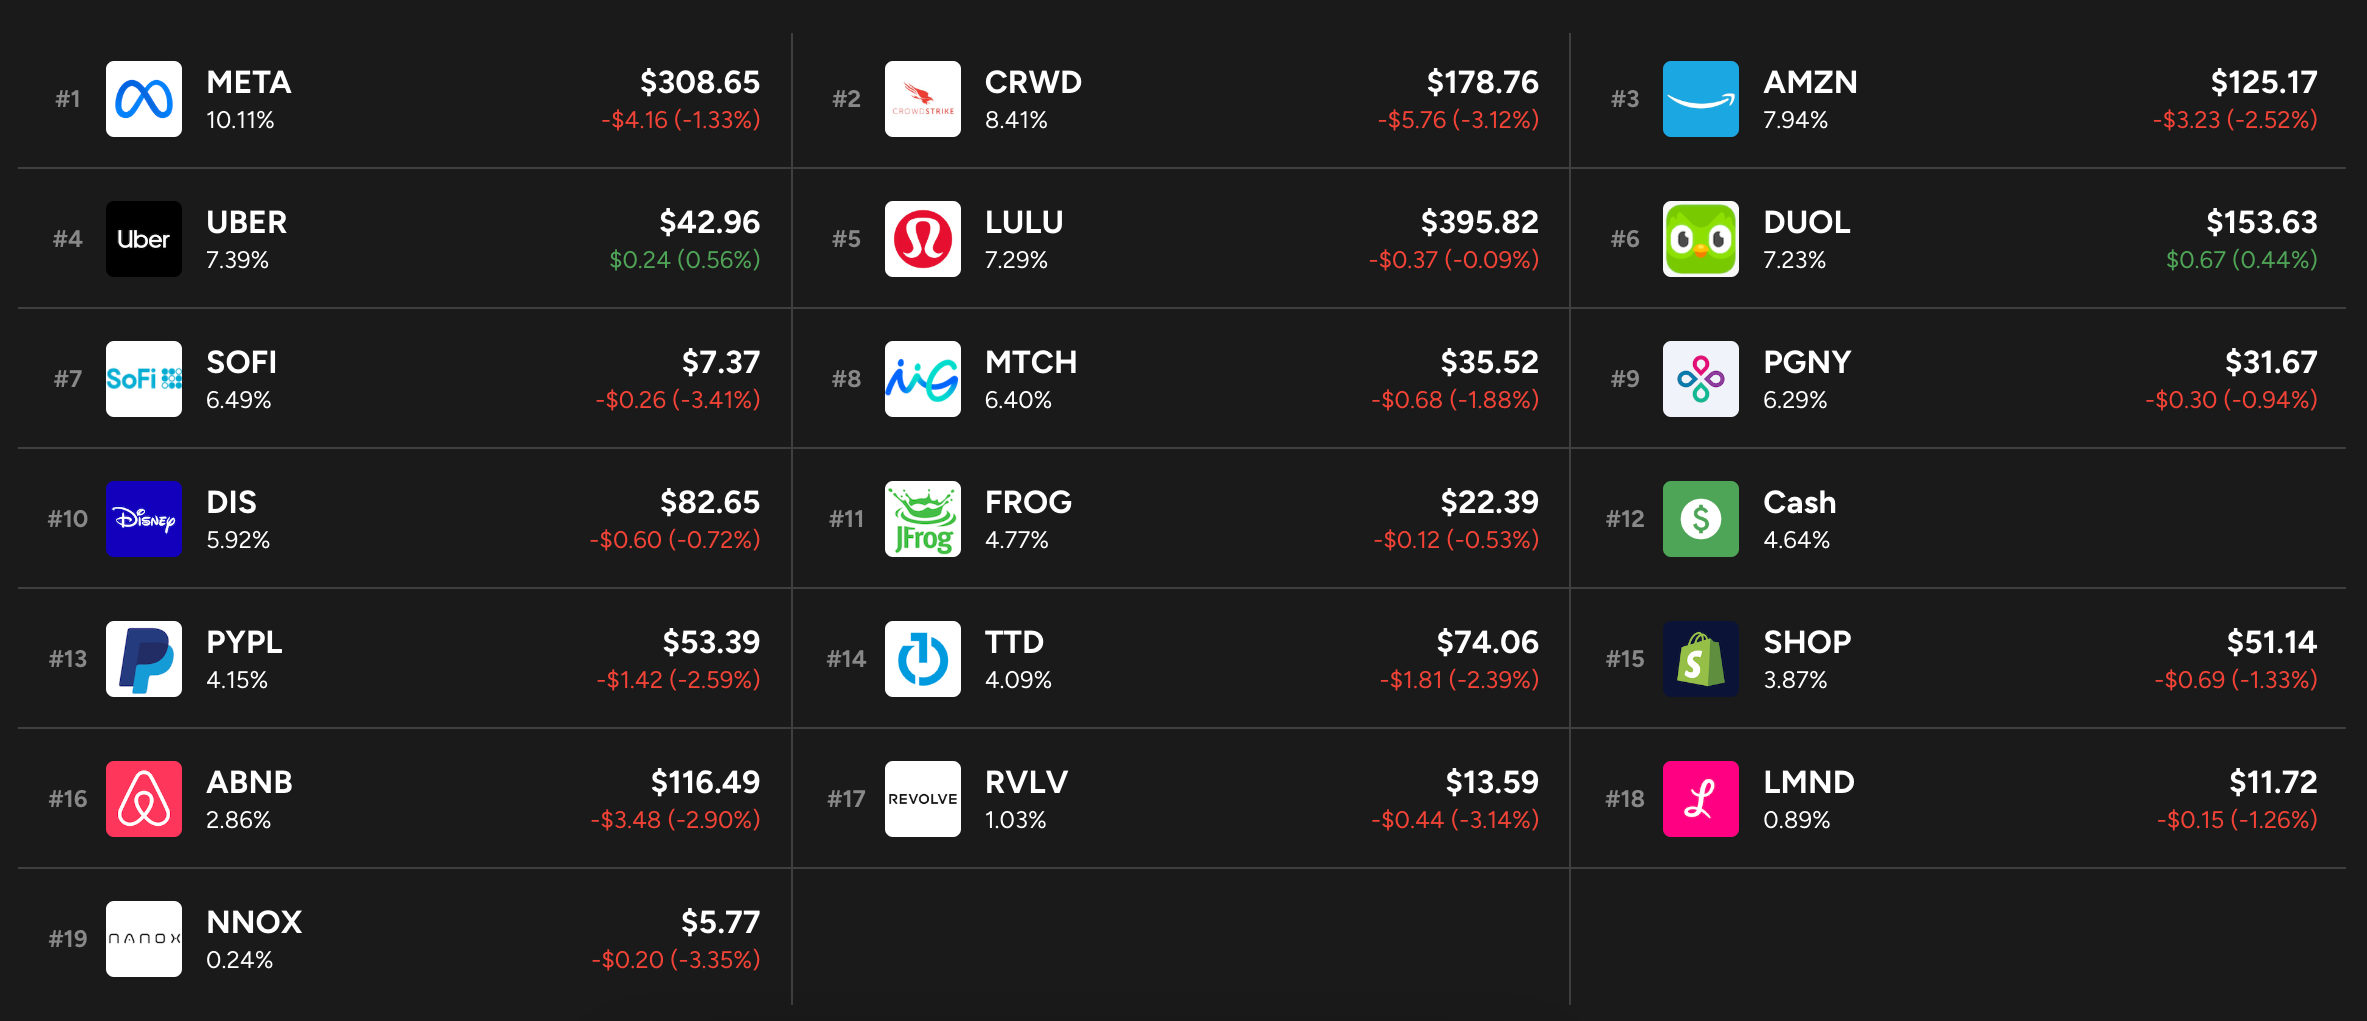
15. My Portfolio
https://www.reuters.com/business/media-telecom/reliance-nears-deal-buy-disneys-india-business-bloomberg-news-2023-10-23/