

News of the Week (August 1st - 5th)
News of the Week (August 1st - 5th)
Progyny; Duolingo; Green Thumb; Match; Revolve; JFrog; Penn; Meta; Lemonade; The Trade Desk; Shopify; Macro; My Activity

1. Progyny (PGNY) -- Earnings Review
“Our results reflect continued healthy utilization, further affirming the essential need of treatment and our members’ desire to pursue the care they need.” — CEO Pete Anevski
a) Demand
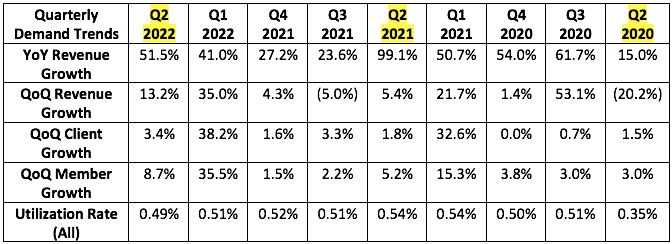
Progyny guided to $190.5 million in sales for 48% YoY growth with analysts expecting the same. The company posted $195.0 million, beating expectations by 2.4%.
It also guided to:
265+ clients for the quarter posted 273.
At least 4 million covered lives for the quarter. It achieved 4.27 million.
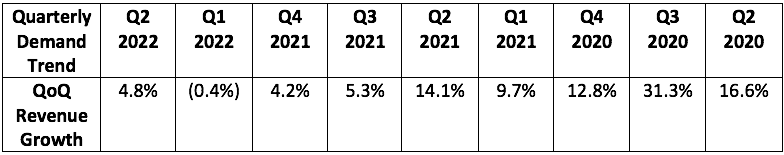
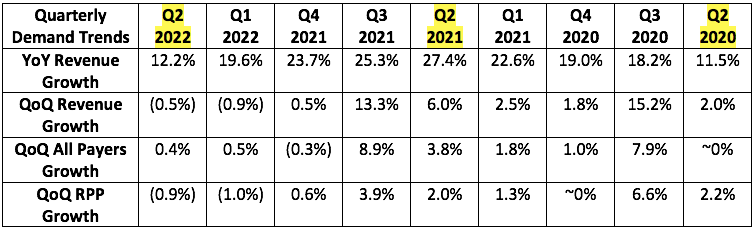
More context on demand:
Q1 is always Progyny’s best sequential growth quarter as most selling season wins go live as new clients.
Please note that in Q2, SART suspended new fertility treatment cycles in light of the pandemic. That led to a sharp decline in growth that rebounded rapidly. As a result, subsequent sequential comps and the Q2 2021 YoY comp were easy.
b) Profitability
Progyny guided to:
EPS of $0.015. Note that this guidance excludes expected tax deferment benefits. Analysts expected the same. It earned $0.09 with the tax benefits. It earned $0.19 per share last year which included a net $0.08 tax benefit.
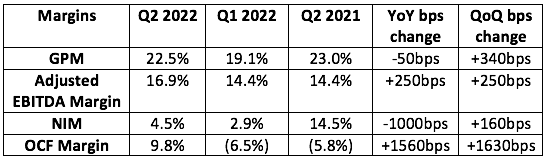
$29 million in adjusted EBITDA for the quarter while analysts were looking for $29.5 million. It earned $32.9 million, beating its expectations by 13.4% and analyst estimates by 11.5%.
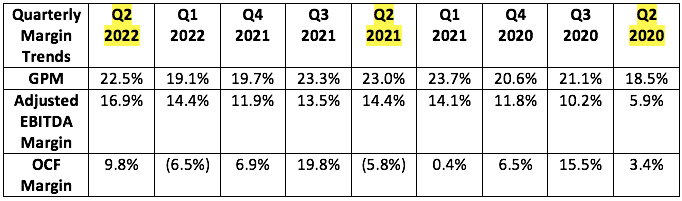
Gross margin above 19.1%. It shattered this expectation by 340 basis points (bps).
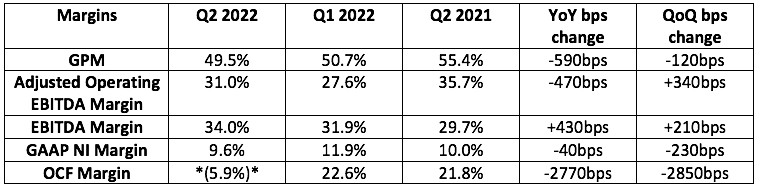
More context on margins:
Progyny’s incremental EBITDA margin was 21.7% -- point to more margin expansion to come.
16.9% is a new company EBITDA margin record -- by a full 250bps
Please not that OCF margin benefitted this quarter from a changing in contract receivables in its PBM business. This hurt OCF margin last quarter.
GPM is adjusted for the newly issued stock based comp package issued this year. When excluding this impact in all comparable periods -- gross margin was 25.7% this quarter, 22.7% last quarter and 24.2% last year.
Net income fell due to a tax provision vs. a tax benefit YoY. This hit net income
c) Balance Sheet
Progyny has $122.4 million in cash and equivalents this quarter, up 15.7% QoQ. There’s no debt. The balance sheet is beautiful and cash flows are strong.
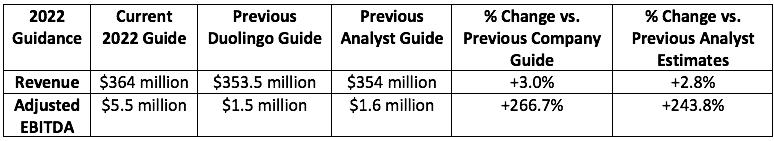
d) Guidance
More context on guidance:
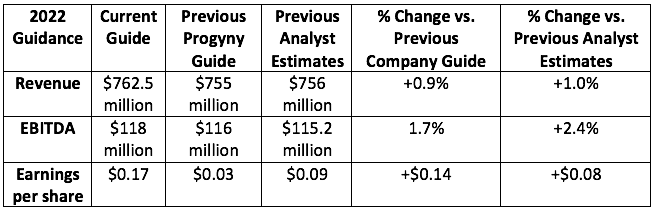
Note that this net income guidance still does not exclude expected tax benefits to be realized in 2022. EPS should end up being higher.
Progyny expects to add more clients and members in 2022 vs. 2021. This implies 32%+ YoY growth. Based on revenue guidance, this rate should end up being significantly higher.
Q3 2022 guidance similarly outperformed.
e) Notes from CEO Pete Anevski
On Progyny’s macro resilience:
The time sensitivity and passion of pursuing treatment led to stable volumes amid the Great Recession DESPITE a larger portion of treatment at the time being paid for out of pocket. Progyny fixed that reality.
Progyny see “no inflationary or economic softening impact on the business.” A tight labor market means more potential covered lives which is good for Progyny. Conversely, unemployment creeping back up to 5% like some have indicated is necessary to control inflation would hurt its results to a certain extent.
“Macro trends continue to be very positive for us which is reflected in the strength of our demand.” — CEO Peter Anevski
On the selling season:
Engagement remains robust
Gross retention remains near 100%
Employers continue to expand coverage with contract sizes similar to previous seasons -- they’re not going with a smaller version in light of economic pain.
The pipeline is extremely healthy
Progyny is winning over new industries like auto makers and hotels. Newer verticals like hospital systems (its most sophisticated buyers) continue to adopt Progyny plans.
There’s no change to the selling season schedule. It is not being elongated with worsening macro.
“Our current pipeline size and commitments to date continue to be favorable vs. the record level of activity that we experienced a year ago… we’ve received record new commitments as of this point in the season.” — CEO Peter Anevski
f) Miscellaneous Notes from CFO Mark Livingston
New clients went with ProgynyRx at an 84% clip vs. 73% YoY.
A rise in sales and G&A costs was due to the stock based comp package issued last year.
g) My Take
This was a flawless quarter which put a massive smile on my face. There’s nothing to pick at. Its results are great, its value proposition is expanding and its forward momentum is palpable.
Click here for my Progyny Deep Dive.
2. Duolingo (DUOL) -- Earnings Review
a) Demand
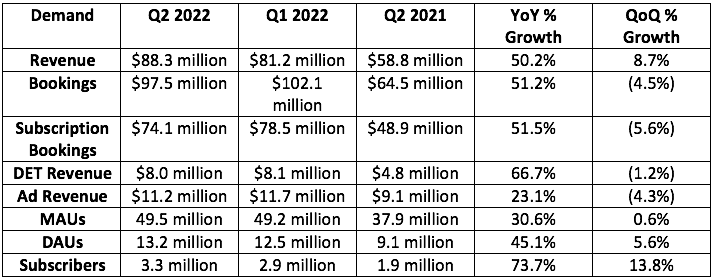
Analysts expected $85.7 million in sales while Duolingo guided to $85.5 million. It generated $88.3 million in sales, beating analyst estimates by 3.0% and its guidance by 3.3%.
Duolingo also guided to $87.5 million in bookings, it posted $97.5 million, beating expectations by 11.4%.
More demand context:
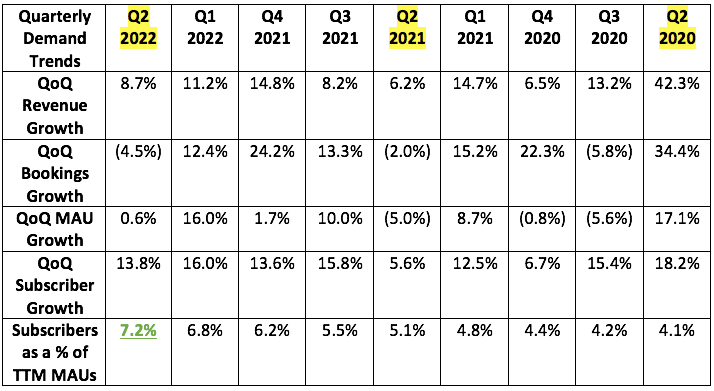
Subscribers as a % of MAUs at 7.2% was wildly impressive to me. That’s its main growth driver today.
While Duolingo did benefit from the pandemic juicing screen time, that was also an overall headwind. Duolingo does A LOT of revenue within the K-12 system and relies on travel and international studies for other sources of revenue. The pandemic ending helps all of this -- which is why growth has accelerated vs. other app-players seeing shriveling growth.
b) Profitability
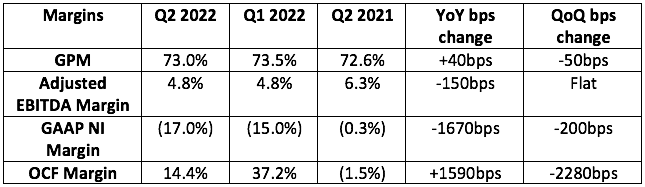
Analysts expected a loss of $1.9 million in EBITDA with Duolingo guiding to a loss of $2.5 million. It earned $4.2 million in EBITDA for the quarter -- shattering expectations.
More margin context:
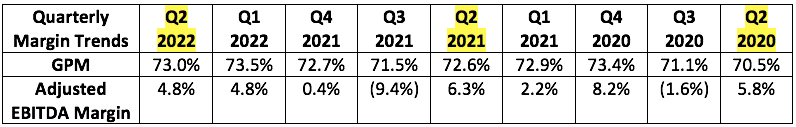
Duolingo is trying to operate at breakeven and invest every possible dollar in growth. It generated positive EBITDA regardless.
Sales and Marketing as a % of revenue was 17.3% this quarter vs. 16.2% YoY
2022 gross margin is being helped by lower app store fees charged by Google.
DET is a drag on margins. Its outperformance is a short term margin hit.
Please note that cash flow margins are being greatly propped up by stock based compensation and net income margin is being greatly hit by this same factor. This is why both are important to consider.
c) Balance sheet
Duolingo’s balance sheet is a company strength. It has $577 million in cash and no debt.
d) Guidance
“The beat on Q2 guide was driven by the fact that when we issued it, we were early in the quarter with a lot of macro uncertainty. We were being prudent. There was also outperformance even over internal expectations. And so, we’re taking outperformance into account in the new guide but still layering on a prudent outlook given continued uncertainty.” — CFO Matthew Skaruppa
Q3 2022 guidance was equally strong.
e) Notes from Co-Founder/Co-CEO Luis von Ahn
On Subscriber Growth:
“Subscribers as a percent of MAUs has outperformed what I thought would happen... I don’t see a reason why this can’t get to the mid-teens.” — Co-Founder/CEO Luis von Ahn
90% of Duolingo subscribers are now on annual plans vs. 80% as of a few quarters ago. This makes its revenue generation wonderfully visible.
On Macro:
“The macro environment is pretty crazy, but so far we have seen no weakness in our numbers whatsoever. We expect strong numbers… no layoffs are coming and we continue to hire.” — Co-Founder/CEO Luis von Ahn
Quite the flex from leadership.
On DET:
DET is in 3,7000 universities today vs. 3,6000 last quarter.
100% of the top 25 Universities in the United States accept this test.
Duolingo is now more aggressively expanding to Canada, The U.K. and Australia with the product.
On China:
Duolingo’s app was reinstated on China’s App stores in May. This prompted its DAUs in the region to immediately recover. China is just 2% of the company’s users today, but it represents a key growth region going forward.
On India:
India is now a top 5 market for Duolingo. Duolingo turned off monetization in the region because its “freemium” offers were being translated by Indian users as everything being behind a pay wall. It’s now working monetization back into the region in a more culturally fitting way.
On Quests:
Born from relentless, data-driven split testing and with the luxury of market leading scale, Duolingo launched Quests this quarter. Quests are daily challenges to be competed alone or with friends to earn rewards and badges. It’s quirky, seemingly un--important changes like this which make Duolingo so successful. These quests are optional tasks on top of Duolingo’s linear progression path (like Candy Land) debuted last month to a warm reception.
f) The Shareholder Letter
This letter essentially functioned as a victory lap for Founder/CEO Luis von Ahn who explained why Duolingo has been so successful I explained all of this in my deep dive which can be found here.
As an aside, Duolingo was named to Fast Company’s Best 100 workplaces. Cultural awards for this company are becoming a cliché.
g) My Take
This was yet another fantastic quarter from the team. Their obsession with product development over marketing spend is paying dividends and the results are merely the effect. I expect great quarters like this to continue for the company and its CEO quickly becoming one of my favorites.
3. Green Thumb (GTBIF) -- Earnings Review
a) Demand
Green Thumb guided to at least flat sequential growth or around $242.6 million in sales while analysts were looking for $248.7 million. It generated $254.3 million in sales, beating expectations by 2.3%.
More demand context:
Demand growth was powered by New Jersey rec sales, continued strength in Illinois, 19 new shops YoY and rising same store traffic.
Retail revenue rose 11.7% QoQ.
QoQ same store sales grew 9.9% while YoY same store sales fell 1.5%. It seems like the worst of the post-pandemic pull-forward hangover is behind us.
Ticket size fell but more traffic more than made up for it.
b) Profitability
Analysts were expecting $72.5 million in adjusted EBITDA. Green Thumb posted $78.7 million, beating expectations by 8.6%.
Analysts were also expected $0.04 in earnings per share. Green Thumb earnings $0.10 (fully diluted) per share, shattering expectations. Lack of 280E reform proved to be no problem for the company. I borrowed Green Thumb’s graphic from its Q1 report as a reminder of what 280E reform would mean:
More margin context:
Gross margin suffered a 150bps headwind from re-allocating more expenses into the input cost bucket starting this quarter. Without this change, gross margin would have expanded 30bps sequentially and fallen 440bps YoY.
Adjusted EBITDA includes $15 million in non-operating adjustments.
SG&A shrank to 25% of sales vs. 32.5% YoY. That made me very happy although it was partially related to a one-time non-cash item.
The company is beginning to see some pricing stabilization across markets with some room to go.
Cash flow from operations was negative, the result of 2 large tax payments in Q2 totaling $65 million vs. $0 in the first quarter. It’s now up to date on tax payments.
SG&A growth was powered by one-time items and would have grown 2% sequentially on a normalized basis.
c) Balance Sheet
Last Q had $174.5M in cash and equivalents vs. $244.2M in debt. Now has $145.3 million in cash and equivalents with $253 million in debt. Ben was asked explicitly about his willingness to add leverage to the balance sheet. His bias remains heavily skewed towards internal financing considering how much more affordable it is vs. restrictive capital markets. But he also added that all M&A is still on the table.

Considering how artificially expensive debt issuance is for these companies, dilution is understandable for now. But it’s still very much worth noting. With American cannabis operators under the current regulatory framework, dilution is often the most efficient source of new capital.
“Considering the punitive tax road and fickle capital markets, we continue to focus on cash at Green Thumb.” — Founder/CEO Ben Kovler
d) Notes from Founder/CEO Ben Kovler
On Individual States:
New York is shaping up to be another California for now -- unfortunately. Expectations there have been greatly tempered.
New Jersey was the “star of the portfolio” with its rec sales turning on and no supply issues to date. Connecticut and Rhode Island will flip this year as well.
Illinois has started to issue social equity licenses after two years of “frustration.” That led to a nice uplift in the state during the quarter.
Minnesota edible sales went live this month to “very strong demand.”
Virginia’s loosening of med card regulation is juicing card demand.
On Margins:
State diversification and an ability to push more product through retail vs. wholesale via its large state footprint and vertical integration allowed it to combat very real pricing pressures in a few states.
The company pushed $9 million more into its dispensaries in Q2 vs. Q1.
It’s leaning into its “&Shine” brand in light of strong demand. This cheaper brand comes from similar margins vs. premium products via lower input costs.
On Macro:
“While the market will continue to fluctuate based on various economic factors, it does not change the fact that cannabis is a growth industry with strong demand tailwinds.” — Founder/CEO Ben Kovler
e) Notes from CFO Anthony Georgiades
Terrible macro could eliminate weaker comp with heavier reliance on wildly expensive external funding.
CPG revenue fell 12% QoQ as Green Thumb leaned into retail.
The company has “taken steps to limit SG&A growth through the rest of 2022 to combat macro pain.
f) My Take
This was a shockingly good quarter to me. The firm guided to flat sequential growth and shattered those expectations. The headline 49.5% gross margin was the sore spot, but the reasoning behind it (change in accounting) made that entirely ok. This is why it’s so important to read through ALL of the earnings materials vs. just the release. At Stock Market Nerd, we do it for you to save you hours and hours of valuable time. Great quarter.
4. Match Group (MTCH) -- Earnings Review
Match Group guided to a midpoint of $805 million in sales while analysts expected $804.3 million. Note that this guidance assumed a 500 basis point FX headwind. Match posted $794.5 million in revenue with a 700 basis point FX headwind. Specifically, it would have posted $807.5 million in sales in the FX headwind assumed in its previous guide didn’t worsen. In other words, the shortfall was not demand driven.
a) Demand
More context on Demand:
Tinder RPP declined by 1% YoY (+5% FXN) and Tinder revenue rose 13% (+20% FXN).
RPP across the portfolio grew 9% YoY on an FXN basis.
The 2021 Hyperconnect acquisition continues to weigh on YoY growth comps.
Established app payers and revenue fell over 10% YoY. Tinder and Hinge outperformed to make up for some of the weakness -- but not all of it.
Match now expects a $163 million larger headwind than originally assumed from the strong dollar in 2022. This has cost the company $74 million in year to date revenue and is the source of Q1 and Q2 misses.
b) Profitability
Match Group guided to $292.5 million in adjusted operating EBITDA. It posted $286 million, missing expectations by 2.3%.
More context on margins:
GAAP operating and cash flow margins were severally hit by a $441 million charge in legal fees resulting from Tinder Founder lawsuits. Adjusted operating margin accounts for this. Importantly, these legal matters are now completely behind them (you are not a part of the company).
Gross margin compression is via Hyperconnect and app store fees as a % of revenue growing from 17.5% to 19.5% YoY. Importantly, the digital markets act (DMA) in Europe is expected to provide relief here starting in 2023.
Operating costs rose by 62% YoY but 86% of that rise was via Hyperconnect integration and impairment charges.
Sales and marketing as a % of revenue fell from 18% to 15% YoY.

c) Balance Sheet
Match Group’s net leverage ratio back to 3.0X as of last quarter, it reinstated a buyback program with 12.5 million shares authorized or nearly $1 billion in equity and continued this quarter with around $210 million in purchases. These buybacks will continue.
Stock based compensation as a % of revenue is at a modest 7% for the company.
It has $473 million in cash & equivalents & $3.9 billion in long term debt.
It also has an un-tapped $750M credit revolver.
d) Guidance
Q3 2022:
Analysts were looking for $887.7 million in Q3 2022 revenue. Match’s guide of $795 million missed expectations by over 10%. Note that this guidance now assumes an 800 basis point FX headwind vs. 500 basis points previously assumed. Specifically, this erased $60 million from this guide. Market share remains healthy, macro is just far more difficult than leadership assumed it would be.
Analysts were looking for $310.7 million in adjusted operating income. Match guided to $257.5 million, missing expectations by 16.9%.
According to Match leadership, Adjusted operating margin will be 100-150 basis points (so 33.0%-33.5%) better in Q4 2022 vs. Q3 2022.
Match didn’t offer 2022 guidance this quarter but did say growth would accelerate from 0% in Q3 2022 and accelerate further throughout 2023. Following the call, mean analyst 2022 revenue and profit estimates fell by nearly 7%.
“We remain confident that this business can return to mid to high teens revenue growth. It comes down to execution.” — CFO Gary Swidler
“I’m confident that in the second half of 2022 the re-prioritization of the product roadmap, the new team and the gaming experience Mark and I bring will enable Match to make meaningful product progress and position it to achieve growth rates in 2023 and beyond that are more consistent with our aspirations.” — CEO Brian Kim
e) Notes from New CEO Bernard Kim
Kim purchased $1 million in stock after the call. This is common for a new CEO but is a sizable part of his $16 million net worth.
Kim’s Initiatives:
Raise portfolio collaboration to learn more from other apps in the family.
Innovate more noticeably and expediently with things like alibi dating products to invite nervous users into the fold.
Re-focus on the core apps. Match is delaying metaverse and digital currency investments.
Use his a la carte expertise with Zynga and EA to raise the 15% payer penetration at Match Group.
Rightsizing marketing spend on legacy apps to enhance profitability. This was disappointing to me as previous leadership had assured us they were already doing this.
“Dating apps are still less than 50% penetrated in all developed markets. I would not have taken this job if I thought the market was saturated.” — CEO Brian Kim
Hyperconnect:
“The acquisition has not gone to plan in our first year. Core products are struggling with more competition and Apple’s targeting changes… the bar has been raised for future non-dating acquisitions.” — CEO Brian Kim
Azar (the largest app Hyperconnect owned) is beginning to shows signs of improvement and the company is confident in a growth re-acceleration here in the future.
Note that this firm does significant business in Turkey where currency destruction has been immense.
Tinder -- the most disappointing part of the report:
“I believe Tinder’s overall product execution and velocity can be improved. We need to execute better… There have been some misfires and turnover on the team that have delayed product and execution in 1H 2022. We can right the ship, but it will take time to build momentum.” — CEO Brian Kim
Tinder is a large source of the company’s weak guidance. The explore page -- which it had invested heavily in -- has been “much weaker” than expected. Other product launch initiatives have also vastly underwhelmed.
Tinder CEO Renate Nyborg was fired and Kim will be the interim Tinder CEO while personally finding a replacement. Several other executive positions were moved around and Kim brought on Mark van Ryswyk to be the apps new chief product officer. The two have worked together for 15 years.
Kim wants Tinder to ship products more quickly and effectively. Good plan.
The female subscription package is still in the works for later this year.
It’s pulling back on Tinder coin investments:
“I love the idea of virtual goods and currency in Tinder, but I believe it hasn’t been approached in a completely logical way… usually you roll out goods first then launched currency. While it’s frustrating to pause the efforts, I think that Mark and I can deliver the right value prop to make this a long term revenue stream.” — CEO Brian Kim
Emerging Brands:
BLK, Chispa, Upward and Stir will generate $75 million in 2022 revenue vs. $0 in 2019.
Match thinks The League’s $100 in revenue per payer is sustainable:
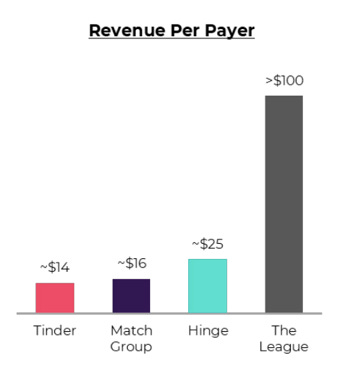
Hinge -- the best part of the report:
Match reiterated Hinge’s 50%+ growth guide. The affluent cohort it serves is holding it perfectly.
The localized German product release saw great organic traction. That prompted Match to lean in on external marketing for Hinge in Germany.
Kim plans to accelerate international expansion plans from 1 market per quarter to 2.
g) Notes from CFO Gary Swidler
On macro -- Match seemed slightly less confident in its macro-insulation vs. previous calls. That annoyed me:
“The consumer is facing significant pressure from rising gas and food prices, constraining purchasing power. Our product is a small purchase creating happiness, so consumers are less likely to stop. If the economy worsens, we expect resiliency but we may see modest effects on some of our brands... subscriptions are sticky but a la carte not so sticky.” — CFO Gary Swidler
The Japanese recovery that Match had gotten so excited about last quarter did not continue into this quarter as cases there rebounded higher once more.
h) My Take
This was a surprisingly disappointing quarter and guide from the company. I remain optimistic that Bernard Kim is the right person to lead this company and continue to be a shareholder. That will not change, but my conviction in the name has taken a hit. Still, this company has 50% global market share of a sector growing 10%+ for the foreseeable future. That’s a great place to be -- Match just needs to do a better job executing and I’m confident that Kim will do just that. He made necessary changes to the leadership team and is pulling back in all of the areas that he needs to. Tough quarter -- long term thesis intact.
Click here for my Match overview.
5. Revolve Group (RVLV) -- Earnings Review
“We delivered these results despite macro conditions becoming more challenging as the quarter progressed, creating profit pressures and moderating growth in June which continued into the third quarter.” — Founder/CEO Mike Karanikolas
a. Demand
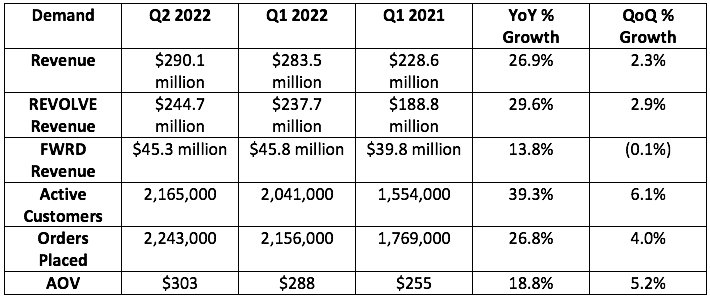
More Context on Demand:
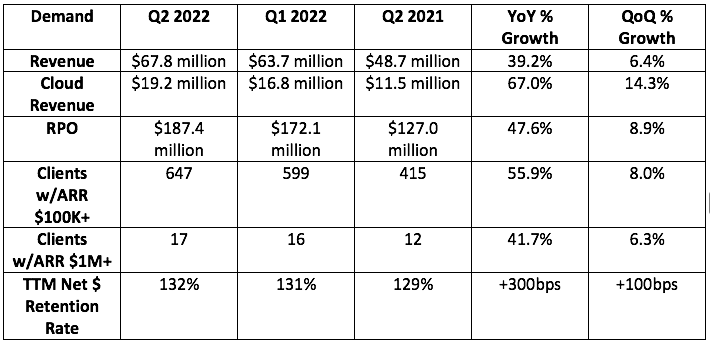
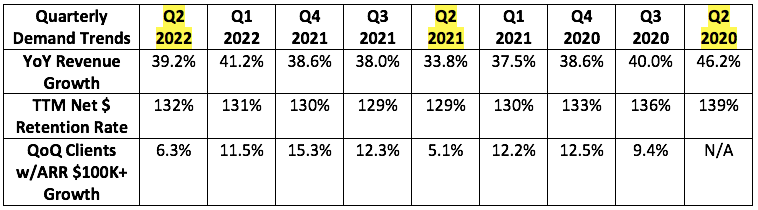
FWRD had its best Q ever with 151% growth in Q2 2021. This made YoY comps difficult.
FWRD 3 year CAGR of 36%.
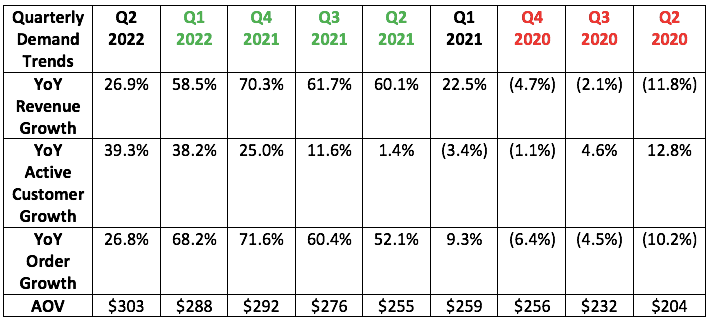
Revolve’s heavy live event marketing presence & “going-out” niche suffered greatly amid the pandemic. The largest headwind quarters are highlighted in red. The flip side of that was easy comps into early 2022. Those quarters are highlighted in green.
Domestic revenues grew 30% YoY and international sales grew 14% YoY due to stronger US dollar and China pandemic measures.
This was Revolve’s largest net customer add 2nd quarter ever.
Net sales per active customer rose 9% YoY to $488. This is encouraging given rapid new user growth and that sales per user usually starts at a bottom. These new customers are buying at full price at a higher clip -- not being acquired through discounts.
Revolve’s 3 year revenue CAGR sits at 21%.
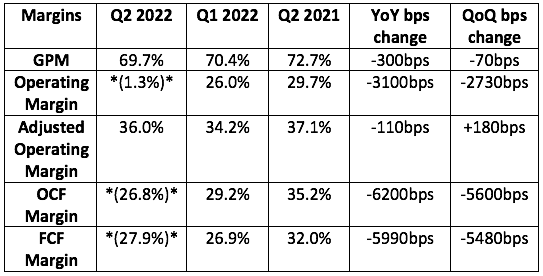
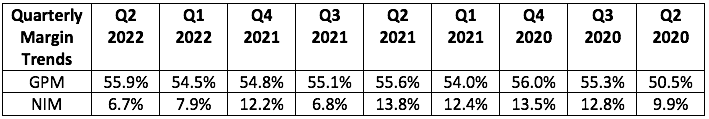
b) Profitability
Revolve guided to a gross profit margin (GPM) of 55.3%. It posted a GPM of 55.9%, beating expectations by 60 bps. This was its highest ever Q2 GPM.
Analysts expected $33.2 million EBITDA. Revolve posted $26.9 million, missing expectations by 19.0%.
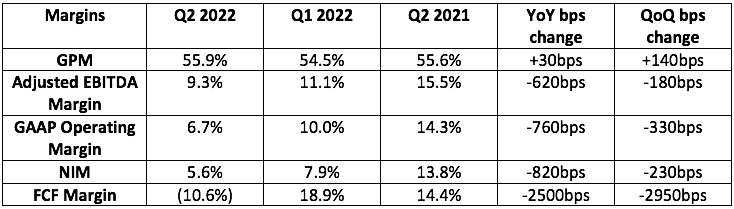
More Context on Profitability:
Strong GPM was the result of the unexpectedly high percent of sales at full price. This is expected to moderate in Q3 with a 53.5%-54.0% GPM expected.
YoY net income growth was severally impacted by a 3% tax rate in Q2 2021 vs. about 23% this quarter. Furthermore,
Revolve.com set a record gross margin with 58% this quarter while FWRD came in at 47%.
Six key factors weighed on operating, cash flow and net margins:
Fuel surcharges rose 60% sequentially which raised selling and distribution costs to 18% of sales vs. 14% YoY.
Return rate rose as dresses became a larger percentage of Revolve sales at 32% vs. 24% YoY. The rising return rate was expected but Revolve did not expect the dresses category to come back so strongly which meant higher return rates. Localization efforts (explained below) in Canada also contributed to this.
Revolve’s tax rate was 23% vs. 3% YoY.
Marketing efficiency worsened which prompted the company to spend more to generate desired growth. This caused marketing costs of 18% of sales vs. 15% YoY. It now sees this line item at 17.3% of sales for 2022 vs. 15.8% previously guided to.
$5 million set aside for a “legal matter.” This wasn’t clarified.
A large inventory build specifically weighed on cash flow margins and turned them negative. Specifically, inventory rose 75% YoY.
c) Balance Sheet
Revolve’s balance sheet is as pristine as things get with $238 million in cash vs. $219.6 million YoY and $0 debt. The one sore spot is the aforementioned aggressive inventory build. That purchasing was in response to “robust demand” that has since slowed to 10% YoY growth in July. CFO Jesse Timmermans called inventory levels “higher than we’d like.” It’s not concerned about the quality of the apparel, but is working to right-size this issue. That could mean a hit to margins in the near term. The company dealt with something similar in 2019 when inventory levels became bloated. It had since addressed that issue with internal inventory management controls. It was disappointing to me to see these issues re-surface -- especially with how immune the company thought it was from macro pressures as of last quarter. This immunity made sense to me given the affluence of its user base -- but it’s apparently insulated, not immune.
Revolve’s cash balance has 5Xed since it went public in 2019 with zero external financing. The balance sheet is of no concern. Furthermore, it’s the most conservative company in my portfolio when it comes to paying out stock-based compensation. Share count grew 0.3% YoY; love to see it.
d) Guidance
Revolve didn’t offer formal demand or profit guidance. It did tell us to expect further moderation to its 10% YoY growth rate in July which was a negative surprise.
Following its report, analyst 2022 revenue expectations fell by 4.5% with EBITDA expectations for 2022 falling by 35.0% -- brutal.
e) Notes from Co-Founder/Co-CEO Mike Karanikolas
On the outlook:
“The team has seen multiple economic cycles over 20 years, and we have complete confidence in our ability to execute through the most challenging environments. Our team and technology are battle tested and we are primed and ready for what lies ahead.”
On the return rate:
Revolve’s debuting of hassle free returns in Canada has led to return rates there doubling since launch. At the same time, sales in the region has quadrupled since launch. This is a tradeoff Mike will “make all day long.”
f) Miscellaneous notes from Co-Founder/Co-CEO Michael Mente
Revolve’s TikTok views doubled QoQ and tripled YoY
Its first plus sized brand will launch next week.
New upgrade to the tech stack raised conversion rates during the quarter along with a new ML model with real time recommendations to “complete the look.”
Launched FWRD Buyback: A re-sale program for “circular luxury shopping.” This allows customers to exchange goods for Revolve credit as well. This program is exceeding expectations with 40% inventory sell-through in a couple of weeks.
FWRD and Revolve shopper overlap continues to rise every month. The brand ambassador program will expand to FWRD this year.
“We continue to demonstrate a unique track record for outperforming the competition in times or disruption and volatility… while there is considerable uncertainty ahead… I know we are in a position of strength and believe we are well position to gain more share in the years to come.”
f) My Take
Revolve’s team overestimated its insulation from macroeconomic pain. Its luxury niche is still holding up comparatively well, but not as well as everyone thought it would. This was a disappointing quarter to me and I think Revolve has likely found itself back in the institutional penalty box like in late 2019. The re-surfacing of inventory issues make me anxious, but the rest of the reasons for the weakness I found to be acceptable -- especially considering continued market share gains. I’m not pausing my accumulation of this name, but I’m in no hurry to add to my stake.
6. JFrog (FROG) -- Earnings Review
Analysts expected $65.5 million in sales for the quarter with JFrog guiding to the same. It posted $67.8 million in sales, beating expectations by 3.5%
a) Demand
More demand context:
•Frog Complete (its full suite of products) is now 36% of sales vs. 35% QoQ and 32% YoY. This is its highest margin package.
JFrog had guided to 50%+ cloud growth for the quarter. It surpassed that comfortably. Partner channels like AWS were credited for this outperformance.
Cloud is now 28% of sales vs. 26% QoQ and 24% YoY.
b) Profitability
Analysts expected a loss of 3 cents per share for the quarter. JFrog lost 2 cents, beating expectations by a penny.
JFrog guided to a non-GAAP operating loss of $3 million with analysts expecting a gain of $0.7 million. It lost $2 million, beating its internal guide, but missing analyst estimates.
Many newer public companies try to operate at breakeven to support growth -- yet end up burning large sums of cash. JFrog’s team is showing strong discipline and precision in these targets quarter after quarter.
Context on profitability:
This was always expected to be JFrog’s profit trough quarter. Consistent operating leverage is now expected going forward.
Cloud GPM continues to consistently expand quarter after quarter.
c) Balance Sheet
JFrog has $430.2 million in cash and equivalents vs. $428 million last quarter.
$0 debt.
Diluted share count grew 5.6% YoY as JFrog’s IPO awards continue to dilute shareholders. This should slow in the coming quarters (and needs to).
d) Guidance

More notes on guidance:
Cloud growth will continue to exceed the “mid 50% range”
Third quarter guidance was similarly ahead of expectations on the top line, below analyst forecasts for operating income and in line for net income.
JFrog reiterated staying at or above 30% long term growth for the long term despite any macro challenges.
JFrog expects an 83-84% GPM for the second half of the year.
e) Notes from Founder/CEO Shlomi Ben Haim
On Customer Wins:
JFrog signed its 2 largest hybrid cloud deals ever including “one of the world’s largest travel and hospitality booking companies.”
One of the world’s largest Financial Institutions migrated “part of their IT assets” to JFrog’s Cloud and raised their annual spend by 67% YoY.
One of the world’s largest integration and API platforms left Sonatype Nexus for JFrog.
A global technology hardware company went with JFrog to modernize its software supply chain in a competitive replacement.
JFrog Connect (its newest module) is “seeing early enterprise demand.”
JFrog added new integrations for Artifactory and Xray with ServiceNow and Microsoft Teams during the quarter.
“We are excited to report multi-year deals signed with some of the world’s leading enterprises.” — Founder/CEO Shlomi Ben Haim
On Security:
JFrog is on track to integrate Vdoo assets this year with an “advanced security package” to be up-sold to existing and new Xray subscribers.
That package is in beta and will go live in Q3.
On Macro:
“A downturn in the global economy requires companies to look at their businesses efficiency and profitability. Our renewal rates both on-premise and in cloud have remained robust and continue to perform very well. In addition, cloud continues to see positive usage trends. However, during the second quarter, we started to see elongated sales cycles for large new business deals. APAC -- our smallest geographic region -- has also seen slower levels of DevOps adoption vs. expectations. This is all accounted for in our guidance.” — Founder/CEO Shlomi Ben Haim
It’s impressive to me that the beat and raise guidance is considered to be overly pessimistic by leadership.
f) Miscellaneous Notes From CFO Jacob Shulman
On-prem/self-managed grew 31% YoY. This rate is expected to slow with the growing cloud migration
Shulman reiterated a breakeven operating profit guide for 2022. To get there, the team has “accelerated initiatives to improve efficiency.”
g) My Take
This company has quickly become a wonderfully boring beat and raise machine. When it says it will do something, it either meets that expectation or exceeds it time and time again. This is an extremely easy company for me to own and this quarter was merely another data point supporting that stance.
7. Penn Entertainment (PENN) -- Earnings Review
Penn National Gaming changed its name to Penn Entertainment to more explicitly state where it thinks its future lies -- with Barstool and Score Media.
“Despite economic headwinds, we delivered consistent performance across our retail portfolio in the quarter and into July.” — CEO Jay Snowden
a) Demand
Analysts were looking for $1.60 billion. It posted $1.63 billion, beating expectations by roughly 1%.
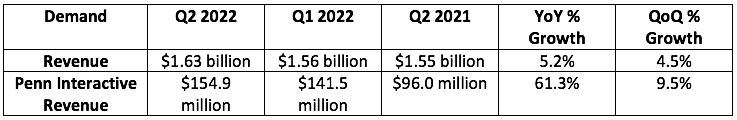
More Context on Demand:
Penn has now added 1.2 million “mychoice” loyalty program members over the last 12 months. It had about a quarter million total members last fall. Loyalty program members grew in excess of 6% sequentially for Penn’s 3 youngest demographics to offset older demographic declines. Its user base is getting younger -- thanks to Barstool and as planned.
19% YTD retail handle market share ex-Nevada rose 400bps sequentially.
Visitation and engagement trends remain positive into this quarter.
Barstool Retail Sportsbooks continue to greatly enhance its legacy brick and mortar casino business.
Penn Game Studios (its internally built casino games) has 3Xed since the end of 2021 while Penn iCasino revenue overall grew 81.4% YoY.
Score grew sales 11% YoY with its toughest pandemic comps.
Same store sales rose 3.5% QoQ and fell 2.7% YoY vs. the stimulus pull-forward.
Score Bet Launch in Ontario Stats:
76% of theScore media’s app users are using the bet feature.
Betters deposit 37% more per user and generate 67% more handle per user
50% of sports gamblers are cross sold to iCasino products.
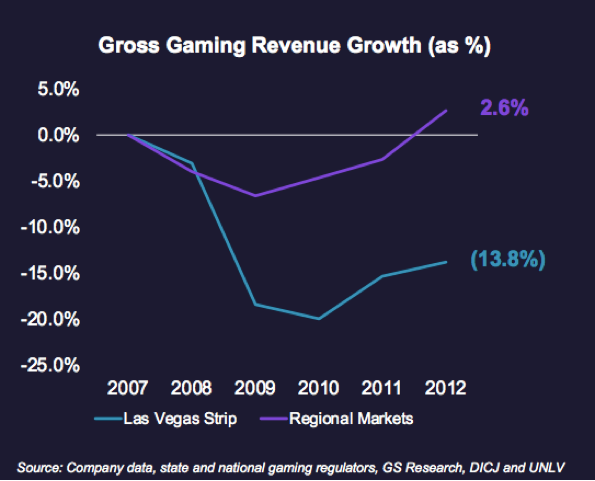
On Penn’s Recession Resistance:
“Regional markets performed far better than the Strip following 2008 and the current operating environment is more favorable today. Marketing environment has rationalized which is letting Barstool take more gambling share.
Growth in younger demos offsetting declines in older demos.
Penn thinks it can offset around half of all demand declines with cost controls. Sees property level margins above 30% regardless of how bad things get.
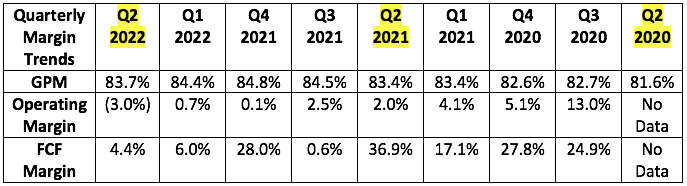
b) Profitability
Analysts expected $497.6 million in EBITDA. Penn earned $476.5 million, missing expectations by 4.2%. Analysts also wanted $0.50 in EPS. Penn doesn’t guide to this, but sharply missed expectations with $0.15 in EPS. This was largely related to interest expense rising 40.3% YoY and things like hotel renovations juicing other expenses.
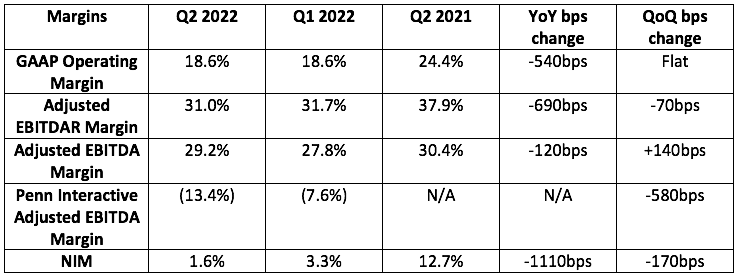
More context on margins:
Property level EBITDAR margins were 37.2%. Most of the margin compression is via Penn Interactive’s rapid growth.
c) Balance Sheet

d) Guidance
Penn reiterated its 2022 guidance offered last quarter:
$6.35 billion in 2022 sales
$1.94 billion in EBITDAR
Penn continues to expect $300 million in capital expenditures
e) Miscellaneous Notes from the Report

f) My Take
This wasn’t a perfect quarter, but there were far more positives than negatives. The reiterated 2022 guide is the highlight with the quarterly net income being the lowlight and they need to get expenses under control. I’m excited to see where Barstool’s market share can go now that irrational promotional spend on share has greatly slowed amid worsening macro. This company has all the assets to be a powerhouse in North American gaming, and I see it as well on its way to becoming that. Good enough report.
8. Meta Platforms (META) -- Debt Raise and Miscellaneous
Meta is raising $10 billion in new bonds. This is its first debt raise ever. Internal capital is always the cheapest source, followed by debt, the convertibles and then equity. An ability to lever up the balance sheet is a luxury that Meta has earned. Its wildly stable cash flows can comfortably cover what will surely be modest servicing/interest payment -- so why wouldn’t it add fire power to the balance sheet. May as well continue to buy back absurd amounts of stock to juice equity returns while being able to invest heavily in speculative projects. I support this and would support Meta’s new buyback cadence mirroring Apple’s more closely with this new infusion.
Miscellaneous:
Meta is pausing plans to buy Within amid the FTC lawsuit.
Several Meta Executives including Instagram’s CEO are re-locating to London.
Meta is launching new digital wallet Coinbase and Dapper Labs integrations to create broader crypto and NFT interoperability and social use cases among the Family of Apps.
9. Lemonade (LMND) -- Metromile Asset Sale
Lemonade sold Metromile’s Enterprise Business Solutions (EBS) platform to EIS. This was its white-labeled claims and fraud automation platform it licensed to other carriers. That’s not Lemonade’s model -- it dabbled here early on but largely has shut down the program -- as it is looking to displace, not support others. The proceeds weren’t shared but it merely adds to the quasi-cash raise Lemonade essentially conducted with its Metromile purchase. The balance sheet is strengthening and now margins need to start moving in the right direction.
10. Shopify (SHOP) -- New Partner & Investment
Klaviyo -- an enterprise level email support engine -- and Shopify are partnering for its Shopify Plus offering. This will cater to largest clients with vast scalability needs to offer more support and utility. Shopify is also investing in Klaviyo.
Click here for my Shopify overview.
11. The Trade Desk (TTD) -- Case Study and Apple
a) Case Study
Samsung’s "Publicis" has worked with The Trade Desk to raise efficient ad conversions. The Trade Desk ran extensive split testing to uncover optimal practices such as adding cross-device targeting. Here were the results:
113% more conversions with cross-device targeting with 11% of that rise directly attributable to that one change.
53% lower cost per acquisition
b) Apple
It seems as though Apple is building a team to create a demand side ad platform. Not to sound overly confident, but the long list of Apple’s inherent conflicts of interest and its protective walled garden will keep The Trade Desk’s demand engine in high demand within its open internet niche. This is an intimidating headline, but doesn’t concern me all that much.
Click here for my TTD Deep Dive.
12. Macro
a) The Week’s Data
The ISM Manufacturing PMI came in slightly below expectations at 52.8 vs. 52.0 expected and 53.0 last month. Nice beat (and another data point supporting a continued hawkish fed cadence). Anything above 50 means expansion.
The ISM’s non-manufacturing Employment Index for July shattered expectations at 56.7 vs. 53.5 estimated. It looks like labor supply is BEGINNING to re-enter. But labor force participation has a long way to go.
Initial Jobless Claims was in line at 260,000
Non-farm payroll more than DOUBLED expectations at 528,000 vs. 250,000 expected.
JOLTS job openings dropped 605,000 MoM for its 3rd largest drop ever. It still sits at a lofty 10.7 million with 1.8 jobs per seeker.
Walmart cut hundreds of corporate jobs.
The Logistics Managers Index for June points to some supply chain improvements.
The Atlanta Fed GDPNow estimate has already fallen from 2.1% to about 1.5%.
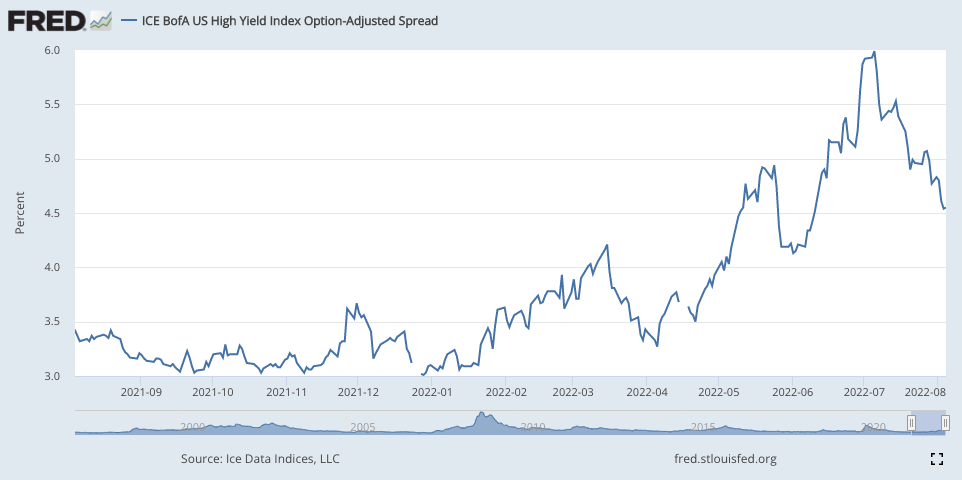
High Yield Corporate Credit Spreads continue to look better and better:
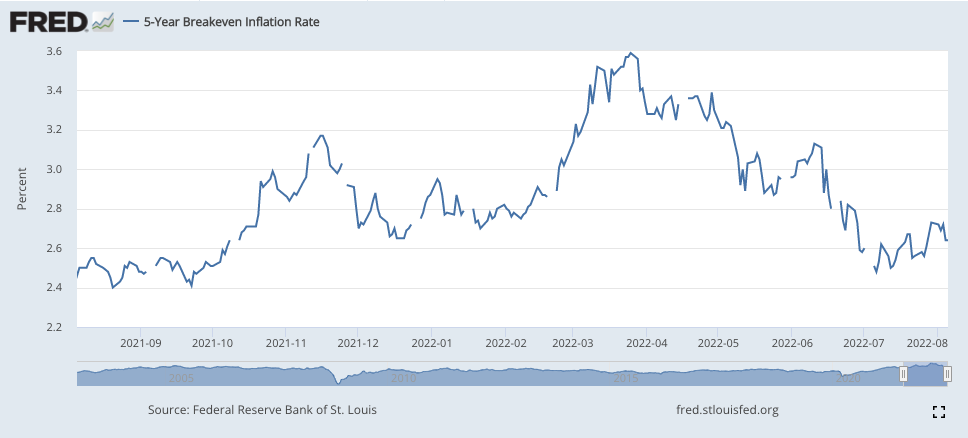
5 year Breakeven Inflation Chart:
b) Level Setting the Data
We remain in a tough spot for the Federal Reserve. Layoffs and consumer confidence and creeping credit spreads all point to economic deterioration. Simultaneously a surprisingly strong jobs number (with a bit of fudging in it but still) makes the “strong labor argument” even more believable. So with inflation still WELL above long term targets and its other employment mandate showing durability, it has permission to continue aggressively hiking. That’s what I expect -- not an all clear rally straight back to all-time highs. Things are rarely that easy. 2021 was the anomaly.
Still, the economic cracks get deeper every single week. And eventually, that will force a dovish pivot. Whether that’s end of 2022 or 2023 is anyone’s best guess. For now, I remain predominately invested with a 16% cash position ready to deploy into incremental multiple compression. Note that the position falling from 22% to 16% recently was more to do with rising equity prices vs. allocating cash. I’ve still been relatively conservative with that deployment -- partially because I haven’t had a cash infusion to add in a few months.
13. My Activity
In case you missed it, I published a SoFi Earnings review and a PayPal earnings review during the week.
I purchased a bit of Match Group during the week. If you’d like to be told that in real-time, for free and with access to my updated portfolio, click the button below:

Have a wonderful weekend… I’ll be napping.