

News of the Week (May 2-6)
News of the Week (May 2-6)
Progyny; Match Group; Penn National Gaming; Revolve Group; Green Thumb; Shopify; Upstart; CrowdStrike; The Trade Desk; Meta Platforms; SoFi Technologies; Duolingo; Macro; My Activity

Today's piece is presented by FTX.US:

1. Progyny (PGNY) -- Earnings Review
“These strong results demonstrate that our member activity has returned to the levels we typically expect to see. Based on what we see, we believe that the impact of the Omicron variant is behind us.” — CEO Peter Anevski
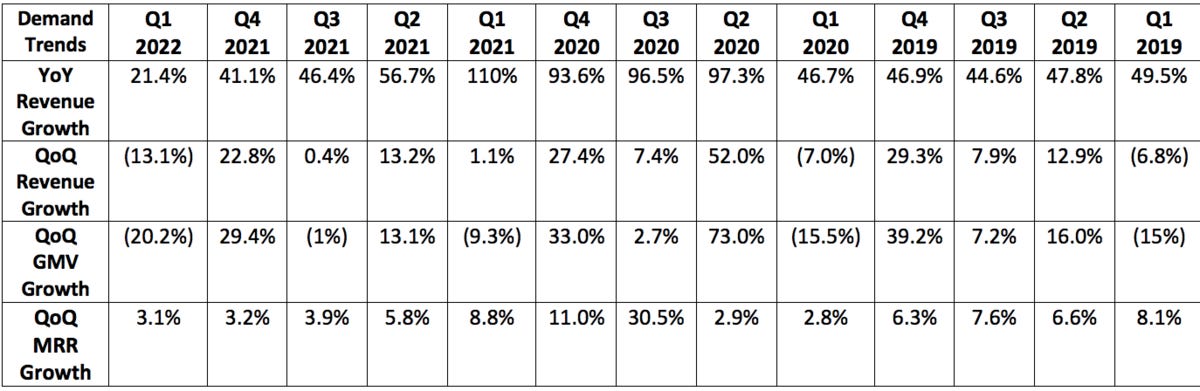
a. Progyny Demand
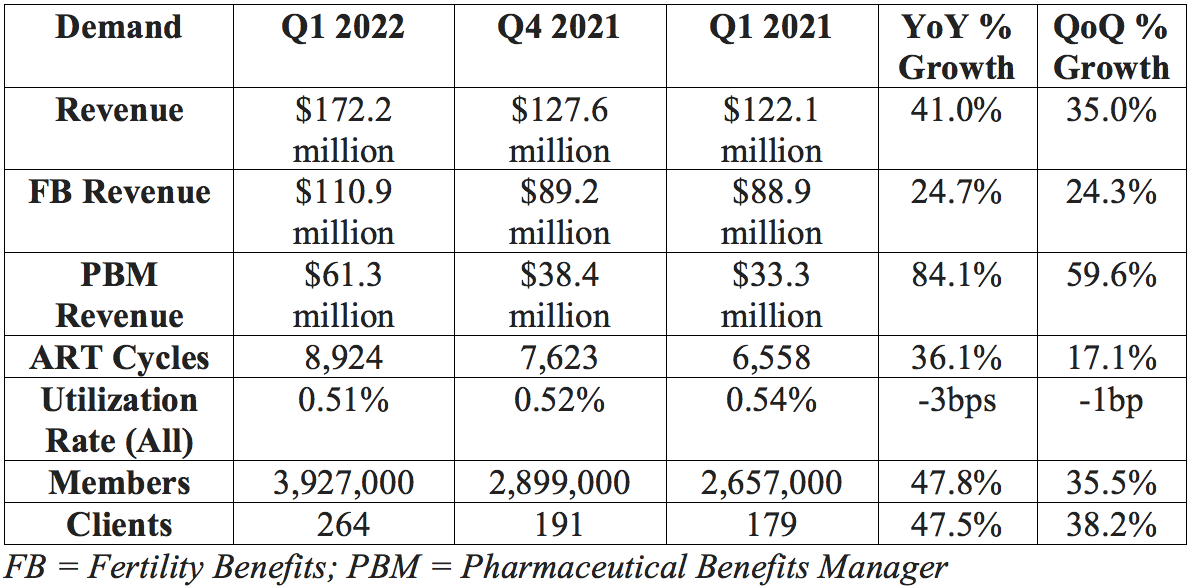
Progyny guided to $167.5 million in revenue with analysts expecting $167.2 million. Progyny posted $172.2 million, beating its guide by 2.8% and analyst estimates by 3.0%.
More context on demand:
Note that The Society for Reproductive Assisted Technology (SART) suspended all new fertility treatment cycles (so a large portion of Progyny’s revenue) in Q2 2020 with that suspension ending in Q3 2020.
The first quarter -- with normal comps -- is always Progyny’s best sequential quarter for growth. This is due to selling season wins usually going live at the beginning of the following year.
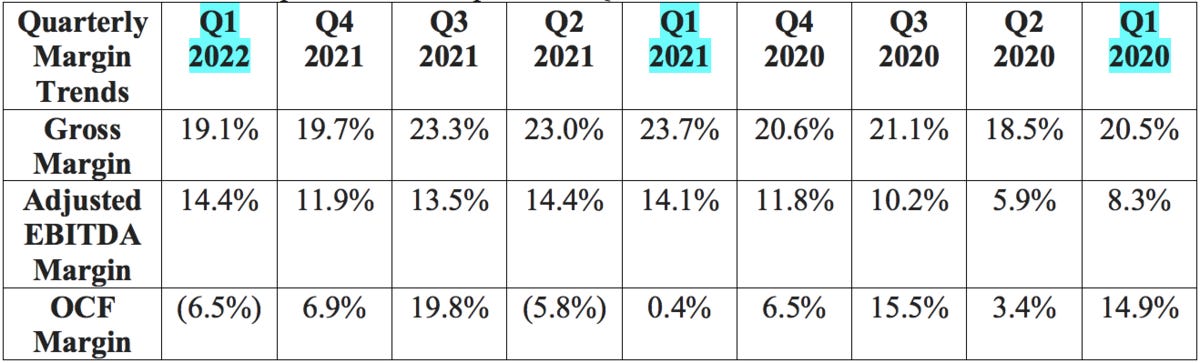
As this is not a SaaS/recurring revenue business and does have some real seasonality to its results, it makes the most sense to compare growth rates to the same quarter from previous years.
This was the largest sequential step-up in volumes in company history

b. Progyny Profitability
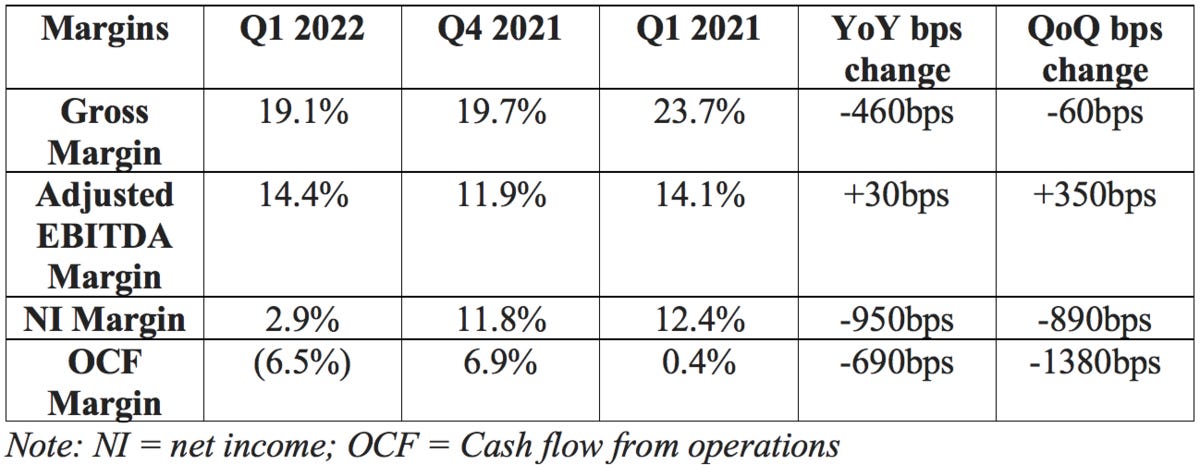
Progyny guided to a midpoint of $24 million in adjusted EBITDA for the quarter while analysts were hoping for $24.5 million. Progyny posted $24.8 million, beating its expectations by 3.3% and analyst estimates by 1.2%.
Progyny also guided to a loss per share of $0.02 with analysts expecting the same. This guide did not include any deferred tax benefits which Progyny enjoyed during the quarter. This resulted in earnings per share of $0.05.
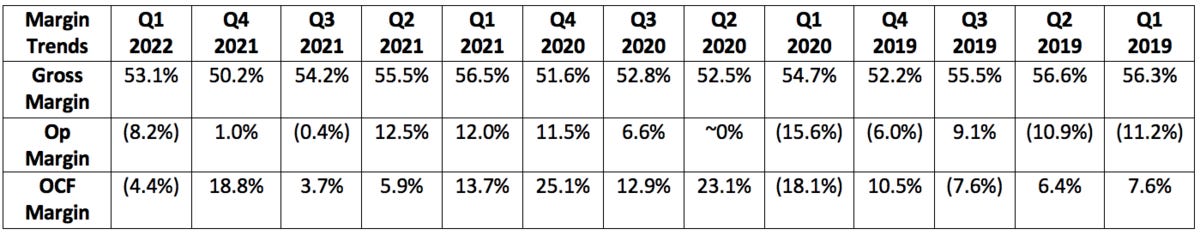
More context on margins:
Q1 2022 and Q4 2021 gross margin compression was powered by the newly issued stock grant that Progyny disclosed last quarter. Q1 2022 and Q4 2021 gross margins would have been 22.7% and 23.4% respectively.
Gross margin was further impacted by on-boarding issues with a new pharmacy partner during the quarter.
Net income margin was impacted by the same factor.
Sales & marketing as a percent of sales rose from 3.3% to 5.8% YoY due to this grant and would have fallen to 3.0% of revenue without the impact (similar for G&A rising from 10.7% to 13.4% which would have been 8.0% without the grant).
OCF margin compression was powered by a tweak to its pharmacy benefits manager contracts which benefitted its unit economics but lengthened payback periods which alters quarterly cash flow margins.
This impact was not in place for Q1 2021.
c. Guide
2022:
Progyny previously guided to $730-$775 million in 2022 sales. Progyny updated this to $735-$775 million for a midpoint of $755 million or a 0.3% raise. Analysts were looking for $751.3 million meaning this represents a 0.4% beat.
Progyny reiterated its previous guidance of $110-$122 million in adjusted EBITDA for a $116 million midpoint. This beat analyst expectations of $113.5 million by 2.2%.
Progyny reiterated its previous guidance of an incremental EBITDA margin over 19% -- pointing to continued margin expansion to come.
Progyny also reiterated its net income guidance of $0.03 at the midpoint. Analysts were expecting $0.29 BUT Progyny’s guide does not assume any discreet income tax benefits which it expects to continue enjoying in 2022.
Progyny also guided to 265+ clients and 4 million covered lives by July 2022. It is 1 client short and a few thousand members short as of today with “more clients (plural) to be on-boarded” from the 2021 selling season. It’s very much so on track. That still represents just 3% of its target market which doesn’t yet include schools, unions or other public employers.
Q2 2022 -- Progyny guided to the following:
$188-$193 million in sales for 48% growth at the midpoint. Analysts were looking for $189 million meaning Progyny's guide represents a 0.7% midpoint beat.
Earnings per share of $0.01 to $0.02 -- roughly in line with analyst expectations.
$28 million-$30 million in adjusted EBITDA. Analysts were looking for $28.7 meaning Progyny's guide represents a 2.5% midpoint beat.
CFO Mark Livingston also told us that “Gross margin will expand sequentially.”
d. Notes from CEO Peter Anevski
On patient outcomes -- based on the latest fertility data from the CDC and SART, Progyny's:
Pregnancy rate is now 17% better than the national average vs. 16% better last year.
Live birth rate now 27% better than the national average vs. 25% better last year.
Considering fertility treatment cycles cost $60,000 on average, more successful treatment is a massive employer/patient cost saver.
91% single embryo transfer rate (highest ever) vs. 90.1% YoY and multiple birth rate fell (good thing) from 2.8% to 2.5% YoY.
Having twins is both less safe for the mother and far more expensive for all stakeholders. It also raises chronic care costs associated with lower-weight infants post-birth.
National averages remain largely flat since 2015 while Progyny continues to improve.
“Other benefit managers don’t seem to be making improvements suggesting they either lack the focus or the ability.” — CEO Peter Anevski
On the selling season:
“Although we are in the earliest stages of our selling season, we are pleased with the level of sales closures and pipeline activity/size as well as the caliber of logos we are seeing thus far. Every measure we track is favorable to the record level of 2021 activity. We’ve had a healthy number of early commitments.” — CEO Peter Anevski
“The market for fertility benefits continues to mature as conversations with prospects are less and less about adding coverage and more about understanding the strength of our solution vs. others. This is giving us more opportunity to demonstrate how Progyny is differentiated with respect to member experience and outcomes.” — CEO Peter Anevski
Anevski told us that absolute customer and client adds will be larger in 2022 than in 2021. This implies minimum 2022 client growth of 32.2% and member growth of 30.8%.
e. Notes from CFO Mark Livingston
Quick notes:
83% of Progyny clients have ProgynyRx vs. 73% YoY. This is Progyny's fastest growing segment and continues to gain steam.
The utilization dip via Omicron had resolved itself by quarter’s end.
Treatment mix -- due to the frequent pauses and restarts -- skewed earlier on in treatment cycles. This means less Progyny revenue today but should mean shifting to higher revenue later in the year as treatment shifts to later-cycle.
f. My take
These were very solid results for Progyny. Modeling continues to be difficult for every company, yet it managed to deliver a small beat and raise. Incremental adjusted EBITDA margin over 19% points to much more margin expansion ahead and the successful selling season gears Progyny up for another year of explosive growth. This is an easy name to own, in my view.
2. Penn National Gaming (PENN) -- Earnings Review
a. Penn Demand
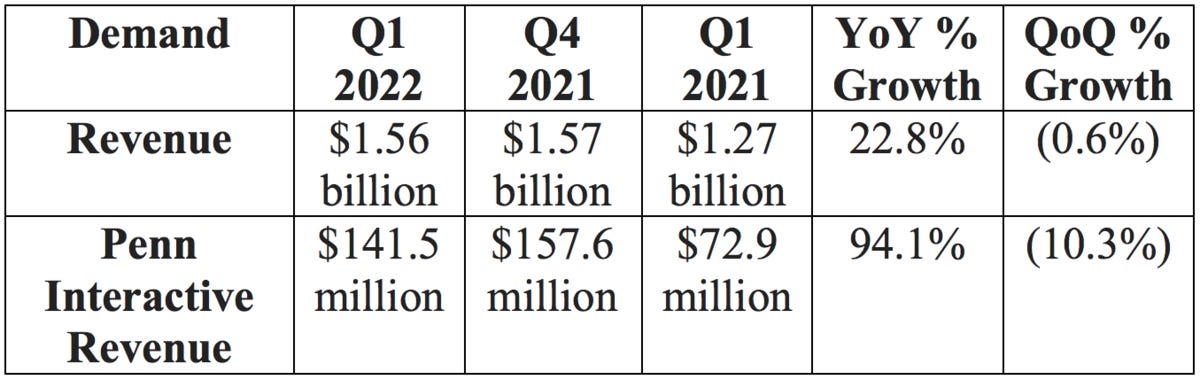
Analysts were looking for $1.53 billion in sales. Penn posted $1.56 billion, beating expectations by 2.0%.
More demand context:
This YoY Penn Interactive growth excludes the positive impact of gaming tax reimbursements. YoY growth was 128% YoY when adjusting for this.
Note that Penn had a solid 2021 where it grew revenue by 17% vs. the most recent pre-pandemic period. This YoY growth involves somewhat normal comps and also doesn’t benefit from the stimulus tailwind Penn enjoyed last year.
Penn's 21-34 year-old consumer cohort is up 83% since pre-pandemic as it has successfully evolved its demographic to younger consumers with longer spend runways.
b. Penn Profitability
Analysts were looking for:
$466.3 million in adjusted EBITDA. Penn Posted $434.6 million, missing expectations by 6.8%.
$0.45 in earnings per share. Penn posted $0.29, missing expectations by $0.16.
YoY net income was hit by $61 million in incremental “other expenses” along with another incremental $50 million in interest and taxation charges.

c. Guidance
2022 guidance:
Penn previously guided for $6.07-$6.39 billion in 2022 sales or a midpoint of $6.23 billion. This quarter, it raised that revenue outlook by 2.7% to $6.15-$6.55 billion or a midpoint of $6.35 billion. This came in ahead of analyst expectations of $6.3 billion by 1.6%.
Penn also previously guided to $1.85-$1.95 billion in adjusted EBITDAR for a midpoint of $1.90 billion. Now, it expects $1.88-$2.0 billion for a midpoint of $1.94 billion, representing a 2.1% raise.
“Q1 demand trends are continuing to date into Q2.” — CEO Jay Snowden
A strong outlook in this macroeconomic environment is notably impressive to me.
d. Investor Materials & Call Notes
On the mychoice loyalty program:
Penn added 355,000 net new customers to mychoice during the quarter. This was 17% above its net new adds last quarter and 33% ahead of its net new adds YoY.
“mywallet” -- its cashless, card-less and contactless payments system -- has shown to raise visit frequency by 18% and time on device by 22%. It has 53,000 downloads.
On theScore Bet’s Ontario Debut:
Penn offered the following data on theScore Sportsbook’s launch in Ontario, Canada on April 4th:
Top downloaded app since launch.
79% of gamblers use theScore Media in Ontario.
The debut enjoyed 37% more registrations and 28% more DAUs vs. the launches in Michigan and Pennsylvania due to first mover advantage.
Score’s Player Account Management (PAM) system allows for:
theScore Media integration (so you can place bets within Score Media if you have a Score Bet account).
Enhanced conversion due to full ownership of the on-boarding process.
Granular, contextualized promotions to raise activity and ROI with minimal, targeted marketing dollars. Barstool will eventually integrate this software.
“Ontario is off to a great start. I had high expectations and we’re doing better than I thought we’d do… Since launch, everyday thereafter we continue to see significant -- thousands -- of incremental daily downloads. And the churn has been low.” — CEO Jay Snowden
On Penn Interactive:
theScore grew sales 42% YoY with 1.6 billion user sessions and continues to "garner high levels of engagement."
Barstool will broadcast the Canelo vs. Bivol boxing match as an alternative stream and a further extension into live sports.
On the Balance sheet:
Penn bought back $175 million of its stock with $575 million remaining in the program.
$2.48 billion in total liquidity.
$923.5 million in net debt (rose sequentially due to using cash to buy back more shares).
Lease-adjusted net leverage 4.04X vs. 4.10X YoY.
Entered into a new $1 billion credit revolver (fully undrawn vs. previous revolver of $700 million), a 5-year $550 million team loan A and a 7-year $1 billion term loan B. These were used to pay off existing term loans. This was “leverage neutral.”
85% of its debt is fixed rate with the earliest maturity in 2026.
On Penn Interactive:
“Integrated media and retail operations have led to an “industry-low customer acquisition cost (CAC).”
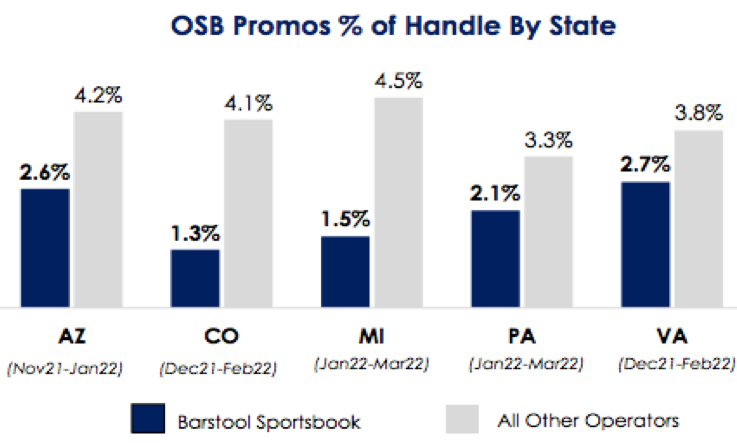
Barstool Sportsbook and iCasino is tied for 1st in sports betting apps with a 4.8* rating.
Since debuting in Louisiana, Barstool has gained 7.9% handle share but 12.4% gross gaming revenue (GGR) share and 10.6% net gaming revenue (NGR) share to show its relatively minimal promotional spend vs. competitors.
Handle counts promotional dollars while NGR does not. This is why Barstool's NGR share is so far ahead of its handle share -- it doesn't need to pay gamblers nearly as much in promotions to convince them to use the service.
Barstool iCasino GGR was $32.8 million for the quarter vs. $31.7 million QoQ and $15.5 million YoY.
Since launching an iCasino channel on Twitch, Barstool's "Coin Boys" is now in the top 1% of all of its programming.
On omni-channel market share gains:
Penn has YTD 18.6% of total U.S. Retail Sportsbook market share ex-Nevada. Penn reported this at 12.0% just one quarter ago!
Penn’s NGR share across Pennsylvania, Michigan and Arizona was 10.7% this quarter vs. 8.4% last quarter.
Its Vegas property (M resort) now doing quadrupole the EBITDA it was a few years ago.
“Our interactive business continue to demonstrate how disciplined marketing, omni-channel cross selling, great products and owning our media strategy via Barstool and Score led to NGR market share growth in Q1 2022. We don’t lead with discounts and these structural advantages are proving themselves in best in class margins over the long term.” — CEO Jay Snowden
More interesting call notes from the team:
It thinks 37% EBITDA margins are sustainable for its properties.
Penn was “quite active in the quarter” with buybacks. It saw its stock at $46 as significantly undervalued and told us to assume it would continue to be “active.”
Penn is not seeing any drop off from its lower income cohort like some of its competition blamed on their own underwhelming results.
e. My Take
This was a largely positive quarter for the company. I didn’t love the profit miss, but the raised profit outlook for 2022 and the strong demand made that far more palatable to me. Barstool and Score are showing concrete signs of allowing Penn to grow its interactive segment with relatively little spend -- I continue to believe that will be a massively profitable growth level for it to pull in the years to come. Score is the most popular sports brand in Canada, Barstool is an American cult and Penn has both of them at its disposal to effectively, profitably compete.
Time in the Market Beats Timing the Market

Around 90% of day traders underperform the market, supporting Warren Buffett’s idea that time in the market is better than timing the market.
The best way to maximize your time “in” the market is through regularly scheduled investments.
Did you know that FTX US lets you schedule regular buys directly from your bank account, whenever you want?
Daily, weekly, bi-weekly, monthly, you pick the cadence for your portfolio. The best part? FTX US just announced stocks are coming soon.
There are no fixed minimum fees on transactions, and no ACH transaction fees whatsoever.
3. Match Group (MTCH) -- Earnings Review
Shar Dubey will step down as CEO after 16 years with the firm. She will stay on as a member of the Board of Directors. The company replaced Dubey with Bernard Kim, the President of Zynga.
a. Match Demand
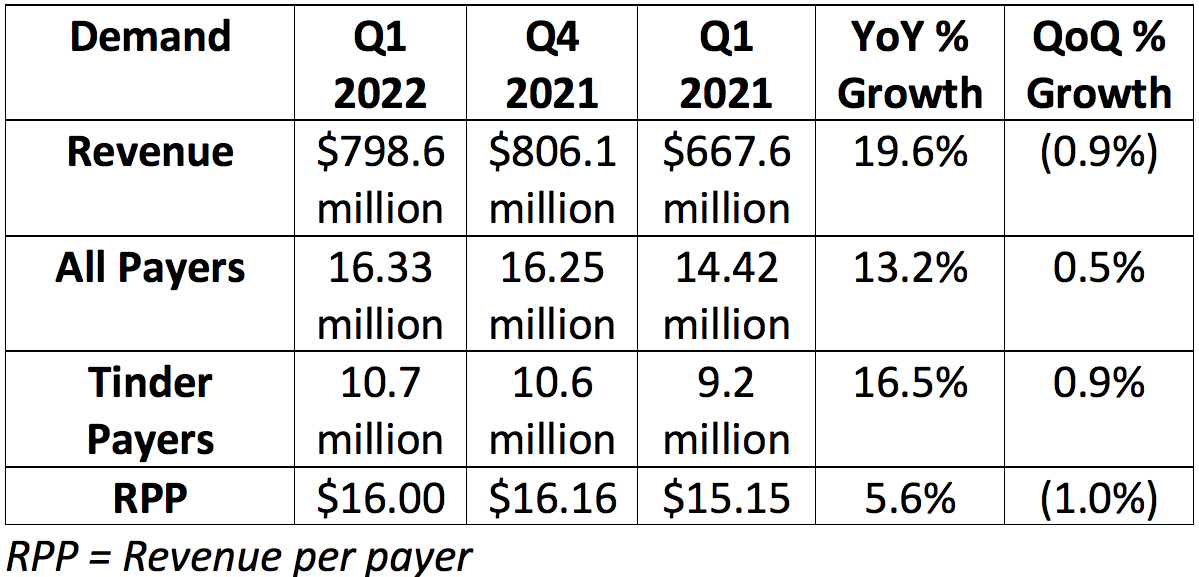
Match Group guided to a midpoint of $795 million in quarterly revenue with analysts expecting the same. A strong dollar led to $26 million in added FX headwinds -- it slightly beat expectations regardless.
More demand context:
RPP growth in Europe and APAC each suffered from a 7% FX headwind.
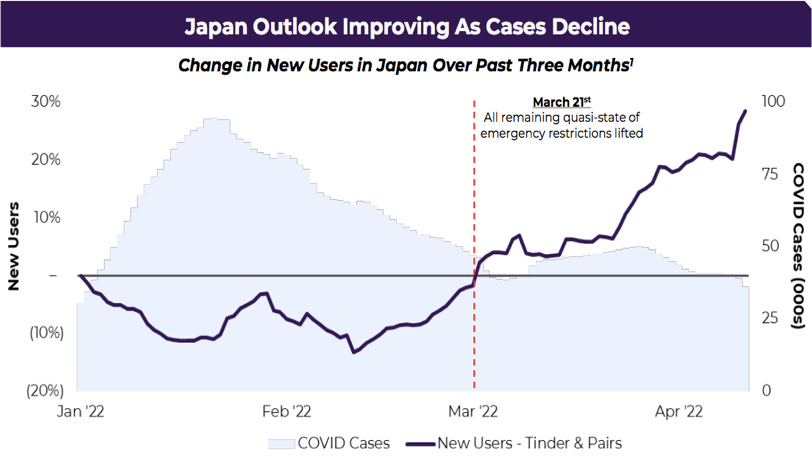
As depicted below, the pandemic did not have a tangibly positive impact on Match Group’s business like some seem to think. Yes, it did raise overall screen time, but it also greatly lowered propensity to spend on meeting that special someone in person.
It was a clear net negative and a fading away of Covid-19 would absolutely accelerate Match’s operations.
Match Group’s acquisition of Hyperconnect inorganically propped up 2021 growth rates by mid-single digit percentages.

b. Match Profitability
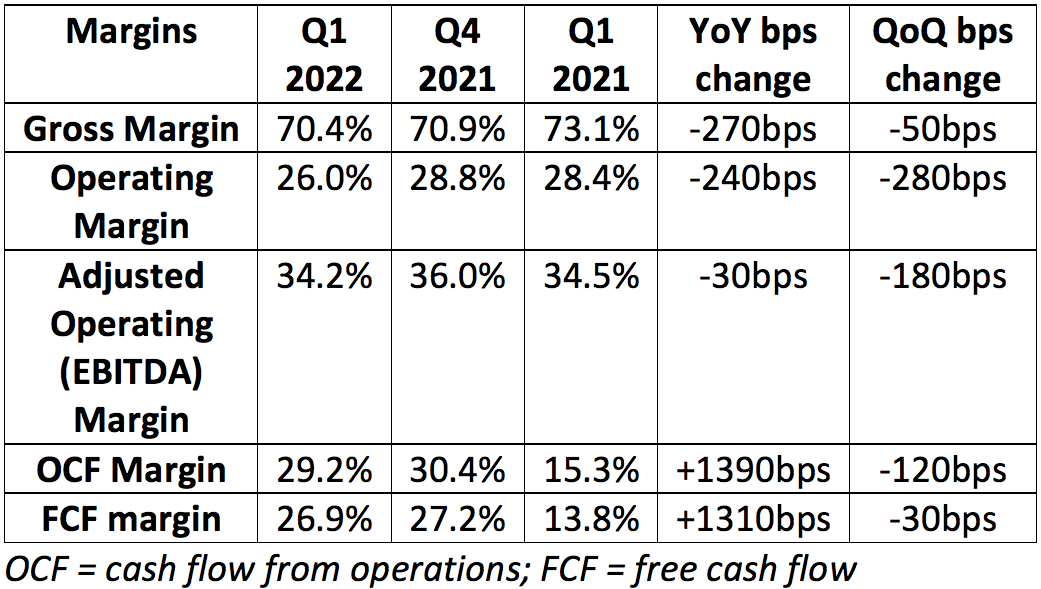
Match Group guided to $262.5 million in adjusted operating income (AKA adjusted EBITDA) with analysts expecting the same. Match posted $273 million, beating expectations by 4.0%.
Analysts were looking for $0.48 in earnings per share. Match posted $0.60, beating expectations by $0.12. This shrank YoY from $0.66 in EPS in Q1 2021 largely due to non-recurring legal charges that Match is working through.
More margin context:
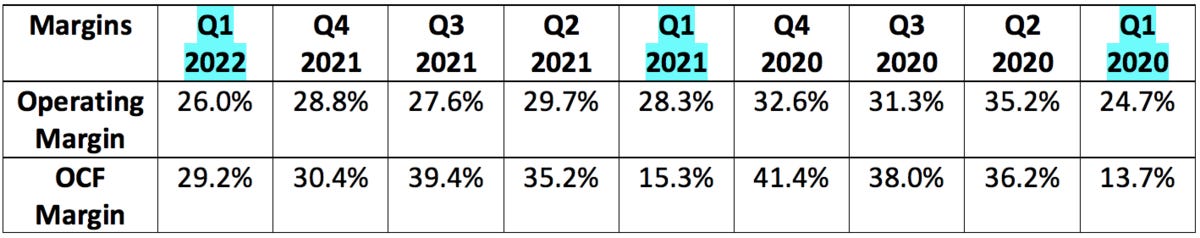
Cash flow margins got a YoY boost from a net benefit of $6.1 million in quarterly accounts receivable vs. a net negative of $75 million YoY.
With the same benefit last year, OCF margin would have been 27.4% and that margin line would have only expanded by 180 bps YoY.
Similarly, FCF margin would have been 25.9% and expanded by 100 bps YoY.
This is still a strong cash flow result, but it did get a boost from this line item which should be called out as it will be volatile on a quarterly basis.
Gross margin compression via Hyperconnect acquisition. The margin would’ve been 73.8% without it.
R&D was 10% of sales vs. 8% YoY as it re-allocated marketing dollars into R&D. This is the result of accelerating headcount growth at Tinder and Hinge.
Sales & marketing was 19% of sales vs. 22% YoY as it awaits macro trends improving to lean back into spend. CFO Gary Swidler referred to the marketing environment they play in as “frothy” during the call, which is forcing some caution with advertising.
“Match continued to be very disciplined with marketing spend given the pace of the recovery while continuing to invest in product and development for the long term. We’ve remained nimble on expenses throughout the portfolio, keeping dry powder for when macro conditions improve.” — Match Group Shareholder letter
c. Guidance
2022:
Match updated its previous 15-20% 2022 revenue growth guide to be “closer to the low end."
This includes a 4% FX growth headwind (largely incremental vs. the last quarterly guide) and a 1% war in Ukraine impact.
Match Group’s Gary Swidler reiterated the expectation to expand adjusted operating income margin by 50-100 basis points YoY and added Match “may even do a bit better than that with some spend discipline.”
Based on its 2021 margin performance of 35.8%, this implies a margin of 36.3%-36.8% for 2022.
This improvement includes a 2.0% margin hit from Hyperconnect AND a 1.5% anticipated margin hit from Google forcing usage of its payments service.
This guidance assumes we get back to pre-Omicron levels but not pre-pandemic levels.
Q2 2022:
Match Group guided to $800-$810 million in Q2 2022 sales for 13-14% growth. This missed analyst expectations of $835.7 million at the midpoint by 3.7%.
This includes a 5% revenue growth headwind (was expected to be in the 3% range) related to FX headwinds and another 1% impact via the war in Ukraine. The guide would have been $845 million on an FX neutral basis.
For some added context, 6 months ago Match was enjoying a neutral YoY FX exchange impact. Last quarter, currency exchange was a 2% hit to growth and this quarter that impact doubled to 4% with it expected to worsen before improving.
It also guided to $285-$290 million in adjusted operating income. This missed analyst expectations of $300.6 million by 4.4%.
CFO Gary Swidler added the following details:
It expects double digit YoY payer growth.
It expect single digit YoY RPP growth despite FX headwinds but 200,000 less payers QoQ due to removing age-based discounts on Tinder (no revenue impact).
d. Shareholder letter notes:
On the balance sheet:
$921 million in cash & equivalents + short-term investments.
$4 billion in long term debt.
Its $750 credit revolver remains fully untapped.
The Board authorized a 12.5 million share buy-back program.
On Tinder:
Tinder payer growth was slightly aided by a “slower than expected roll-out of an initiative to eliminate age-based discounts.” This will impact Tinder Payer growth more in the second quarter this year.
Tinder’s new background-check service called Garbo debuted to an “overwhelmingly positive response” during Q1 2022. This will roll-out to the rest of its brands throughout the year.”
On the product roadmap:
Match launched festival mode in tandem with Live Nation “ to enable members to connect before or during 20 of the biggest global festivals.”
Tinder Coins -- really its take on a loyalty program in my view -- is on track to launch this summer.
The virtual goods trading ecosystem it has planned will be powered by this coin. It will begin beta-testing it later this year.
Tinder is testing monetization packages catering to its female users.
This apps revenue skews more male than Match’s other apps and this is one of its initiatives to address that.
Hinge will launch in Germany in Q2 with a planned marketing campaign.
It will launch in a few more markets in 2022 including India where “strong organic traction pre-any localization efforts” is prompting the company to move up its launch plans.
On track with its video/audio chatting/streaming integrations across its product portfolio using Hyperconnect’s technology.
On the Google Play App Store and Regulation:
The EU’s Digital Markets Act was signed into law to “prevent tech giants from abusing their market position and to outlaw mandatory in-app payments (IAP) and other anti-competitive practices.”
There have been similar rulings is S. Korea, Netherlands, France, India with many close to joining them.
“It is now widely expected that the U.S. Congress will take up App Store legislation by the summer.”
On a Japanese Case Study:
Japan is Match Group’s 2nd largest market. The firm has seen stabilizing operating and financial performance since pandemic restrictions in Japan were lifted in mid-March.” Strong user and traffic growth prompted both Tinder and Pairs (its 2 popular apps there) to launch new marketing campaigns. It shared a fascinating chart on the wildly strong inverse correlation between new app downloads and Covid cases:
Other interesting notes:
Overall Match Group MAUs is now approaching 100 million vs. under 60 million at its IPO.
As a subscription business with frequent deactivations and reactivations, this is not the key metric to focus on for the firm. Still, growth here does give it more and more users to monetize with new products in digital currency and streaming.
Hinge is set to 10X revenue from 2019 to 2022 for a 115% CAGR over the period. This implies 2022 Hinge sales of at least $310 million.
Stir has debuted to a “stellar initial response.”
This is Match Group’s new app for the 20 million single parents in the United States.
Match believes that there are other underserved niche markets which it will gear near-future app launches towards this year.
Match actually called out a hurting ad market or economy as an opportunity to lean back into marketing more heavily due to better pricing and its recession-proof model.
People who use dating apps in the USA have on average 3.5 installed
Match’s mid-teens percent of MAUs being payers compares to some of its apps with hard paywalls at 40% and some with soft paywalls near 30%. There's a long runway.
Q2 is always Hyperconnect’s worst quarter due to the Ramadan holiday and its presence across the Middle East.
e. Conference Call Notes from Outgoing CEO Shar Dubey
On Online Dating During Recessions:
“If you look at Maslow’s hierarchy of human need, right below food, shelter and security is love and relationship… Our expectation is our business is generally resilient during economic downturns as it offers a service that is a very fundamental human need.” — Retiring Match Group CEO Shar Dubey
Dubey cited 2008 and early pandemic data where Match saw zero deterioration in engagement and virtually zero impact on propensity to pay. She credited this to Match’s products being affordable and one of the “latter things people cut when things are off."
On the Career Change:
“I feel privileged to be able to step down and have the time and flexibility to focus on the next chapter of my life, which I’m hoping will be the give back chapter… The opportunity before the company is immense… and I will stay on the Board, continue as an advisor and be able to focus on the areas of the business that I love: product, strategy and solving customer problems.” — Retiring Match Group CEO Shar Dubey
“During the IAC separation, it made sense for me to step in, provide continuity and help guide the company through that process. I told the board then that I couldn’t commit to being a long-term CEO because of where I was in my life and the things I wanted to do. I took over and then the pandemic hit and once we were out of the thick of the crisis, while the board hoped I would stay, they were prepared to work through the succession and ran a robust process.” — Retiring Match Group CEO Shar Dubey
On the new CEO -- Bernard Kim:
Dubey praised Kim for his orchestration of a Zynga turnaround.
She pointed out how Zynga’s multiple brands at different stages of growth, digital entertainment purpose and successful M&A integration made Kim perfect for this specific job.
Kim has served as:
President of Zynga for 6 years (Very high Glassdoor ratings for the team).
SVP of Mobile Publishing at Electronic Arts.
Director of Sales and Channel Strategy at Walt Disney.
f. Notes from CFO Gary Swidler:
On legacy brand payers:
“Some of our more established brands in the Americas weighed on overall payer growth. It was a challenge to find marketing opportunities that met our ROI thresholds.” — CFO Gary Swidler
Match.com saw payer pressure from testing a “softer paywall model in Q1 which is a short-term headwind and should be long term beneficial as the new model is refined."
On Google:
“We’ve had user choice on our brands for a long time which is how we maintain customer relationships. Our customers often choose our payment systems at 3X the rate over Google. Google is forcing usage of its payments because they see a very short window as the wave of regulatory change is happening… Despite all of the recent regulatory action, they’re still deciding to go ahead and require us to eliminate user choice which we’ve had for many, many years.” — CFO Gary Swidler
On buybacks:
Swidler reminded shareholders that Match Group suspended buybacks at the time of its IAC spin-off to get to its net leverage target of 3X. Now that it’s under that it “clearly makes sense to once again authorize a buyback… it’s fair to assume that Match sees what’s happening with the stock and will find opportunities to go back in and buy some shares.”
Proxy statement highlights:
Vanguard owns 10% of the firm vs. 8.4% YoY.
T. Rowe Price owns 5.0% of the company vs. 12.9% YoY.
BlackRock owns 8.3% of the company vs. 5.8% YoY.
Edgewood Management is now a 5%+ stakeholder and Prudential is now not.
Executives own 1.1% of the company outright vs. 1.3% YoY.
g. My Take
The headline results and guide from Match weren’t impressive -- but that wasn’t for reasons that concern me. This was not a market share or value proposition related issue, it was merely lingering pandemic effects paired with a historically aggressive strengthening of the dollar. Was this amazing? No. Was it alarming? Not in the least. I added to my stake during the week.
4. Revolve Group (RVLV) -- Earnings Review
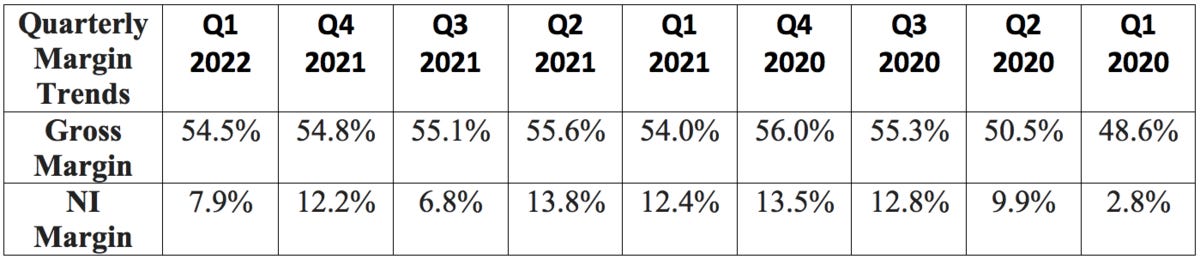
“These results and our consistent profitable growth reflect outstanding performance across the REVOLVE and FWRD segments, underscoring our team’s ability to execute and navigate through a very challenging macro environment.” — Co-Founder/Co-CEO Mike Karanikolas
a. Revolve Demand
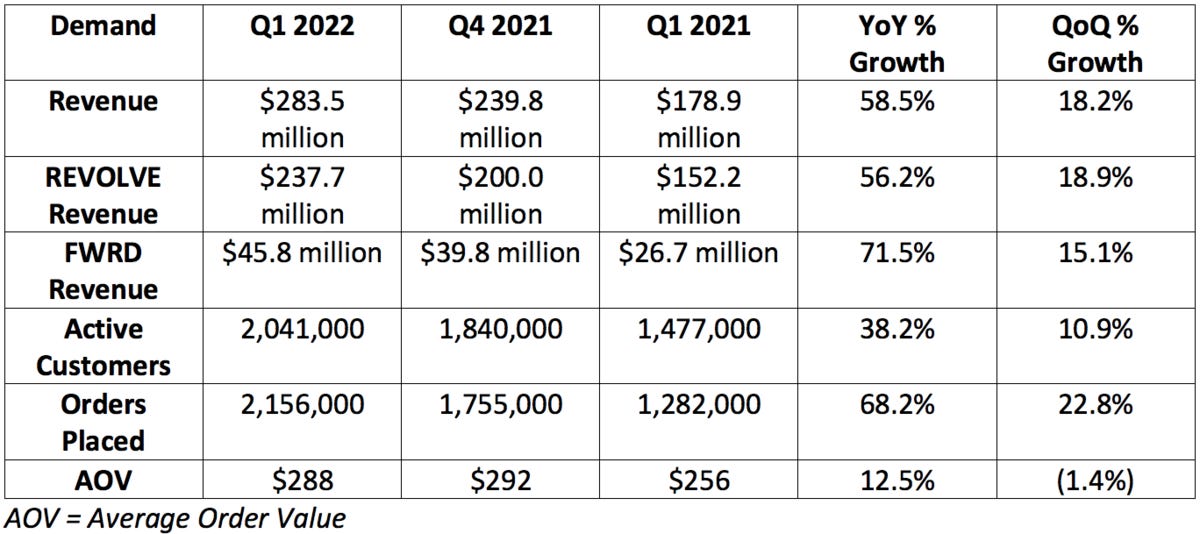
Analysts were looking for $256.8 million in sales for the quarter. Revolve posted $283.5 million, beating expectations by 10.4%.
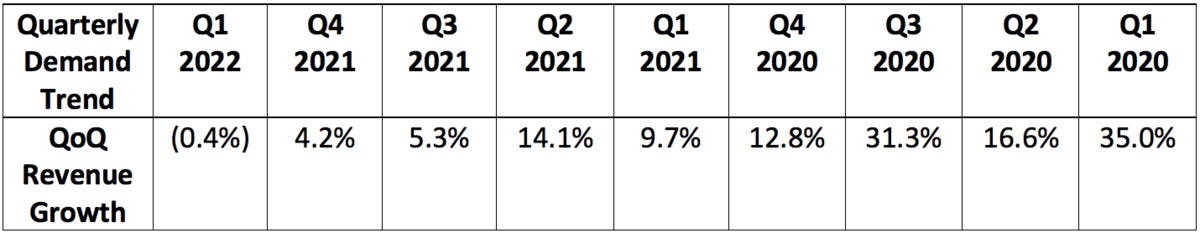
As this is not a SaaS/recurring revenue business, it makes the most sense to compare growth rates to the same quarter from previous years:
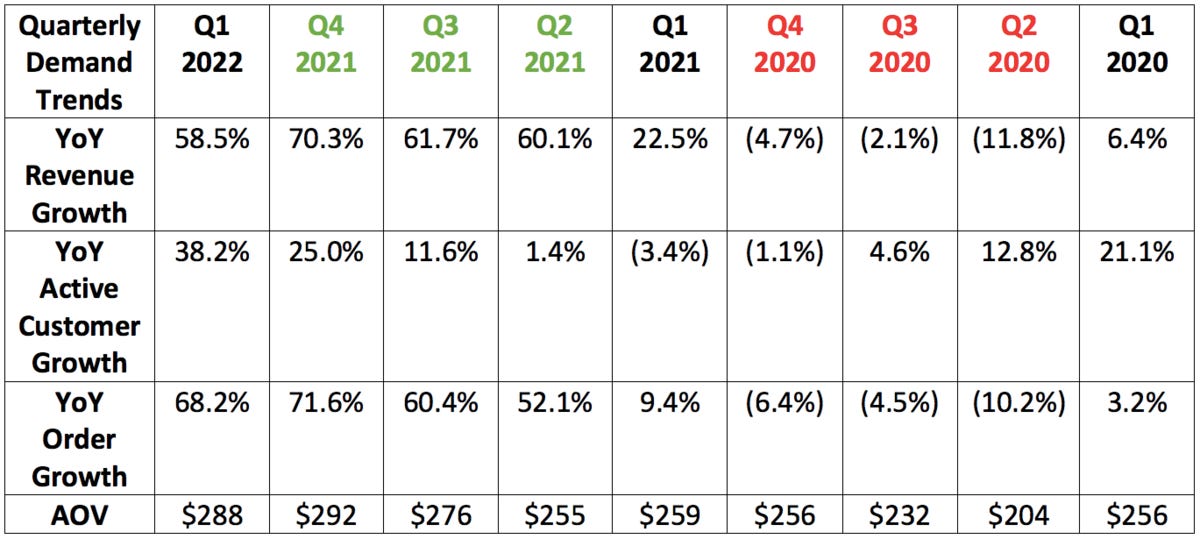
The pandemic was a severe headwind for this e-commerce company as it mainly sells apparel and accessories to go out, go to work, or to “look and feel your best.” That was not at all coveted during a period of lockdowns and social distancing. The company also allocates most of its marketing spend to live events which were halted. The most adversely impacted quarters are highlighted in red while the quarters benefiting from the easiest comps are highlighted in green. It’s interesting to think about an e-commerce company as a beneficiary of the pandemic ending, but it is.
“Just 2 quarters ago, I was thrilled that we added 100,000 active customers for the first time. Now we’ve doubled that amount.” — Co-Founder/Co-CEO Mike Karanikolas
b. Revolve Profitability
Analysts were looking for:
$29.1 million in EBITDA. Revolve posted $31.5 million, beating expectations by 8.2%.
$26.7 million in EBIT. Revolve posted $28.9 million, beating expectations by 8.2%.
$0.27 in EPS. Revolve posted $0.31, beating expectations by $0.04.
More margin context:
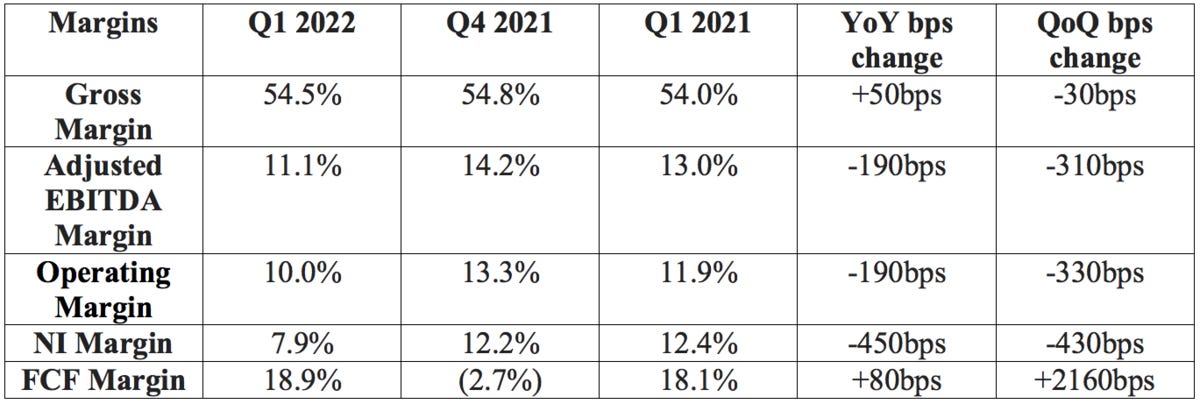
Revolve had also guided to a gross margin of 53.75% for the quarter. It posted a 54.5% margin, beating expectations by 75bps. This was its lowest Q4 to Q1 gross margin sequential decline ever.
Net income, operating and EBITDA margins are comping vs. a period in which Revolve was greatly pulling back on operational spend. It has since re-ramped spend to capture normalizing demand which is weighing on YoY margin comps.
You’ll notice below that net income margin expanded 510bps vs. the Q1 2020 period.
Net income was also hit by Revolve’s tax rate of 22% for the period vs. (6%) last period. EPS would have been $0.41 per share (37% growth) with a constant tax rate.
Fun facts:
Free cash flow has compounded at a rate of nearly 70% since 2019.
Adjusted EBITDA has compounded at a 55% clip since 2019.
This success compares to 28% revenue growth compounding since 2019 -- pointing to immense operating leverage.
C. Press Release Highlights
On quarterly results:
Revolve broke its record for customer adds for the 3rd straight quarter. It also enjoyed record customer engagement and cash flow.
It delivered 66% domestic sales growth vs. 28% internationally as the pandemic lingers abroad.
The brand ambassador program delivered 80% sequential traffic growth.
“As founders, we’ve been focused on profitable growth from day one and this quarter was no exception, continuing our long track record of delivering a unique combination of growth and profitability… Our results for the past several quarters demonstrate that we are gaining meaningful market share.” — Co-Founder/Co-CEO Mike Karanikolas
On the (pristine) balance sheet:
$270.6 million in cash on the balance sheet up 48% YoY.
No debt.
Inventory levels grew 78% YoY and 5% QoQ.
Share count grew 1% YoY.
On recent results:
April 2022 sales growth remained above 30% YoY even as comps normalize. Revolve continues to vastly outperform its long term growth target of 20% YoY.
The second quarter (as expected) will be its largest quarter by revenue as people gear up for more live events during hot summer months. Growth rates will moderate steadily back to the long term trend line throughout the year.
“While we are mindful of macro, geopolitical and other global uncertainties, we are confident in our competitive advantages, demonstrated ability and talented data-driven team to help us continue to navigate and capitalize on the opportunities in front of us.” — CFO Jesse Timmermans
On things to pick at (all very minor):
Return rate rose back above 50% (as expected) as dresses revert back to a larger percentage of its total sales and boast the company’s highest return rate by category.
This is why the company discloses net (not gross) revenue.
Also, Revolve’s philosophy of free shipping and returns is designed to promote buyer confidence online. This is not a red flag. Evidence for this is that dresses grew 150% YoY.
Fulfillment was a 2.6% drag on operating margin vs. 2.4% YoY (blamed on input cost pressure and higher rates of returns as product mix normalized).
Selling and distribution was a 16.4% profit drag vs. 14% YoY (blamed on higher return rates YoY due to normalizing product mix and then higher shipping rates as well).
d. Call Notes from Co-CEO/Co-Founder Mike Karanikolas
On the roadmap:
Localization efforts -- like they did in Canada -- are paying off with outperforming growth in the U.K.
On track to begin operating its first East Coast warehouse in the second half of the year to speed fulfillment.
Revolve is working on plus sized brands to become more inclusive.
On Revolve and FWRD’s overlap:
Revolve is still less than one year in to launching the FWRD loyalty program that encourages cross-shopping. This cross shopping is still done by less than 5% of active Revolve customers. "Every additional 1% overlap between REVOLVE and RWRD active customers could drive over $10 million in incremental net sales.” Cross-shopping rates continue to rise every single month.
e. Notes from CFO Jesse Timmermans:
Quick Notes:
Owned brands rose again as a percent of overall sales.
Expect Q2 2022 gross margin of 55.0%-55.5%.
Expects to exceed 20% growth, comfortably.
Markdowns were “slightly” deeper during the quarter.
Revolve raised 3rd party prices about mid-single-digit percentages as pass-through costs with similar increases in owned brands.
On 2022 -- Timmermans expects:
GPM to be flat or slightly down vs. record 55.0% in 2021. Its long term target is 55.0%.
Fulfillment cost = to 2.5% of net sales for 2022 (reiterated).
Selling and distribution costs = to 16% of 2022 sales (reiterated).
G&A at the high end of its guide (or $110 million) previously provided due to aggressive investments to support growth and expansion.
Tax rate of 24-26%.
f. My Take
This was a great quarter for Revolve. There’s very little to pick at and I added to my stake after the sell-off this week. Few teams can execute as consistently well as this one does.
5. Green Thumb Industries (GTBIF) -- Earnings Review
a. Green Thumb Demand
Analysts were looking for $238 million in sales for the quarter. Green Thumb posted $242.6 million, beating expectations by 1.9%.
b. Green Thumb Profitability
Analysts were looking for $74 million in adjusted EBITDA. Green Thumb posted $67 million, missing expectations by 9.4%. Interestingly, non-adjusted EBITDA was $77.5 million for the company during the quarter as adjusted EBITDA excluded a $15.2 million hit from other non-operating income and a $4.7 million benefit from stock comp.
Green Thumb's $0.12 in EPS doubled analyst expectations of $0.06.
Green Thumb’s long term gross and EBITDA margin targets are 50% and 30% respectively -- these were reiterated during the call.
c. Notes from CEO Ben Kovler
Investor material notes:
SG&A as a percent of revenue was 28% vs. 31% YoY.
The decrease in EBITDA reflected inflation on raw material inputs and aggressive hiring to prepare for future demand.
Same store sales fell 3% YoY and 6% QoQ.
Adult use sales in Rhode Island (number 2 state by population density) will begin as early as October.
New Jersey adult use is projected to be a $2 billion market on its own in the coming years.
New Jersey's debut yielded results that were “eerily similar to Illinois” and that success story according to CFO Anthony Georgiadis.
Edible sales will begin in Minnesota later in 2022.
Pennsylvania still is yet to debut medical pre-rolls.
Balance sheet:
$174.5 million in cash and equivalents & $244.2 million in debt.
235.8 million and 238.2 million basic and diluted shares outstanding.
On how leadership is comfortable with the 50% GPM target:
“There are gross margin levels we can pull. One is if needed, we can sell more of our own products at our own stores… we made that decision in Q1 in a couple of markets. The other thing is scale we expect to achieve in a lot of our wholesale facilities not anywhere close to true capacity. We look at the CPG category overall, and we’re confident that based off of the unit economics we’re seeing -- even in markets out West -- we’re confident in 50%. across the business.” — Founder/CEO Ben Kovler
The shareholder letter highlight:
Ben Kovler released his annual shareholder letter during the week. The highlight from it was an illustration of how 280E impacts cannabis companies. As a reminder, 280E is a federal tax provision preventing sellers of federally illegal goods from deducting ordinary business expenses from their tax bills. This has a more than 6% impact on net income margin:

d. Notes from CFO Anthony Georgiadis:
On the macro-environment:
Gross margin compression is being driven by Pennsylvania and a couple other key states. April was stronger here than Q1. This prompted Georgiadis to guide to at least flat sequential sales.
Some states are offering pricing stability but others continue to have irrational actors trying to buy short term market share.
e. Proxy Statement highlights
Ben Kovler owns 37.7% of the company’s voting stock vs. 38.9 YoY.
Anthony Georgiadis own 9.44% of the company’s voting stock vs. 9.35% YoY.
All directors and executives own 47.9% of the company’s voting stock vs. 48.1% YoY.
f. My Take
This quarter was both underwhelming and better than I expected. The cannabis industry will remain challenged until later in the year and Green Thumb is primed to take full advantage as states flip and growth resumes.
6. Shopify (SHOP) -- Earnings Review
NOTE THIS IS NOT A HOLDING (on watch list).
I’m busy at work putting together my PayPal Deep Dive and getting through earnings season -- but the brief Shopify bull thesis is still on my list and I’m still planning on covering the name going forward. So without further ado...
a. Shopify Demand
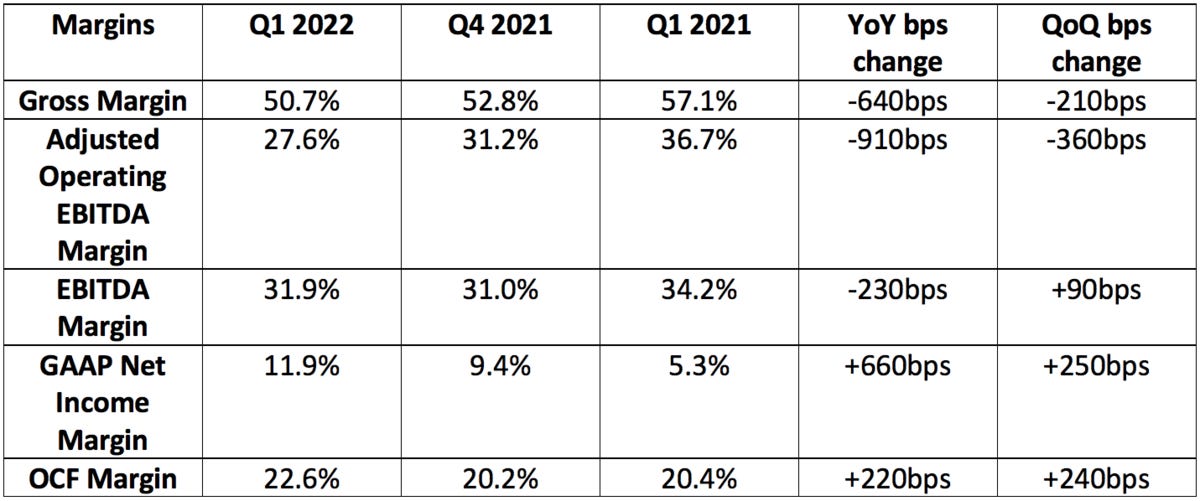
Analysts were hoping for $1.24 billion in sales for the quarter. Shopify posted $1.20 billion, missing expectations by 3.2%
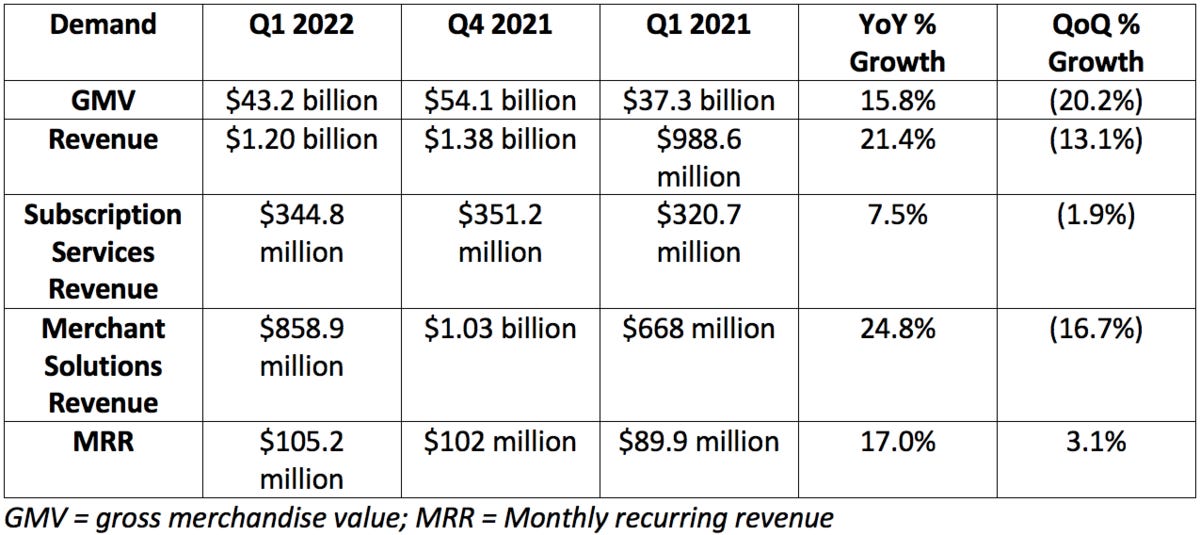
More demand context:
Shopify’s decision to forgo fees on its developers' first million in annual sales and also theme earnings is greatly contributing to this slow subscription service revenue.
Shopify’s developer and app ecosystem that empowers granular customization is key to attracting merchants. Motivating developers to build more tools into the Shopify ecosystem is a great way to support this mission.
This quarter was perhaps the toughest YoY growth comp in the history of Shopify’s operations. For reference, its 2 year revenue CAGR sits at an elite 60% with a 57% GMV CAGR during that time.
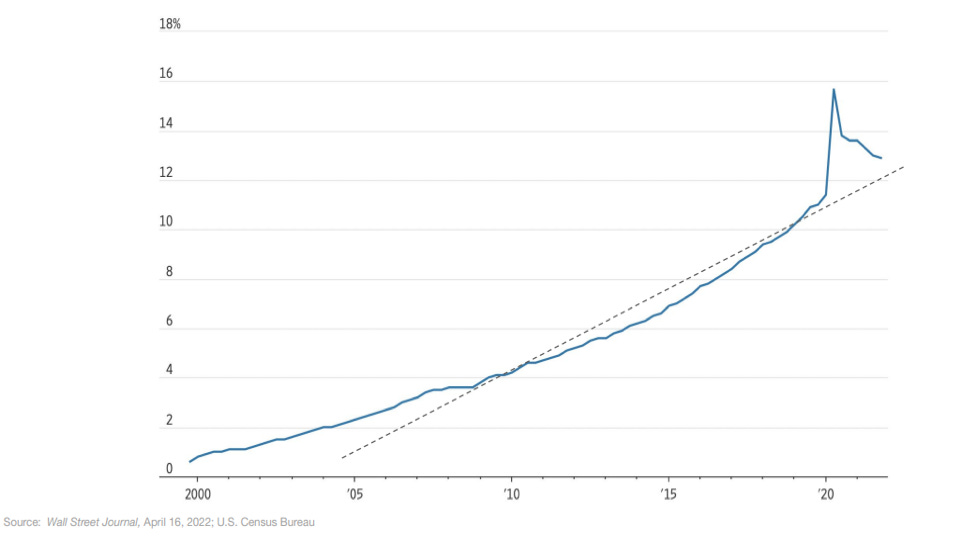
I usually only go 2 years back for quarterly trends, but I wanted to highlight where Shopify was before the pandemic struck to depict how overwhelming of an operational tailwind it got from the event:
The 3-5 year e-commerce pull forward from the pandemic will challenge growth here until later in the year and into 2023. This is clearly depicted in the image Shopify provided of e-commerce as a % of retail sales below:
b. Shopify Profitability
Analysts were looking for:
$117.6M in EBITDA for the quarter, Shopify posted $31.9 million in adjusted operating income (the proxy), sharply missing expectations.
$0.65 in earnings per share (EPS). Shopify posted $0.20, sharply missing expectations.

More margin context:
Shopify’s GAAP net income margin was (125%) vs. 127.3% YoY and (26.9%) QoQ. This wild volatility is not unit economics related in the least -- it is entirely related to unrealized fluctuations in the value of its equity investments. This is not an important profit metric to track for the company -- so I left it out of the table.
Gross margin pressure is via:
Merchant solutions revenue growing far in excess of its higher-margin subscription services revenue. This is expected to continue in 2022.
Shopify’s removal of developer fees on their first million in annual sales is weighing on gross margin YoY.
Shopify payment mix shifting back to higher cost credit funding sources post stimulus. The same thing happened to PayPal.
c. Investor Materials Notes
On Deliverr -- Shopify’s new $2.1 billion acquisition (80% cash; 20% stock):
Deliverr was purchased to bolster the warehouse software, fulfillment capabilities and 3rd party relationships of Shopify’s newer “Shopify Fulfillment Network” (SFN) segment. Deliverr’s fulfillment platform “provides simplicity and scale to millions of merchants” while conjoining several disparate pieces of the supply chain to enable them to work and communicate in a more effective, cohesive manner. It offers this simplicity in a broadly usable way via integration with essentially all relevant sales channels, including Walmart, Amazon and all social channels.
Deliverr aims to solve supply chain congestion -- which is especially relevant today -- by “moving inventory closer to the end customer.” It leverages its “cutting-edge” ML (like many claim to do) to build more data-driven fulfillment and to gain a more holistic view of forecasting where inventory will need to be. It then leverages this data to place goods in fulfillment centers ahead of orders. This also means that merchants don’t need to stock pile inventory in a guess and hope method but can do so based on sophisticated demand modeling. Its platform guides what is sent where and also which delivery method to use to maximize profit. It’s a very valuable concept if done effectively and a very costly one if not. To put it plainly, this is expected to uplift SFN and its shipping across the board.
Deliverr does not own its warehouse space but instead leases it out to stay true to Shopify’s asset light ambitions. This is a software company at its core. With the purchase, Shopify not only gets new tools to add to the software it has been working on since 2020, but gains Deliverr’s talented team of engineers. It will add Deliverr’s capabilities to its 6 Rivers warehouse software (another purchase it made), Shopify Shipping and SFN to vastly enhance the value it provides to its army of sellers.
This is an expensive acquisition considering how early on Deliverr is in its life cycle. Still, I find it to be a much-needed shot in the arm for Shopify competing in the wildly competitive fulfillment space like it aims to do.
Deliverr’s latest funding round came in November from Tiger Global at a $2.0 billion valuation. With the funding, the firm’s CEO -- Harish Abbott -- said they’d focus on next-day fulfillment, meaning the 2-day fulfillment it currently offers will hopefully improve to mirror Amazon over time. Deliverr does not surcharge for this expedited shipping. The founders have backgrounds as senior product managers for Amazon and Twilio.
In other related SFN news, Shopify debuted its “Shop Promise" during the quarter. This is a badge allowing merchants to approximate delivery dates and make 1-2 day guarantees across any Shopify-supported channel. Deliverr will be a big part of scaling this.
Fears have grown over Amazon extending its Prime shipping and fulfillment to 3rd party sites. Many assumed this news would be terrible for Shopify. Lutke addressed that during the call:
“We are actually thrilled with Amazon making a decision to take the amazing, second-to-none infrastructure they’ve built to share this broadly with small merchants. We are happy to integrate this into Shopify just like we integrated what Meta built and Google and TikTok built. This is not nearly as zero-sum as some make it out to be… the more channels that exist to sell, the more important Shopify tools become... This is good news from our perspective.” — Co-Founder/Co-CEO Tobias Lutke
Finally, Shopify added the following details on Deliverr and SFN during the call:
Its 6 Rivers Warehouse software will be handing all company orders by end of this quarter.
Deliverr will free Shopify to re-vamp its returns process to make it easier and more affordable.
More Notes:
Shopify Plus (the premium-tier subscription) is 30% of MRR vs. 26% YoY as customers continue to upgrade.
Its cross border product -- partnered with GlobalE -- is now live in all of its markets with “tens of thousands of merchants” adding the localized shopping service.
Point of Sale GMV rose 80% YoY as brick and mortar makes a comeback.
Shopify’s online commerce and POS growth continues to well-outpace its categories -- pointing to more market share gains. E-commerce category growth was 10% meaning Shopify did better than this.
Shopify’s “Shop” users (its personal shopping assistant for consumers) yield 17% higher spend vs. non-users.
It took BNPL market share in the U.S QoQ.
In app-commerce via Facebook and Instagram is up 4X YoY.
Launched Shopify Shipping in France.
March 2022 was the strongest selling month for Shopify Plus in its history.
Joe’s Stone Crab, Crayola, Call of Duty, Mr. Beast and the NBA all added Shopify Plus during the quarter.
IDFA has no negative impact on Shopify and may even help them as it pushes sellers to on-site monetization.
Merchant churn is stable.
d. Guidance
Shopify doesn’t offer formal guidance, but does continue to expect to invest all gross profit dollars back into company growth. This strategy is both wildly out of favor at the moment, and something that I -- as a non-shareholder interested in potentially investing -- support. Shopify’s opportunity is nothing short of massive with most SMBs still not having any form of online presence. It should be spending to enhance its utility and to stand out in a field with dozens of other large, deep-pocketed competitors. I think -- regardless of Mr. Market hating this approach at the moment -- that maximizing market share over net income is a correct move today. The stock says otherwise which is part of the reason why I’ve become so interested lately.
It also expects stock-based compensation to be a hefty $800 million (partially related to the Deliverr purchase) vs. $200 million in capital expenditures.
Other notes:
Shopify now expects the number of merchants joining its platform in 2022 to be “similar” to 2021 vs. previous guidance of “slightly ahead” of 2021 adds.
This was blamed on a tight labor market that CFO Amy Shapero said is already resolving itself.
Merchant solutions growth will double subscription solutions (so again, GPM will fall).
Deliverr will generate a negative operating income contribution but a few percent boost to Shopify’s 2022 sales growth.
e. Call Notes from President Harley Finkelstein
On supporting the merchant:
“Throughout the last 2 years, we showed up for our merchants and now the trust we built is being rewarded. This momentum encourages us to keep investing for the long term.” — President Harley Finkelstein
Finkelstein spoke at lengths on Shopify’s unique ability to onboard small merchants with affordable ($79/month plans) and continue layering in more and more utility as those merchants grow. As its merchants do better, Shopify does better.
It’s now pivoting more sales and marketing resources to lower-margin, in-store POS to take advantage of the shift in overall commerce trends back to brick in mortar as the pandemic ebbs.
On new relationships:
Deloitte and Accenture are now partnered with Shopify on “systems integrations to help some of their largest clients achieve and maintain agility."
Mr. Beast launched a chocolate brand on Shopify and the Chicago Bulls launched an NFT store through Shopify.
f. My Take
This was never going to be a standout quarter for Shopify or any other players in the e-commerce space. The company is dealing with the hangover effects from the pandemic-induced e-commerce demand pull forward and that will continue for the bulk of the year. Add to that the new concerns about Amazon expanding its fulfillment service to 3rd party merchant sites and the company's determination to invest all gross profit dollars into growth -- amid a tightening, profit-hungry market -- and we get where we are today. With all that said, I don't see any of these factors as red flags or deal-breakers.
Two things are true for me here. One, I don't think I need to be in any hurry to start a position amid our currently hectic macroeconomic environment for both stocks and also e-commerce specifically. Two, I think this is a special company and I do ideally want to own it at some point in the future. I see the likelihood of me becoming a shareholder later in the year as somewhat high, but we'll see how markets play out. I am more interested in owning it today than I was before the report.
7. Upstart (UPST) -- Salesforce, Credit Union and Consumer Credit
a) Salesforce
Upstart announced a new integration with the Salesforce AppExchange to bring modern lending and customer service to financial institutions. Now, member banks and credit unions are free to use Upstart’s underwriting model in person, on the phone, online or with a simple scan of a QR code -- all powered by Salesforce’s financial services cloud. According to the release, this integration will allow financial institutions to “bridge the worlds of traditional brick and mortar banking and digital AI-enabled lending.” This will enable the automated pre-filling of already obtained data -- pulled from Salesforce’s servers -- to lower steps to funding and to raise conversion. Upstart does not have a heavy brick and mortar presence and this will surely help.
“Upstart is a welcome addition to AppExchange as they accelerate digital transformation and AI-powered lending for FIs.” — GM of AppExchange Woodson Martin
Salesforce’s “Customer 360” will bolster the visibility Upstart and its partners have into each customer. Personnel performance tracking is also handled to automate commission payouts. Salesforce calls several large cap banks clients, and this serves as another point of validation with a cloud-computing pioneer to encourage more adoption. This integration will start at $10,000 per firm per year.
b) New Credit Union and a Quick Data Point
Upstart added Firstmark Credit Union to its budding referral network. The two had been working together for 6 months and are now ready to take the next, deeper step in their relationship. Firstmark isn’t massive, but isn’t tiny either with 100,000 members and over $1 billion in Assets Under Management (AUM).
This will help build Upstart's referral revenue base (which is its largest piece of business) but also gives the company another partner to retain more of its sourced loans going forward.
Consumer credit in the month of March spiked by 14% YoY based on $52.4 billion growth. This more than doubled expectations and points to healthy demand for Upstart’s offering.
8. CrowdStrike (CRWD) -- Two Case Studies:
Global Raw Materials powerhouse Lasselsberger group results:
“Significantly reduced administrative workload” with maintenance time cut from one day per week to one hour.
Higher behavior-based threat detection rate thanks to signature-less technology.
“Greatly reduced” antivirus exceptions.
“Before CrowdStrike, we did not feel that we were sufficiently protected... CrowdStrike offers the best support we have ever had with any product.” — Lasselsberger Head of IT Mario Hinterndorfer
Indian Credit Rating Agency CARE Rating results:
Minimized manual oversight needed and network overhead headache.
Enhanced ease of use.
“There’s no doubt that CrowdStrike is the global standard.” — CARE Head of IT Manoj Thakur
9. The Trade Desk (TTD) -- Open Path
Open Path -- The Trade Desk’s most overlapping supply side product release to date -- signed some key publishers this week including:
LA Times
Forbes
Buzzfeed
The company can say it isn't trying to compete with the supply side all it wants to. While it still isn't performing core supply side tasks like yield management, this hints at that not being entirely the case.
10. Meta Platforms (FB) -- Hiring
Zuckerberg sent a company-wide email telling employees that Meta would slow hiring for the rest of the year. He cited “making focused, balanced investments to support our most strategic priorities” as the reason. The industry-wide downturn in e-commerce growth due to the pandemic pull forward is forcing the team to “make some tough decisions about what projects we go after to achieve our lower expense guidance that we committed to." The company has “hired at an aggressive pace” year to date with more engineer additions in Q1 2022 than all of 2021. It’s also reviewing and could possible re-allocate employees to other teams.
In a world where investors care about cost management far more than 12 months ago, this is one of many levers that Meta has to pull to massage margins. With its fortress balance sheet and unit economics, it can spend and save at the same time.
11. SoFi Technologies (SOFI) -- Mastercard
SoFi’s Galileo and Mastercard have signed a multi-year agreement to partner in the rapidly growing Latin American financial technology market. Together, the two will combine go-to-market strategies to accelerate adoption and will distribute Mastercard products to consumers. As part of the news, Galileo was also added to Mastercard Engage -- its preferred partner network. Galileo gains access to the “more than 2,000 innovators” Mastercard serves in the region through its Developers portfolio. A credit card rail like Mastercard and a payment processor API vendor like Galileo fit hand in glove and it’s nice to see that Mastercard seemingly agrees.
12. Duolingo (DUOL) -- New Endeavor
Duolingo is opening a taco restaurant with discounts offered to all customers passing a language challenge. To be candid, this seems like a distraction from core operations to me, but elite execution since the firm’s IPO leads me to give the team the benefit of the doubt here.
13. Quick Note on Macro
The Federal Reserve reiterated its plans for aggressive balance sheet reduction and more rate hikes this past Wednesday. Interestingly, Chairman Powell explicitly said that The Fed was “not actively considering” 75 bps (0.75%) federal funds rate hikes. This marks a slightly less aggressive rate hike path than some notable institutions feared and was well-received. Also this week, other Fed officials hinted at considering 75 bps hikes which spooked investors. In reality, a main tool of the Federal Reserve is guiding monetary policy expectations. It talks a big game but rarely does exactly what it says it will. The intimidating 75 bps commentary is likely just sympathizing with public concerns on a historically elevated consumer price index (CPI) over 8%. The messaging functions as a way for the Fed to impact the yield curve without actually changing policy. Powell ruling out the 75 bps hike is what to focus on.
With that being said, fundamental performance is what I’ll focus on even more. I will own companies showing clear signs of sustainably brisk cash flow and revenue compounding at reasonable prices in any environment. Micro exclusively guides my stock picking. But still, Macro is a core, intimate piece of my trimming/accumulation and cash management. With how daunting the macroeconomic landscape is at the moment, I’m comfortable with keeping the cash position quite elevated at nearly 20.0% of holdings. Monetary cycles will again shift from hawkish to dovish; I want to have firepower to opportunistically add when that happens, and while hawkish commentary continues to create better and better deals in the meantime.
14. My Activity
I added to Revolve Group, Green Thumb and Progyny during the week. My cash position sits at roughly 19.8% of holdings.