

Discover more from Stock Market Nerd
Hey readers! Please share this article with your network if you feel inspired to do so. That is how we grow and keep the content 100% free.
1. Demand
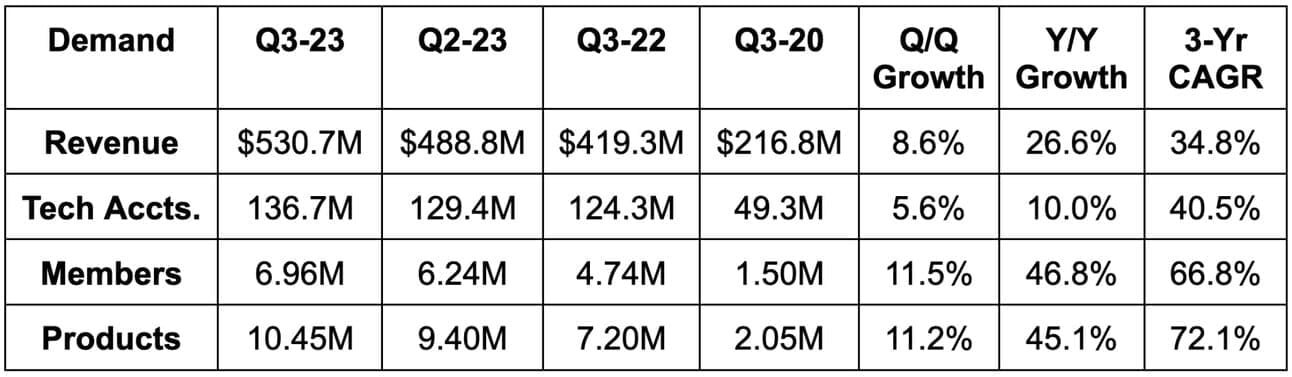
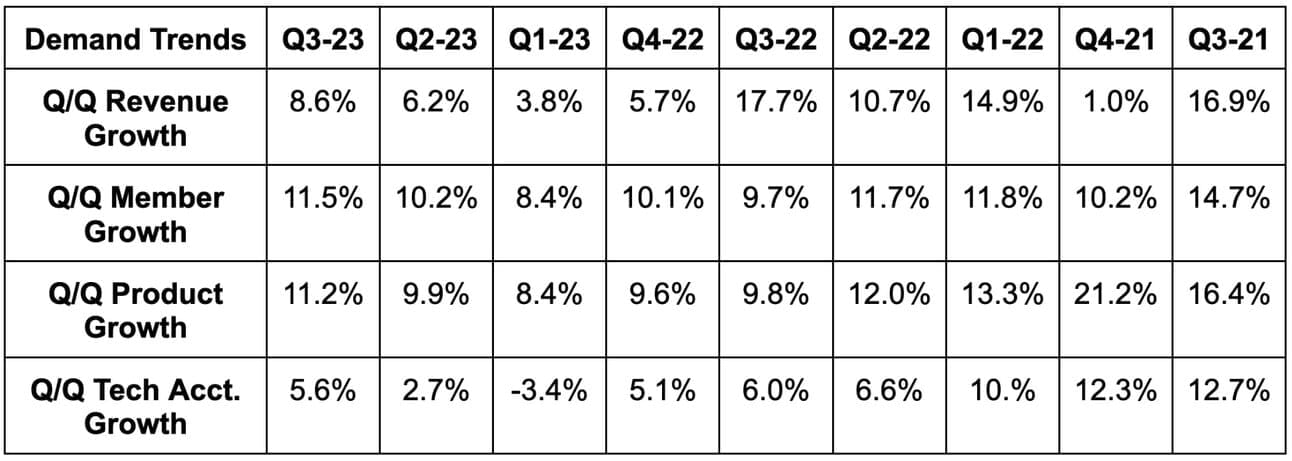
SoFi beat revenue estimates by 2.9%. It added $2.9 billion in deposits vs. its guidance of “more than $2 billion.” Its 34.8% 3-yr revenue compounded annual growth rate (CAGR) compares to 53.1% Q/Q & 74.8% 2 quarters ago.
This was a record quarter for sequential product additions and among its strongest ever for member additions. Both product and member Y/Y growth accelerated for the first time in a while. Products per member stayed at 1.5x despite rapid new member growth.
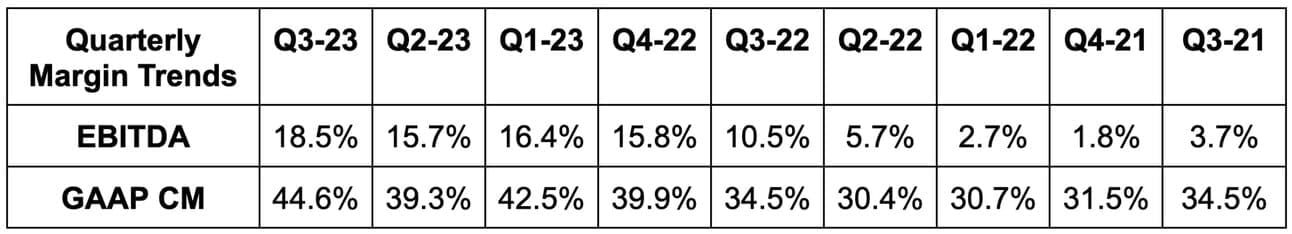
2. Margins
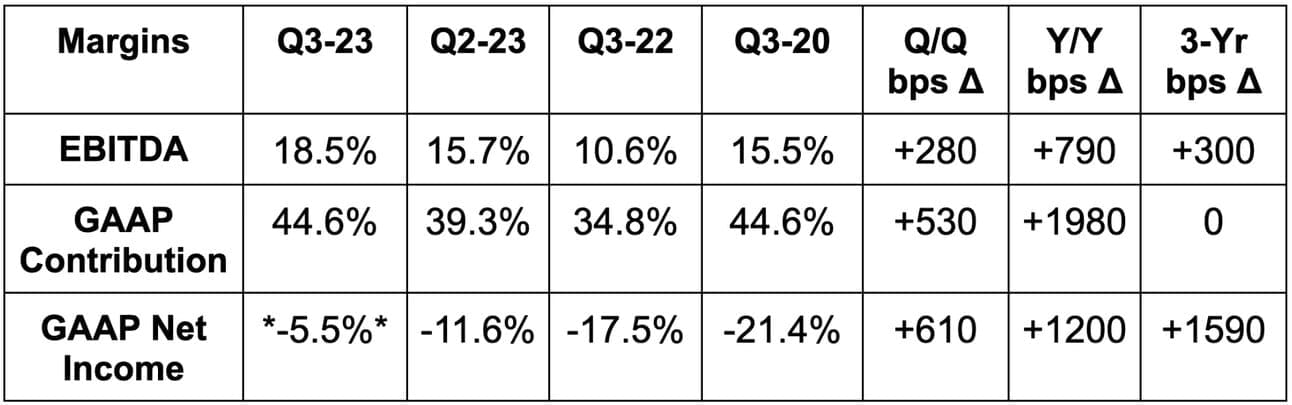
SoFi beat EBITDA estimates by 54%. It actually missed -$0.08 GAAP earnings per share (EPS) estimates by $0.21. This was solely driven by a nearly $250 million impairment charge. The source of the charge wasn’t specified on the call, but it’s likely from acquiring Technisys. Without the non-recurring, non-cash impairment charge, SoFi would have beaten EPS estimates by $0.05.
3. Guidance
For the full year, SoFi raised its revenue guidance by 2.5% and beat estimates by 1.4%. This guidance includes material “conservatism” associated with things like net interest margin (NIM).
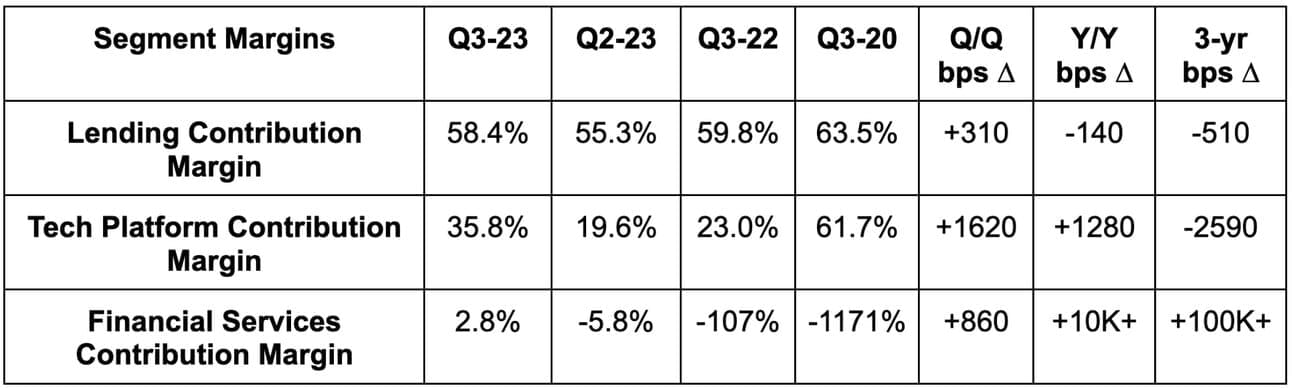
It also raised its EBITDA guidance by 15.7% and beat estimates by 13.5%. The company importantly reiterated that it will be GAAP net income positive next quarter and in 2024. It reached contribution profit positive within financial services a full quarter early. This is despite a $100 million profit drag from investing heavily in new products like credit.
This annual guidance implies Q4 guidance that is comfortably ahead on revenue and EBITDA.
Interestingly, Noto told us to expect 500,000+ member adds per quarter. This compares to 400,000+ adds in the past.
4. Balance Sheet
SoFi’s total capital ratio sits at 14.5% which is comfortably ahead of its 10.5% regulatory minimum. The company is "well capitalized with excess liquidity” per CFO Chris LaPointe.
It has $2.8 billion in cash & equivalents, $8.4 billion in warehouse capacity ($4 billon used) and $3 billion in equity to go along with $15.7 billion in deposits.
$21 billion in loans held for sale v. $18.2 billion Q/Q.
Tangible book value rose 5.5% Y/Y as it continues its new trend of book value growth.
Share count rose 3.7% Y/Y. This must slow and that is fully expected.
Clear evidence of SoFi’s balance sheet being healthy is its warehouse facility usage trend. It’s now using 47% of this higher cost of capital source vs. over 50% in the past (despite rapid origination growth).
5. Call & Presentation Highlights
Deposits & Ripple Effects:
90%+ of SoFi deposits continue to be direct while 98% of them are FDIC insured. The quality of these customers remains sky high with average new depositors boasting a 743 FICO score.
Deposits help SoFi in a few compelling ways. First, these direct deposit customers use SoFi debit products a lot more. Specifically, debit interchange volume rose 320% Y/Y to cross $1 billion ($5 billion annually). That’s a direct result of deposit growth. Debit interchange customers are higher value and lower churn vs. non-interchange.
Secondly, deposits are a lower cost source of capital for SoFi vs. warehouse facilities. SoFi is now actively shifting from warehouse funding to deposit funding thanks to its secured banking charter. 65% of SoFi’s loans are now deposit funded vs. 44% at the beginning of 2023. That’s allowing it to pocket 219 bps of margin on credit vs. a non-bank. This is a key perk of connecting deposits to originations. The 219 bps boost rose from 216 bps Q/Q.
All of this and its strong credit metrics have allowed NIM to rise from 5.74% to 5.99% Q/Q. Less warehouse usage, higher borrower coupons and strong loss rates are all helping power 119% Y/Y net interest income growth. This trend is expected to endure.
This shift away from warehouse credit should continue as SoFi grows its deposit base by 23%+ Q/Q and boasts healthy capital ratios.
Credit Health:
It’s one thing to enjoy strong credit demand with affordable cost of capital. Doing so with strong borrower performance is the butter on that freshly baked bread. SoFi has both.
Key fair value inputs for personal loans:
13.8% weighted average coupon vs. 13.6% Q/Q & 13.2% 2 quarters ago as it continues to successfully pass on yield increases faster than benchmark rates rise.
4.6% weighted average annual default rate vs. 4.6% Q/Q & 4.6% 2 quarters ago.
20.3% weighted average prepayment rate vs. 19.0% Q/Q & 19.1% 2 quarters ago.
6.6% weighted average discount rate vs. 6.1% Q/Q & 5.5% 2 quarters ago as benchmark rates briskly rise
Key fair value inputs for student loans:
5.3% weighted average coupon vs. 5.0% Q/Q & 4.9% 2 quarters ago as it successfully passes on yield increases faster than benchmark rates rise.
0.5% weighted average annual default rate which is stable Q/Q & stable vs. 2 quarters ago.
10.5% weighted average prepayment rate vs. 10.5% Q/Q & 10.6% 2 quarters ago.
4.8% weighted average discount rate vs. 4.4% Q/Q & 4.1% 2 quarters ago as benchmark rates briskly rise.
SoFi’s lending products rose 24% Y/Y while total volumes rose 48% Y/Y. By bucket, volume growth was 38% Y/Y in personal, 101% Y/Y in student and 64% Y/Y in home. It’s finding home loan growth despite soaring interest rates via Wyndham Capital boosting its quality fulfillment capacity.
The continued growth in business here is not coming at the expense of credit standards. These standards remain highly stringent and did not budge. That is why delinquency and net charge off rates still remain well below pre-pandemic levels. Personal lending 90 day delinquency worsened from 0.40% to 0.48% Q/Q while worsening from 0.13% to 0.14% for student lending. Annual charge off rate for personal lending rose from 2.94% to 3.44% Q/Q while improving from 0.42% to 0.38% for student lending. As we’ve been told, SoFi expects these metrics to keep moving higher (like for everyone else amid worsening macro) while it also expects to keep materially outperforming its peers. That confidence is a factor of strict underwriting and its borrowers earning $160,000+ on average with a FICO well into the mid 700s.
Student Lending:
The expected ramp in student loan demand took place and will intensify over the next several quarters. The team made some interesting comments about student lending growth. It told us that growth is being driven by what it decides to underwrite. It has excess demand here and may just be choosing to originate only its highest return opportunities. Student lending overall is a lower return (and lower risk) business than personal lending.
Capital Market Sales:
A key SoFi bear case is that its credit markings are too optimistic. That’s despite its constant buyer communication, pessimistic macro assumptions embedded in markings (-2.5% GDP growth & 5% unemployment) and its use of an independent 3rd party to minimize bias. This quarter, its fair value markings for personal loans fell from 104.3% to 104.1% Q/Q. This implies an expected gain on sale margin of 4.1% which is strong but still too pessimistic. Actual observed losses for the credit book are much better than the markings assume. In student lending, the marking fell from 102.6% to 101.9% Q/Q. Markings fell due to rising discount rates and spread assumptions.
The clearest sign of markings being too negative is selling loans into capital markets at gain on sale margins better than what those markings indicated. That happened this quarter with it selling a couple hundred million in personal loans at 105.1% gain on sale margins. The loan pool characteristics from this sale mimicked the overall book.
SoFi also locked in $2 billion via a forward flow agreement at similar margins. That will give it even more flexibility to originate high yielding credit with low cost deposits. Finally, it’s also wrapping up a $375 million securitization deal.
As an aside, the decision to sell some of these loans was based on the strong gain on sale margin and its ability to originate higher return credit.
Efficiency:
SoFi’s incremental EBITDA margin was a robust 48% vs. 43% Q/Q. Its incremental GAAP net income margin was 48% excluding goodwill vs. 36% Q/Q. SoFi bank generated a 19% GAAP net income margin vs. 17% Q/Q. For the 4th straight quarter, sales & marketing intensity diminished. Its marketing expense per new member fell 17% Q/Q and 32% Y/Y. This is a sign (to them) that their financial services flywheel is working and that brand awareness is building.
Growth:
Leadership all but told us that it will fully control its 2024 growth rate. If it “wanted to accelerate more then it definitely could.” Higher rates for longer don’t really pressure SoFi’s operations, but do pressure its supply chain partners. It must be cognizant of capital market ability to offer funding supply. In this light, it is tied to macro cycles more than its diversified product suite would indicate.
Financial Services & Tech Segment:
Again, this segment is contribution profit positive a quarter early. Revenue rose 142% Y/Y as things like debit interchange and net interest income rapidly grew. Revenue per product rose 61% Y/Y. Cross-selling is also going well with 50% of all Money accounts setting up deposits within 30 days.
The tech platform is making “great progress” in its transition to a focus on larger clients. The company reiterated that growth for the segment should meaningfully accelerate starting next quarter. It also signed a large regional bank as a customer this quarter. Revenue from that deal will ramp over the next 2 years. Noto called the pipeline as promising as it ever has been. Comments like this need to translate into the expected acceleration in growth going forward.
The explosion in tech segment contribution margin is due to front-loaded costs to build out the product suite starting to diminish.
67% of SoFi’s incremental revenue came from these two segments. That’s set to continue in 2024 with lending being a more secondary source of growth.
f. My Take
This was a fantastic quarter that gave me everything I wanted and more. The growth is rapid, the leverage is equally rapid and the opportunity remains mostly untapped. The team has shown a consistent ability to take more than its fair share of that opportunity. I expect that to continue with more strong execution in the years to come. There’s nothing for me to pick at here. Just strong financials, outperforming credit health and a company firing on all cylinders. The stock’s reaction will not change my opinion that this performance was wonderful.
SoFi Earnings Review
Brad, I own SOFI. I watch the Sofi weekly on youtube. Reading your analysis is better. No banter and BS. Just the facts. LOVE IT and appreciate your work.
Donna
Thanks Brad, top quality analysis as usual 👌