
SoFi is a one-stop-shop for consumer financial services. It aims to provide consumers with excellent products for all major financial services. It further aims to delight them to a point of customers never going anywhere else. That creates key cross-selling and acquisition cost benefits. It owns its tech stack, has no branches and possesses a bank charter, which gives it cost advantages vs. incumbents and fellow disruptors. It also sells its tech stack to customers like H&R Block and Robinhood.
“Despite massive geopolitical and macro events, we had a great year. We’ve shown we can thrive across environments, which reinforced my conviction in SoFi becoming a top ten financial institution.” – CEO Anthony Noto
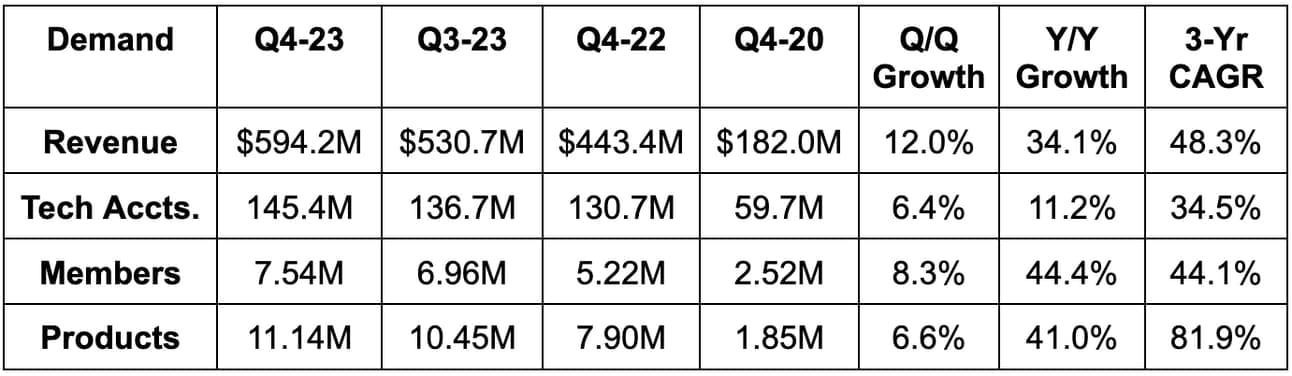
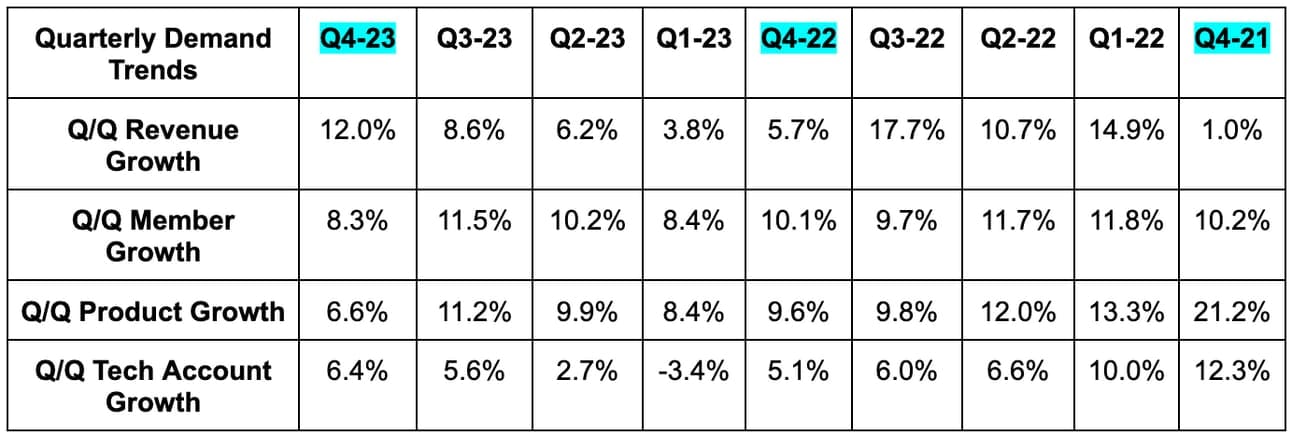
1. Demand
SoFi beat revenue estimates by 4.0% & beat its guidance by 3.3%. Its 48.3% 3-year revenue compounded annual growth rate (CAGR) compares to 34.8% as of last quarter and 53.1% 2 quarters ago. It also added nearly 600,000 members vs. its guidance of 500,000+ and added $2.9 billion in deposits vs. its guidance of $2 billion+.
2. Margins
- Beat EBITDA estimates by 26% & beat EBITDA guidance by 29%.
- Beat $0.00 GAAP earnings per share (EPS) estimates by $0.02; first positive GAAP EPS quarter as expected.
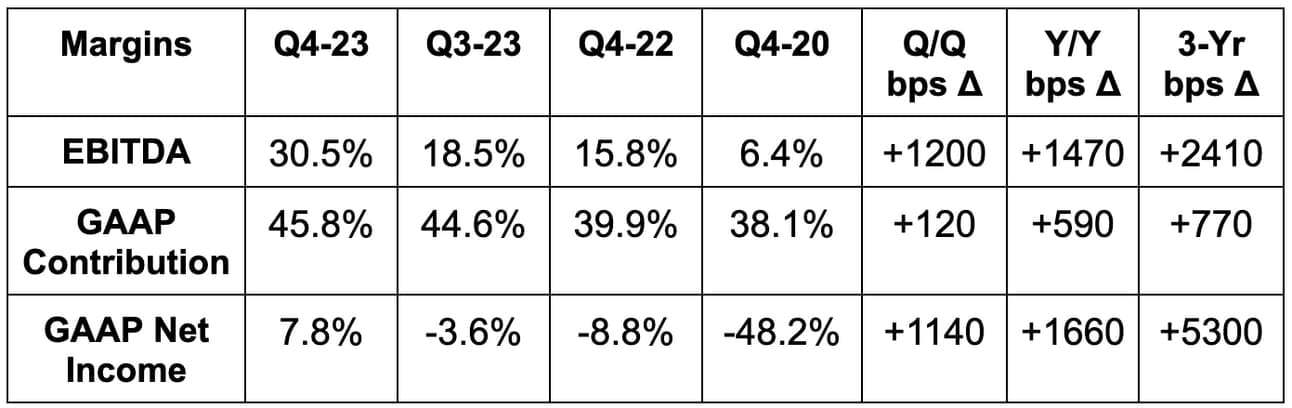
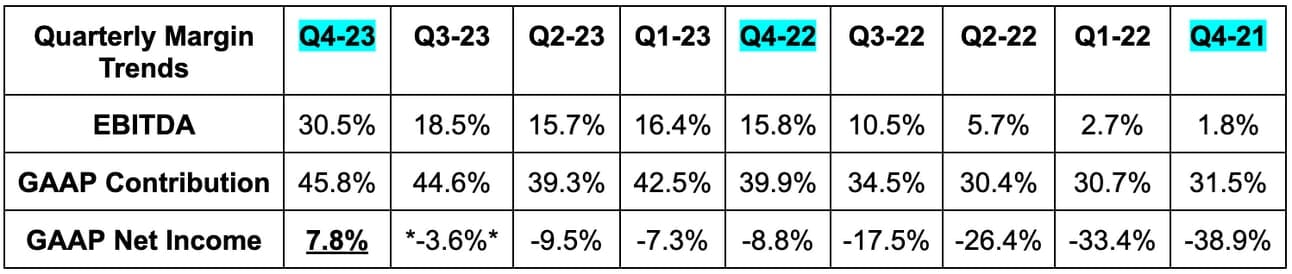
*Q3-2023 GAAP net income excludes a goodwill impairment charge stemming from its Technisys acquisition.*
3. Balance Sheet
- $3.1 billion in cash & equivalents vs. $2.8 billion Q/Q.
- $5.2 billion in debt.
- SoFi added $334 million in tangible book value growth for 2023 and is gearing up to accelerate that growth to $400 million in 2024. Tangible book value now sits just under $3.5 billion. Its price to next 12 month tangible book multiple sits at 2.3x.
- Usage of warehouse credit continues to fall further and further below 50% as it shifts to deposit-funded lending. It’s using about $3.3 billion of its $9 billion in warehouse capacity vs. $4 billion Q/Q.
- Loans held for sale fell from $21 billion to $15.4 billion Q/Q via sales and a student loan reclassification discussed below.
- Deposits rose by 18.8% Q/Q vs. 23.3% last quarter & 25.9% 2 quarters ago.
- Share count rose 4.9% Y/Y for 2023. This must slow, and it will slow as stock comp intensity continues to fall, it moves away from M&A and distances itself from the IPO.
4. Guidance
Next quarter guidance was a bit light across the board. That would have concerned me if it weren’t for the rest of the guidance that it gave. For the full year, SoFi:
- Missed revenue estimates by 1.3% at most (gave an “at least” growth target).
- Beat EBITDA estimates by 4.5%.
- Beat $0.05 GAAP earnings per share (EPS) estimates by $0.025.
- Non-lending to be 50% of revenue vs. 38% Y/Y.
Annual guidance seems overly conservative to set up more outperformance. It assumes -2.5% Y/Y GDP growth, 4 rate cuts, 5%+ unemployment and a “very conservative view of the lending market.” This is a far more conservative 2024 view than large banks like BofA are taking. BofA sees a soft landing.
Encouragingly, it gave impressive 3 year targets as well:
- It sees revenue compounding at a 3-year clip of 22.5% vs. consensus expectations of 17.6% Y/Y growth. Strong.
- It sees EPS reaching $0.67 in 2026 vs. consensus expectations of $0.45. Strong again. It also sees 20%-25% EPS compounding beyond 2026. This puts it at a PEG ratio of 0.6x using assumed net income growth rates from 2024-2026.
- The tech platform is expected to compound revenue at about a 25% Y/Y clip.
Long term targets should always be taken with a large grain of salt. Still, this team has a history of exceeding long term targets despite unforeseen headwinds. Based on 2024 guidance, SoFi trades for 18x EBITDA and about 120x GAAP EPS. EBITDA is expected to grow by 35% Y/Y and EPS is expected to compound at a multi-year clip in excess of 120%.