Table of Contents
- a. Key Points
- b. Demand
- c. Profits & Margins
- d. Credit Health & Balance Sheet
- e. More on the Call & Release
SoFi is a one-stop shop for financial services. It aims to provide consumers with excellent products for all major needs and events. It further pushes to delight them to the point of never going anywhere else. That creates key cross-selling and acquisition cost benefits. It also owns its tech stack, has no branches and possesses a bank charter, which all give it the rare ability to combine the cost edges that incumbents and fintechs separately enjoy. It also sells its tech stack to customers like H&R Block and Robinhood. My SoFi deep dive can be found here.
a. Key Points
- Great Q4 results across the board.
- Much better than expected 2025 revenue guide, but it needs to do more investing to deliver that target. That led to profit disappointment for 2025, while 2026 profit targets were reiterated.
- Credit metrics continue to improve while capital market loan demand remains exceedingly strong. The risk of breaching its loss rate targets continues to fade.
- The balance sheet is in great shape.
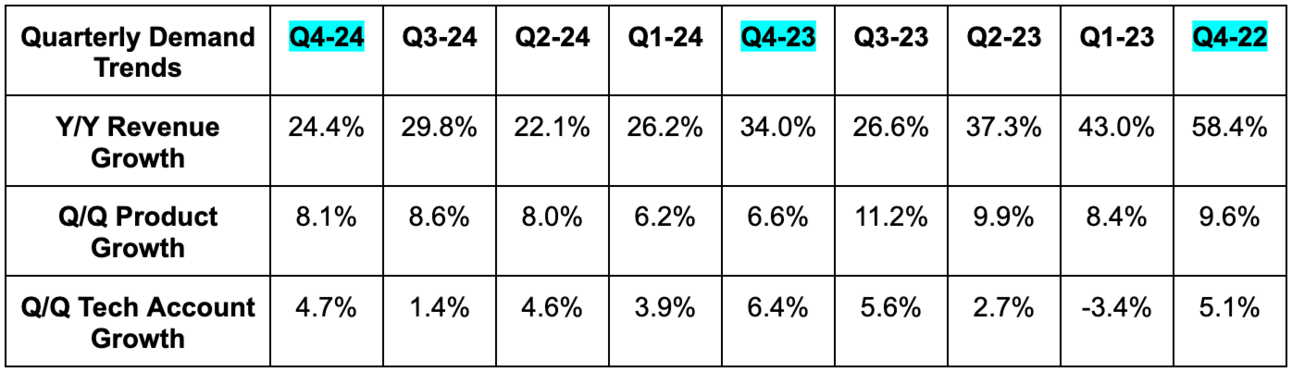
- Tech revenue disappoints… but tech account growth again outperforms, which hints at brightening future results.
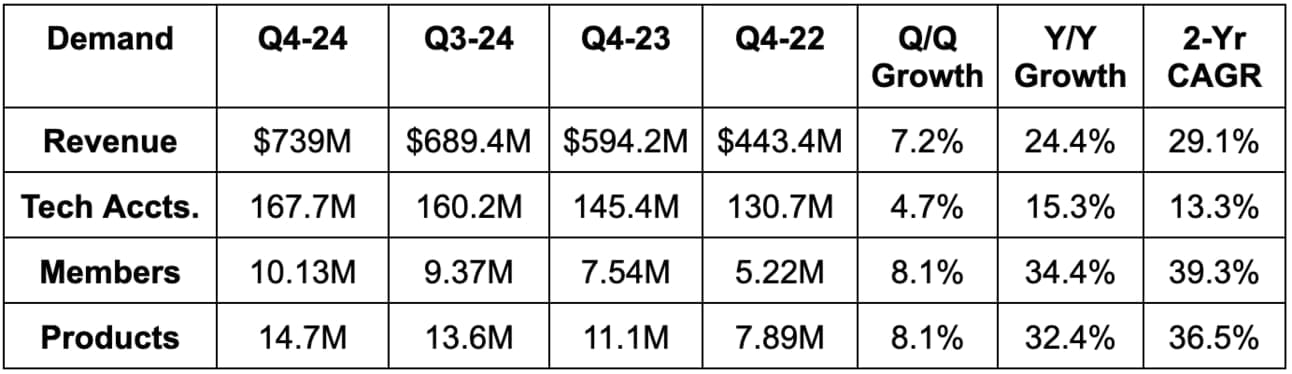
b. Demand
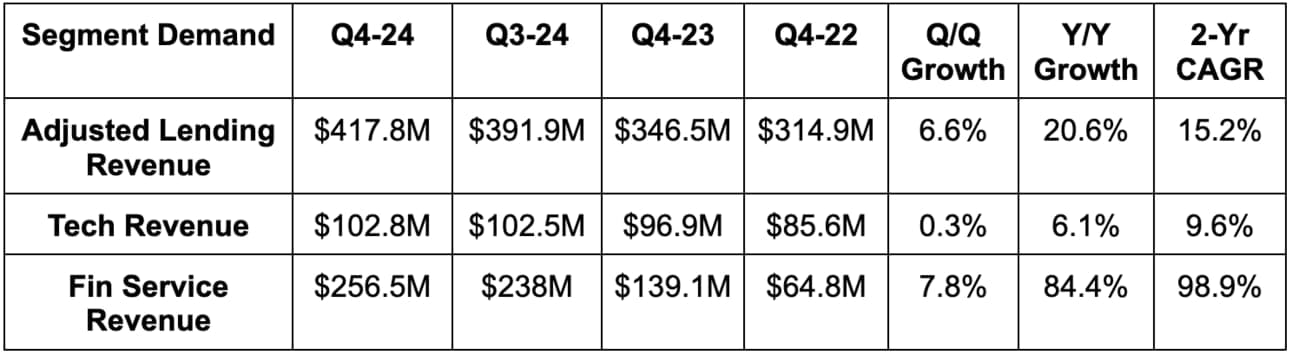
- Beat revenue estimates by 9.0% & beat guidance by 9.4%.
- Lending beat by 18%.
- Financial services beat by 4.5%.
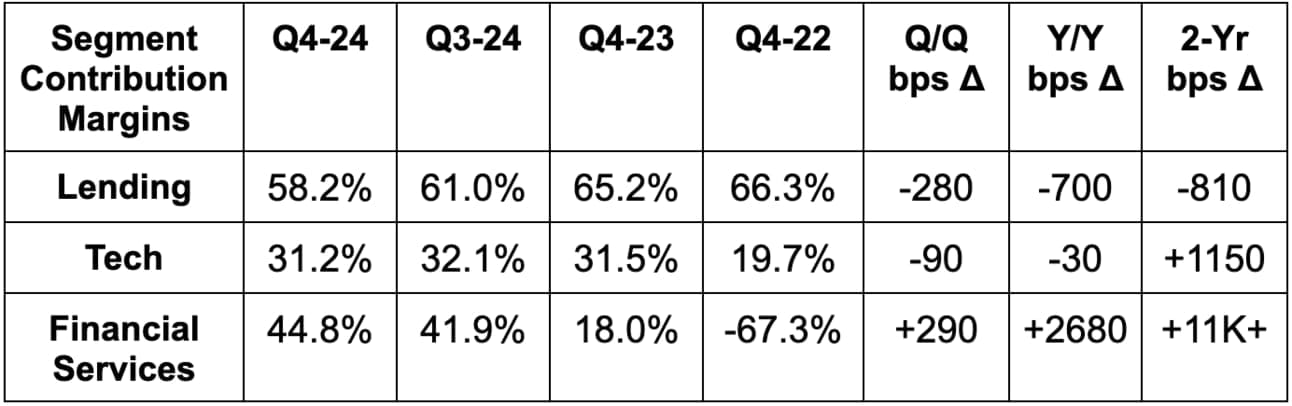
- Non-lending revenue represented 40% of total revenue vs. 49% Y/Y. This was mainly thanks to financial services.
- Beat tech account estimates by 1.4%. Missed tech revenue estimate by 2.7%.
- Non-interest income rose 7% Y/Y. Net interest income fell Y/Y due to rate cuts.
- Beat member estimates by 2.6% & beat member guidance by 2.9%. Beat product estimates by 1.8%.
- This quarter marked a new record for both member and product adds.
- Beat deposit estimates by 2.4%.
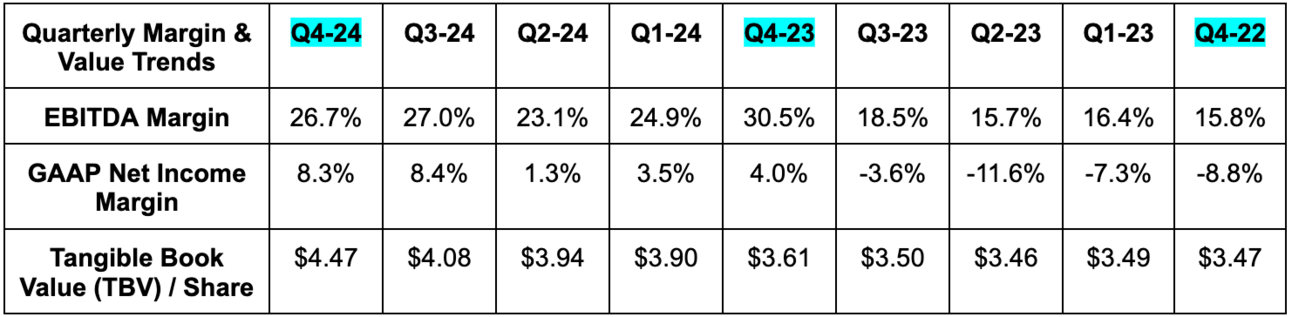
- Beat $4.04 tangible book value per share estimates by $0.43 or 10.6%.
- SoFi’s unaided brand awareness rose from about 5.3% to 7.0% Y/Y.
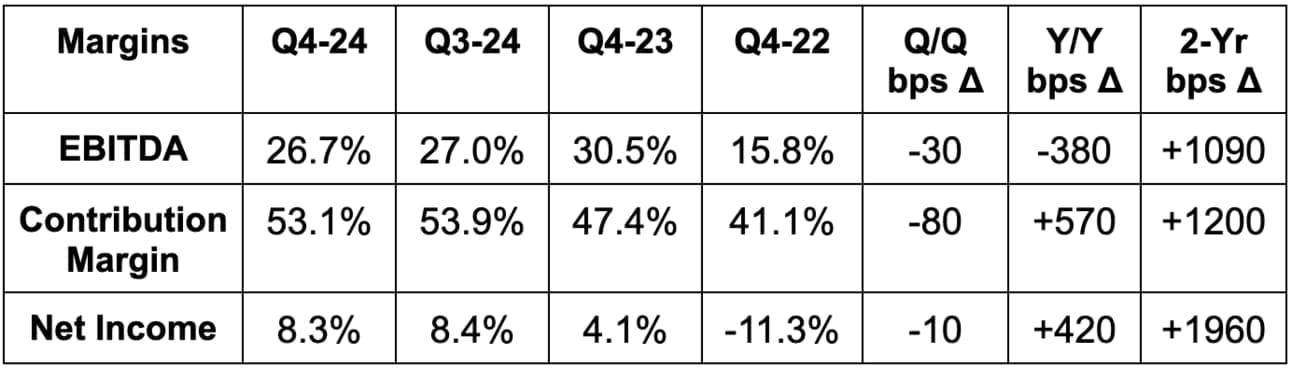
c. Profits & Margins
- Beat EBITDA estimates by 10.9% & beat guidance by 13.7%.
- Beat $0.04 EPS estimates by $0.01 (net income beat by 34%) & beat estimates by $0.015.
- GAAP EPS was $0.29, but this was largely related to deferred tax benefits that will not recur as it permanently inflects to profitability. It’s better to focus on the $0.05 number that excludes this help.
- Beat 5.44% net interest margin (NIM) estimates by 47 basis points (bps; 1 basis point = 0.01%).
- Beat contribution profit estimates by 8.5%.