1. SoFi (SOFI) – Earnings Review
SoFi is a one-stop-shop for financial services. It aims to provide consumers with excellent products for all major needs and events. It further aims to delight them to the point of never going anywhere else. That creates key cross-selling and acquisition cost benefits. It also owns its tech stack, has no branches and possesses a bank charter, which gives it the rare ability to combine the cost edges that incumbents and fintechs each uniquely enjoy. It also sells its tech stack to customers like H&R Block and Robinhood.
a. Demand
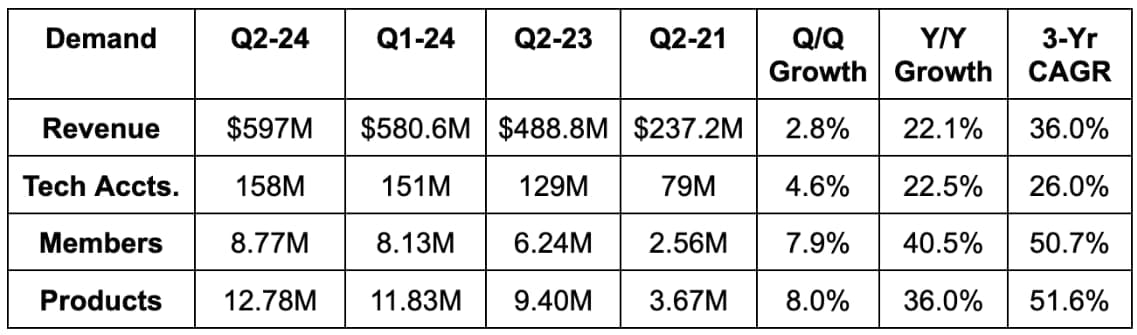
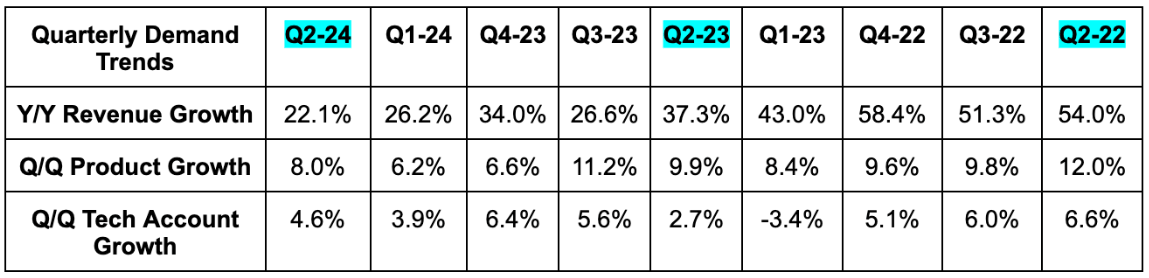
SoFi beat revenue estimates by 5.3% & beat its guidance by 6.6%. Its 36% 3-year revenue compounded annual growth rate (CAGR) compares to 39% Q/Q and 48% 2 quarters ago. Product growth, excluding its exit from the crypto business due to getting its bank charter, rose 43% Y/Y. 40% of all new products were opened by current SoFi members during the quarter as the cross-selling machine hums. Net interest income rose 42% Y/Y to $412.6 million.
“The quarter was exceptional, as we continue to demonstrate a record of strong diversified growth even in uncertain times… I can’t wait to see what we can achieve in a better environment.”
CEO Anthony Noto
b. Profits & Margins
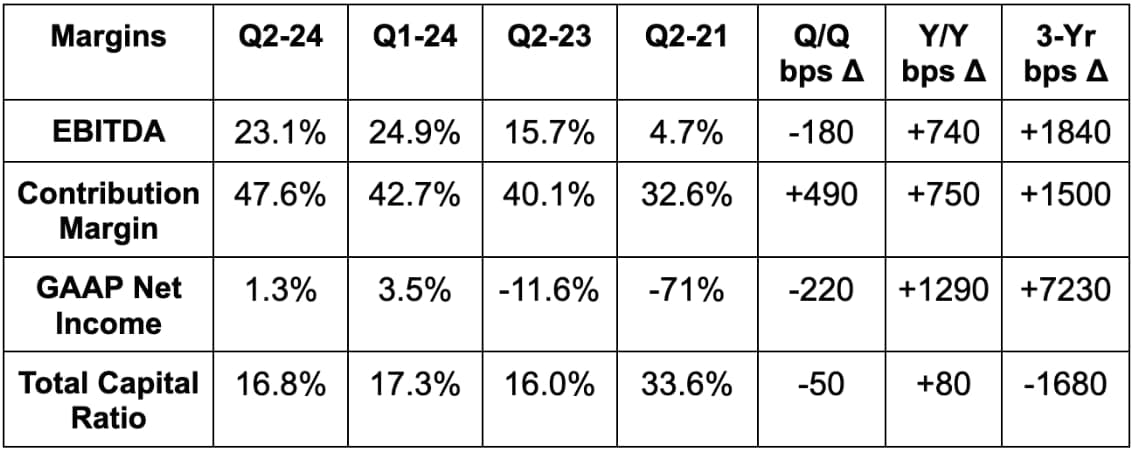
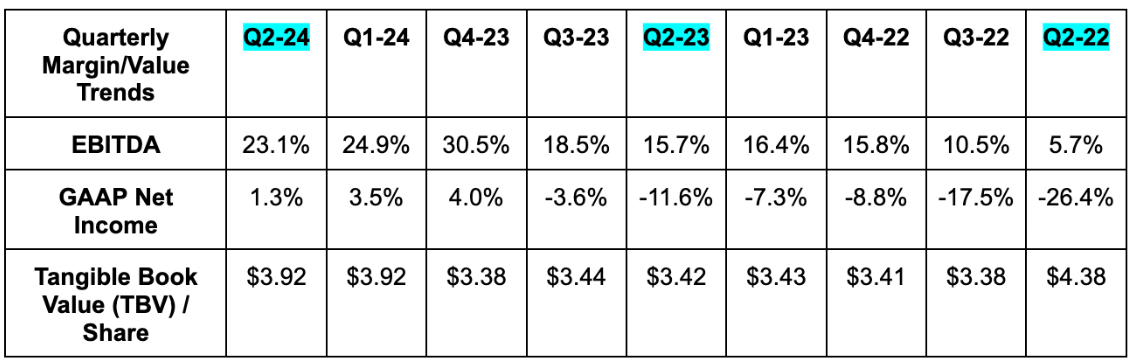
- Beat EBITDA estimates by 12.6% & beat guidance by 14.9%. EBITDA rose 80% Y/Y.
- Beat GAAP net income guidance & estimates. GAAP net income margins in the table below exclude positive impacts from capital market note deals and negative impacts from Technisys goodwill impairment.
- Beat $0.00 GAAP EPS estimate by nearly $0.01.
- SoFi Bank delivered a 20% GAAP net income margin and an annualized return on equity (ROE) of 11.2%.
c. Balance Sheet
- $2.33 billion in cash & equivalents.
- $3.1 billion in total debt.
SoFi delivered $23 billion in total deposits. Consumer deposits rose $2.2 billion Q/Q, but it paid down $800 million in higher cost brokered CDs, which is why overall deposit growth was below $2 billion (roughly $1.4 billion for the quarter). 80% of its credit book is now deposit funded, and it sees 80%-90% as an optimal level. This means the large growth boost from balance sheet optimization and swapping in more interest earning assets is drawing to a close. It will need to compound members, products and engagement going forward to keep the growth engine pumping. Signs of that happening are positive.
d. Credit Metrics & Health
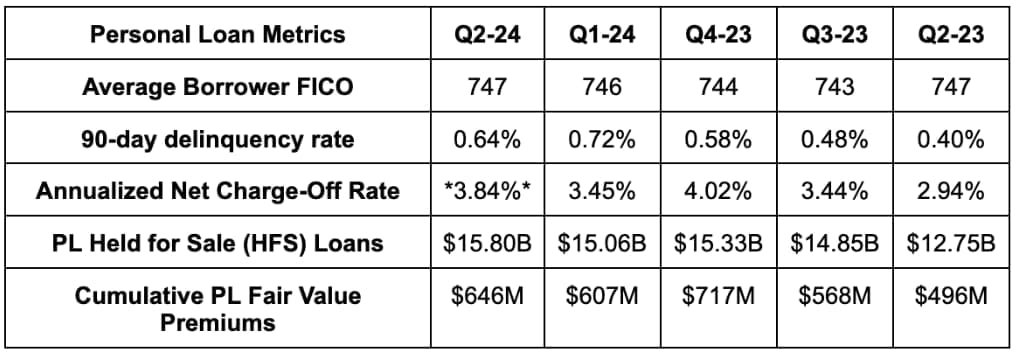
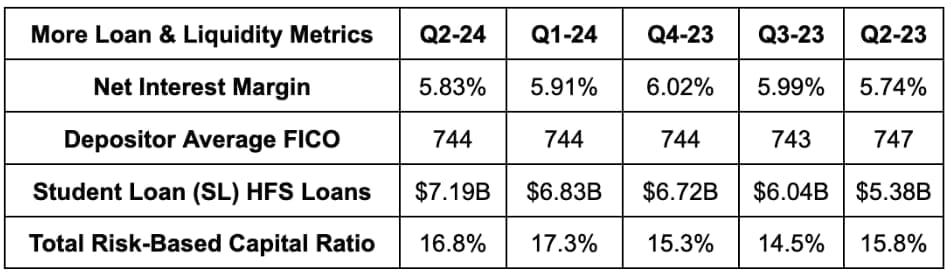
Its personal loan borrowers have a 747 FICO on average with $168,000 in annual earnings vs. 746 and $169,000 Q/Q. Its average student borrowers have a 768 FICO and $146,000 in annual earnings. Overall credit performed “better than expected” as delinquencies on an absolute dollar and percentage basis showed clear signs of topping in March as you can see in the 2nd chart above. As a reminder, delinquency rates are a leading indicator for future net-charge offs (NCOs). Speaking of which…
NCO rate stayed comfortably below 4%, but more context is needed. Like last quarter, SoFi sold off a chunk of late stage delinquent loans due to positive value realization. NCO without this help would have been 5.4% and life of loan loss rate for this Q would have approached 8%. But? SoFi vitally reiterated its 7%-8% life of loan loss rate target – just like Lapointe did a few weeks ago.
Beyond entirely kosher maneuvers like delinquent loan sales to control the metric, there are more structural and encouraging reasons for this optimism. It offered some new vintage analysis to depict where its confidence is coming from, which I found quite highly positive. It took us back to 2017, as that was the last year its loss rates approached 8%. Its 2020 - Q1 2024 vintages at the same amortization rate boast significantly better loss rates vs. 2017. Not just this, but newer vintages are now showing a concrete pattern of improving credit health.
The 2020-2024 vintages overall are 56% of the way through repayment and have an average loss rate of 3%. To breach its 8% target, that loss rate for the remaining 44% of principal would need to be 11%. SoFi has never seen loss rates remotely close to that level. Even in Q4 2022, as it was tightening credit parameters and dealing with riskier borrowers than it wanted, the charge-off rate of 5.02% compares to 6.07% in 2017.
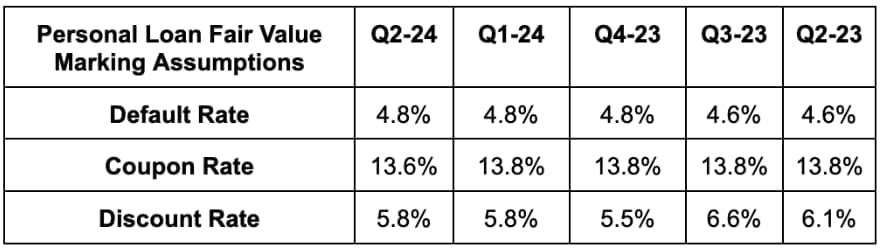
As an important note, bears will readily pick on the rising cumulative fair value premium adjustments Q/Q from $608M to $646 million. Rising premiums do benefit financial results and are based on assumptions that SoFi and a 3rd party make. Skeptics say assumptions are unfair, but they’re all published quarterly and I personally see nothing wrong with methodology, which is vetted by a 3rd party. SoFi also sees a cumulative fair value adjustment peak currently playing out on an absolute and % basis. That’s good news for sentiment.
e. Guidance & Valuation
Annual:
- SoFi raised annual revenue guidance by 1.4%, which beat by 1.0%.
- SoFi raised annual EBITDA guidance by 2.5%, which beat by 3.6%.
- SoFi raised $0.085 GAAP EPS guidance by a penny, which beat by $0.005.
- Reiterated annual tangible book value (TBV) and member growth guidance.
- Now sees lending revenue at 95%+ of 2023 levels vs. 92%-95% previously.
- Now sees 80%+ financial services growth vs. 75% previously. Now sees about 17% Y/Y tech platform growth vs. 20% previously.
Q3 revenue and EPS were ahead, while EBITDA was in line.
SoFi trades for 75x 2024 GAAP earnings. EPS is expected to compound at a 109% clip for the next two years.
e. Call & Release
Lending Prudence & Extending Beyond the Segment:
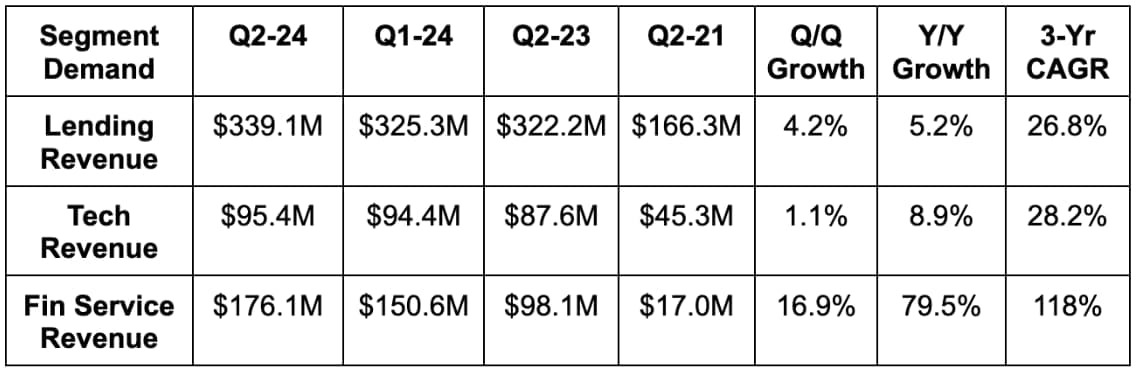
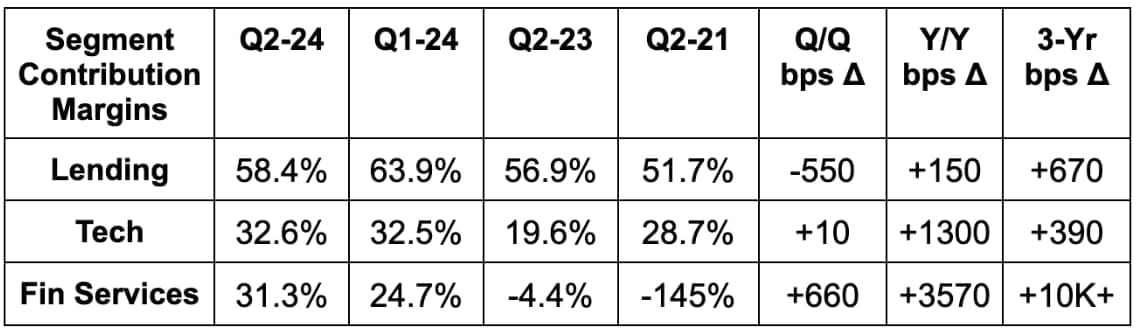
45% of SoFi’s revenue now comes from non-lending sources vs. 38% Y/Y. This company continues to be overly conservative when it comes to revving the origination engine. As I’ve said time and time again, this is something I fully support. The decision risks delaying some revenue generation from this segment for a few quarters instead of risking a balance sheet blow-up. With rate expectations violently fluctuating like they have, prudence has made perfect sense… and the company continues to deliver rock-solid growth anyway.
A big part of that is 80% Y/Y growth in financial services as that segment continues to thrive. Bears will readily and rightfully say that a lot of this growth is simply more net interest income (NII) stemming from balance sheet optimization with its banking charter in hand. As it shifts to more interest-earning assets on that balance sheet, financials are helped. That’s fair. But conversely, non-interest income rose 58% Y/Y to reach $37 million as it added more products and monetized those products more impactfully. Specifically, revenue per financial service product rose 8% Q/Q and 29% Y/Y. Excluding the impact of exiting its crypto business amid getting the bank charter, financial service products rose 48% Y/Y.
Here are some of the highlights from the fin service product segment and some items on what’s driving the success:
- Its invest product saw assets under management (AUM) rise 58% Y/Y, which was driven by inflows rather than asset appreciation.
- Its alternative assets like private credit helped drive a sizable chunk of this momentum.
- It’s taking more friction out of its asset transfers by making that a one-click process.
- “Finalizing a turnkey process” for companies going public to seamlessly direct shares to retail investors.
- Zelle integration is live. This was a constant member request.
- Extended redemption of rewards into travel, stock and cash as its rewards member base crossed 3 million total. Rewards members deliver more revenue, lower churn and so superior value.
- Thanks to more direct deposit members and rising balances, debit spend rose 129% Y/Y to reach $9 billion in annualized volume.
SoFi Plus, its premium membership program, crossed 1 million total members this quarter. Interestingly, SoFi will create a new membership tier allowing folks without direct deposit to pay a monthly fee for access to its 4.6% savings yield. This is basically Robinhood Gold. For self-employed people like me, this should be a material unlock for attracting more deposits. Lastly on credit cards, SoFi’s 10% cashback boost for plus members is yielding “positive results” early on. Sofi is also testing two cards starting this week: One with attractive cashback rewards and one with zero surprise fees. Generally speaking here, credit card delinquency and roll rates are both 20% better vs. 2023. SoFi is getting closer to gaining the underwriting confidence needed to accelerate issuance here. It thinks its credit and its brokerage products together can eventually be larger than the firm’s entire current revenue base. That’s why it’s intentionally incurring $100 million in annual losses to nurture these newer bets and maximize success probability. Credit card losses can turn sour rapidly; you must be sure that you have figured out underwriting before you lean in. This is rational.