
1. Demand
SoFi beat revenue estimates by 5.3% and beat its guidance by 3.4%.
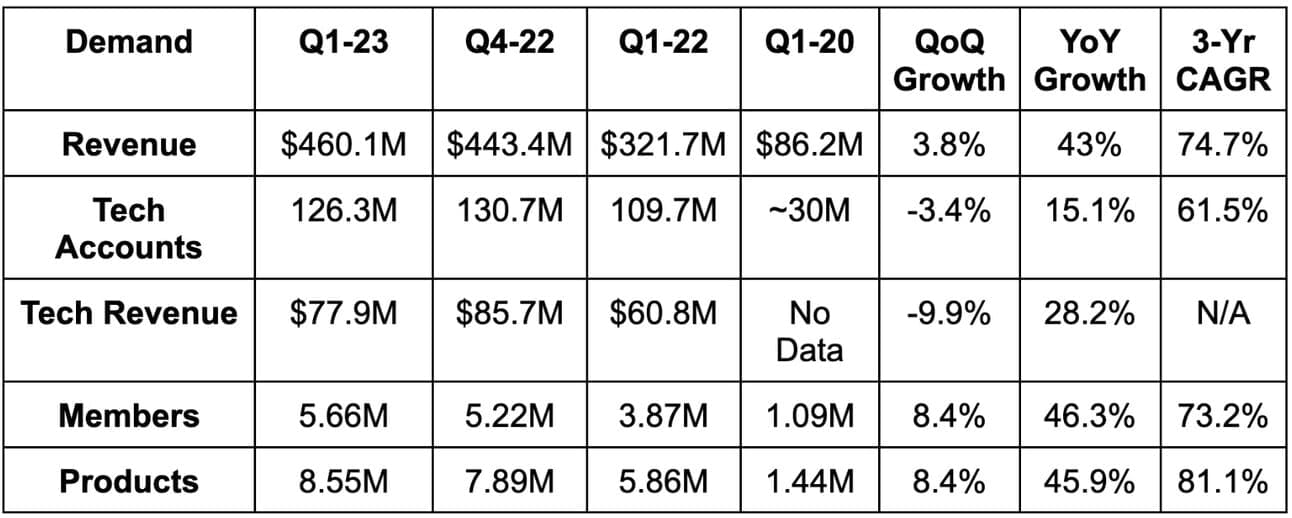
More Demand Context:
- The 3 year growth metrics use a Q1 2020 base period. That’s when the pandemic hit this business the hardest and made for very easy 3 year growth comps.
- Organic Galileo growth was just 3% YoY. The rest of the tech platform contribution growth came from Technisys M&A which closed towards the end of Q1 2022.
2. Margins
SoFi crushed EBITDA estimates by 81% and beat its guidance by 78%. It also beat estimates of a loss per share of $0.09 by $0.04.
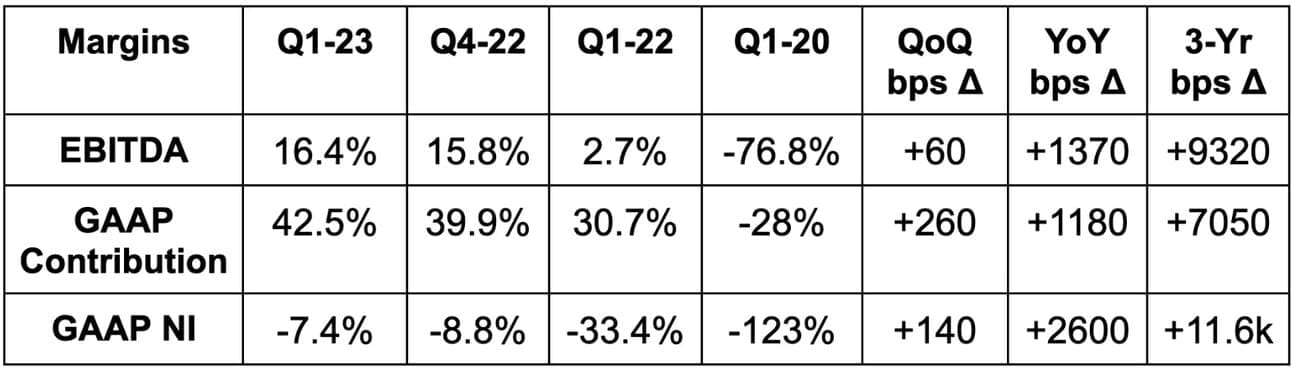
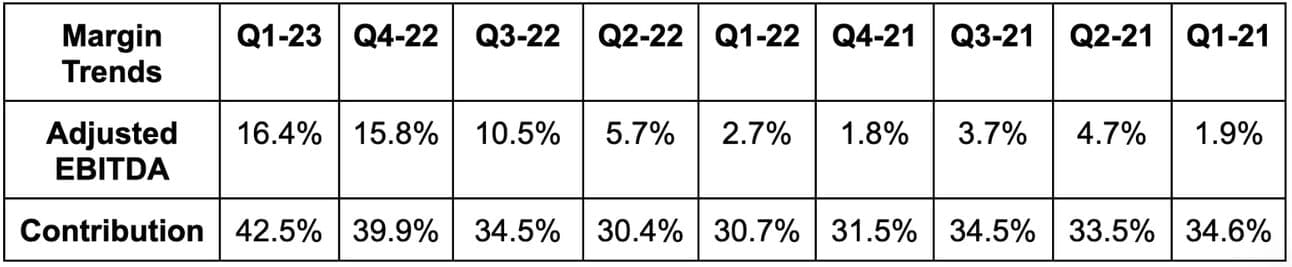
Margin Context:
- 3 year comps were uniquely easy for margins for the same reason as demand.
- SoFi delivered a 54% GAAP net income incremental margin thanks to expanding net interest margin and a 48% incremental EBITDA margin.
- SoFi Bank boasted a GAAP net income margin of 20% vs. 11% QoQ.
- Contribution margin ex-Technisys was 28% vs. 24% QoQ.
3. Guidance
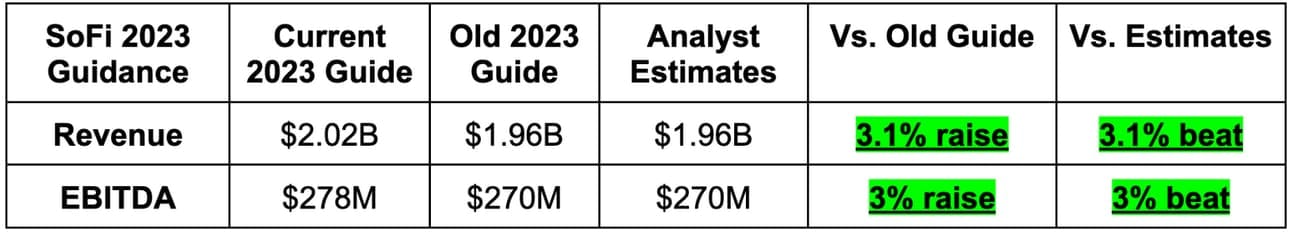
SoFi’s guide continues to assume 5% unemployment, 2% GDP contraction for the year and unfavorable credit spreads. Well… 2% GDP contraction for the year is looking quite pessimistic at this point while it continues to see more favorable credit spreads for loans sold through capital markets. Its last credit market deal was 8x oversubscribed which inherently fosters tightening spreads. So? It’s setting itself up for more under promise and over deliver.