
“Given the results, I can’t help but to be incredibly optimistic about the future of Sofi. Even in tough market conditions, quarter after quarter we meet and exceed guidance. Our members need us more than ever… and we will continue to rise to the occasion.”-- CEO Anthony Noto
1. Demand
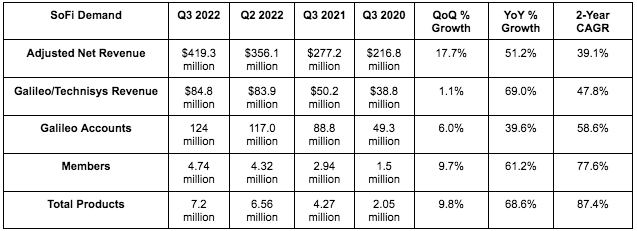
SoFi’s revenue of $419.3 million beat analyst estimates of $391.8 million by 7.1%
More Context on Demand:
- This was SoFi’s 6th straight quarter of record revenue growth as it set new records for all 3 revenue segments… including lending DESPITE the student loan moratorium, soaring mortgage rates and a fulfillment partner transition.
- Personal loans more than made up for the 50% volume headwinds that both student and home loans dealt with this quarter as SoFi’s revenue diversification shines amid tough macro.
2. Profitability
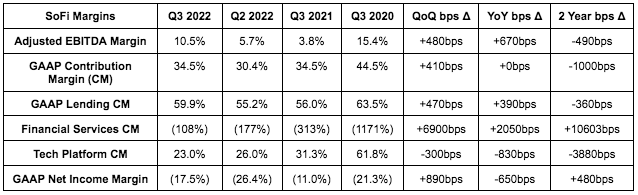
- SoFi’s adjusted EBITDA of $44.3 million beat analyst estimates of $30.8 million by 43.8%
- SoFi lost $0.09 per share in GAAP net income, missing expectations by $0.02.
More Context on Margins:
- The GAAP net loss worsening was solely from Q3 2021 enjoying a $64.4 million boost via a change in fair value of warrant liabilities (SPAC noise). Net loss would have shrunk by $20.2M YoY without this.
- SoFi continues to expect positive contribution profit from the financial services segment next year and positive GAAP net income by 2024. There was no update here.
- The tech platform would have had a 30% contribution margin this quarter without Technisys which is currently a large margin headwind.
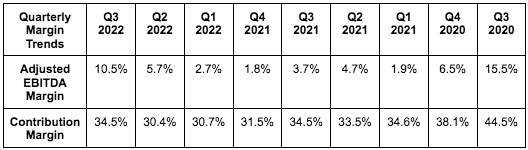
- Marketing efficiency continues to improve with its customer acquisition cost now in line with its long term 30% EBITDA margin target.
- Current Expected Credit Loss (CECL) building is weighing heavily on financial services margins. That headwind eased this quarter vs. last, but is still there.
3. Balance Sheet
- SoFi has $935 million in cash and equivalents on the balance sheet vs. $707 million QoQ and $533 million YoY
- SoFi has $2.77 billion in debt vs. $2.70 billion YoY
- SoFi’s diluted share count grew 13.6% YoY… BUT QoQ growth was just 0.6% as stock comp expenses slow as we distance ourselves from the company going public. Growth here needs to continue slowing and it is expected to.
- SoFi’s interest bearing deposits grew 86% QoQ to $4.94 billion as its $100 million per week deposit rate accelerated further.
- SoFi is using 35% of its warehouse loan capacity vs. 23% QoQ.