sections d, e, f & g are for paid readers. They walk through detailed credit information, capital market liquidity and all of the relevant notes from the call. Upgrade below to read this and 40+ other earnings reviews this season.
In case you Missed it:
- Tesla Earnings Review.
- Netflix Earnings Review.
- Taiwan Semi Earnings Review.
- My current portfolio & performance vs. the S&P 500.
About SoFi:
SoFi is a one-stop shop for financial services. It aims to provide consumers with excellent products for all major needs and events. It further pushes to delight them to the point of never going anywhere else. That creates key cross-selling and acquisition cost benefits. It has a large lending business with an increasingly diverse array of funding options, as well as bank accounts, brokerage services, 3rd-party insurance options, credit cards and so much more. It also owns its tech stack, has no branches and possesses a bank charter, which all give it the rare ability to combine the cost edges that incumbents and fintechs separately enjoy. It also sells its tech stack to customers like H&R Block and Southwest Airlines. My SoFi deep dive can be found here. This gets into intricate detail on the firm's unique value proposition within banking, and everything else you need to know about it.
a. Key Points
- The loan platform business continues to thrive.
- Financial services innovation has convincingly picked up.
- SoFi remains confident in 2026 guidance.
- A record quarter for new members and cross-selling existing members more products.
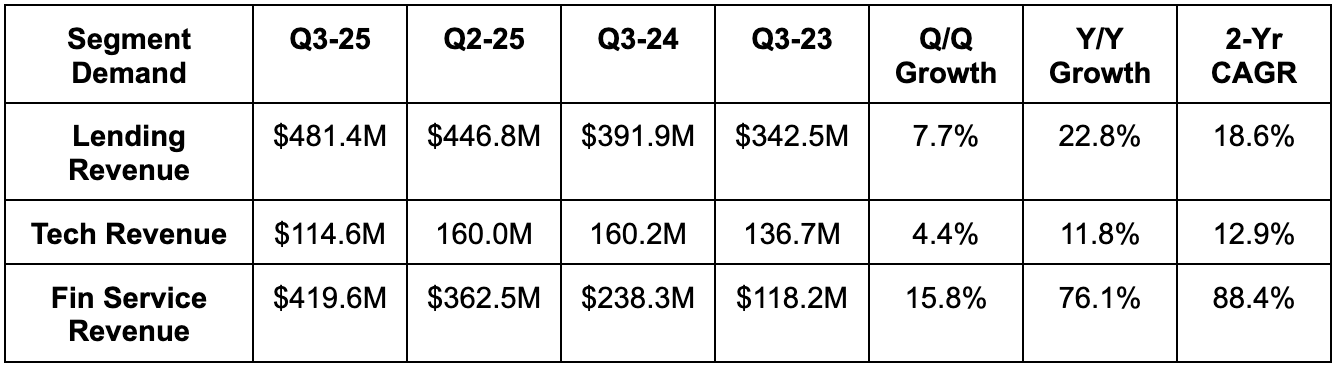
b. Demand
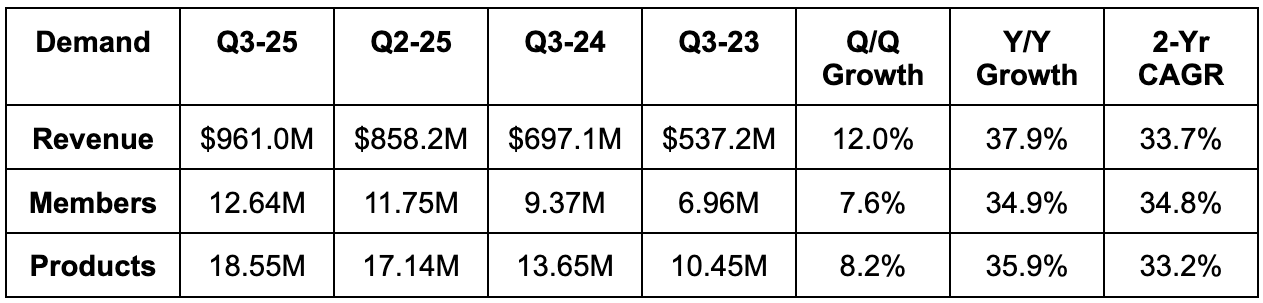
- Beat revenue estimates by 7.4%.
- Beat tech platform revenue estimates by 2.3%.
- Beat lending revenue estimates by 7.4%.
- Beat financial services revenue estimates by 16.9%.
- Beat member estimates by 2%. This was a quarterly record for net new members.
- Met product estimates. This was also a quarterly record for net new products.
- Beat deposit estimates by 6.5%.
Non-interest income beat estimates by 8.2%. This is where SoFi’s asset light businesses (that aren’t tied to balance sheet growth) preside, so it’s good to see this come in so strongly. Net interest income beat estimates by 6.5%.
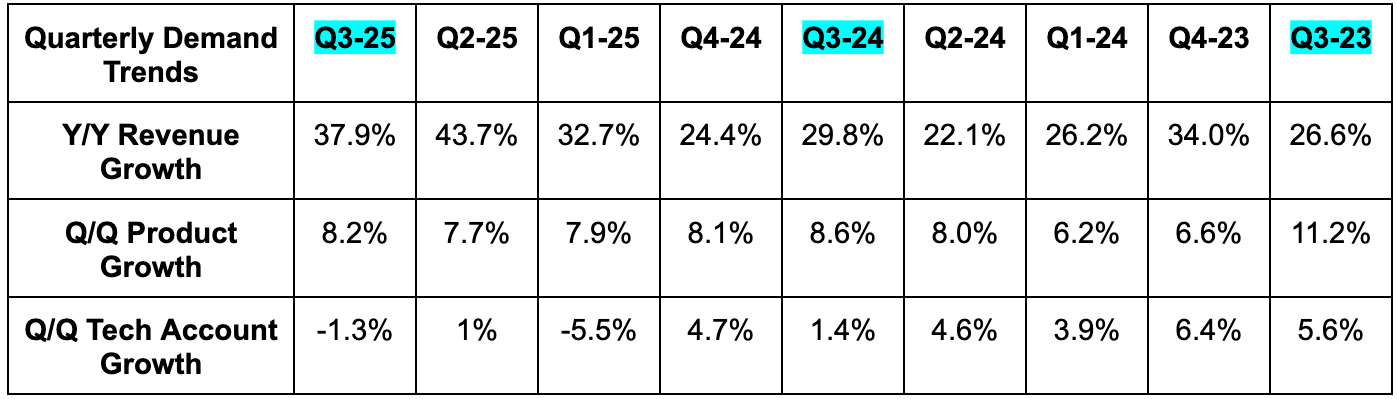
While growth looks fantastic at this scale, the runway looks equally fantastic. Unaided brand awareness sits at just 9.1%. It’s rapidly rising via partnerships with Josh Allen, the Big Ten/Big 12 and others. Revenue growth is following that upward trajectory, which is highly encouraging considering how much further brand awareness has to go. When they spend… consumers respond. And there are so many productive dollars left to spend.
c. Profits, Book Value & Margins
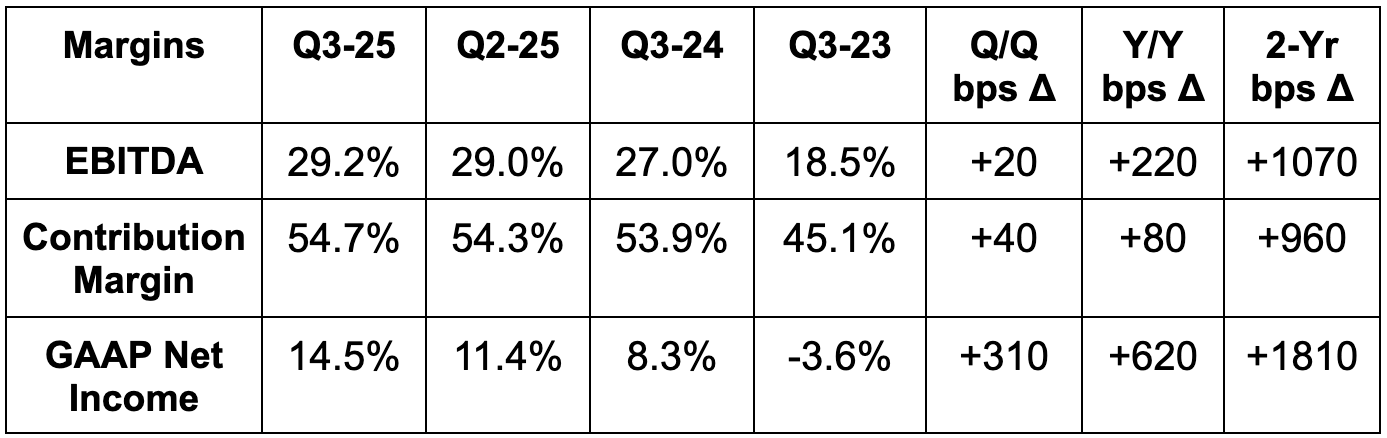
- Beat EBITDA estimates by 5.7%.
- Its incremental EBITDA margin was 35%.
- Beat $0.09 GAAP EPS estimates by $0.02.
- $0.11 in EPS vs. $0.05 Y/Y for 120% Y/Y growth.
- Beat 54.6% contribution margin estimates by 10 basis points (bps; 1 basis point = 0.01%).
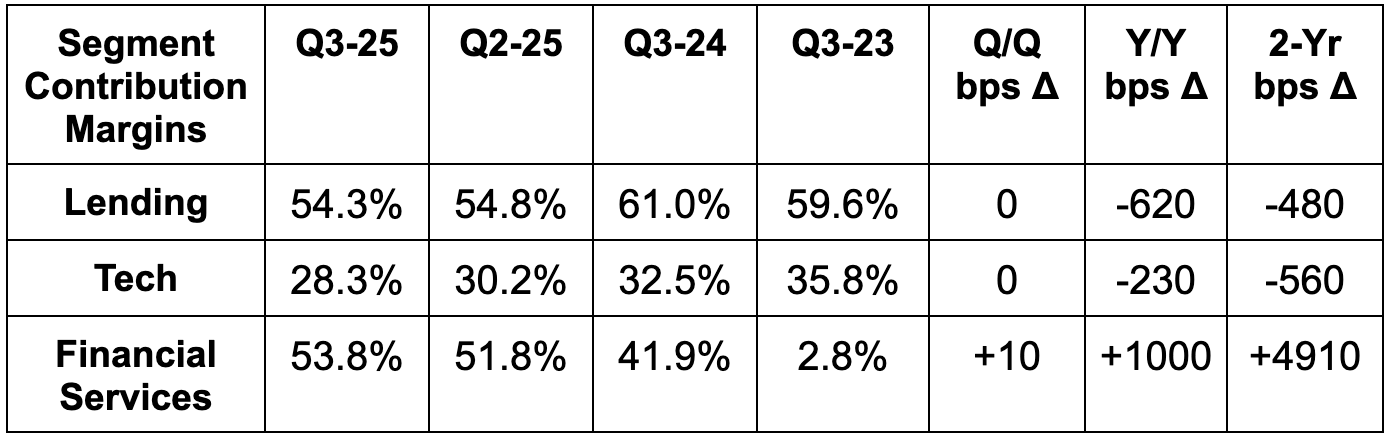
- Financial services contribution margin was 54.8% vs. 50.9% expected. This drove the entire beat and offset lending and tech platform margin misses.
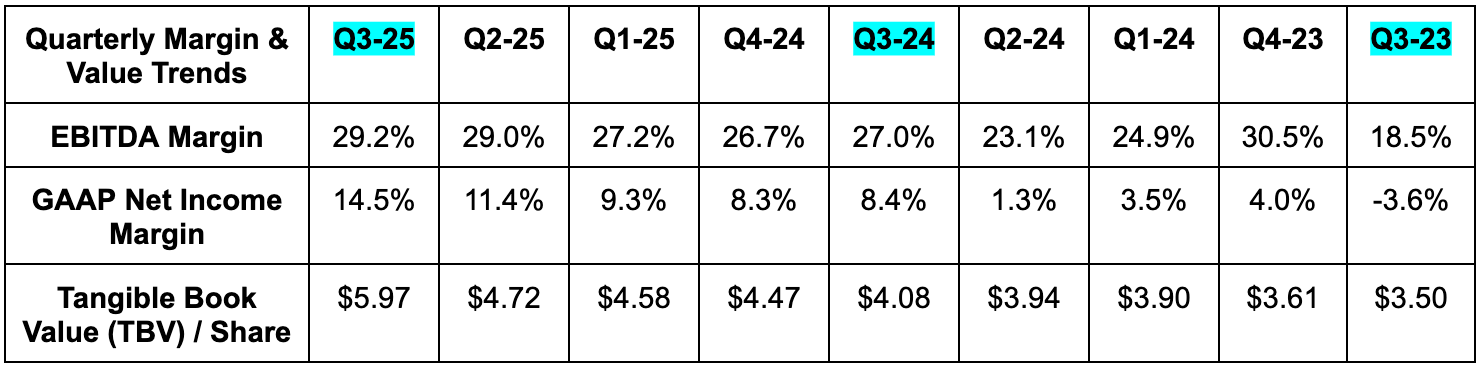
- Return on tangible common equity (ROTCE) was 8.5% vs. 3.9% for 2024 overall and -11% just 3 years ago.
- Tangible book value soared higher due to the large equity raise the company conducted during the quarter.