
1. Demand
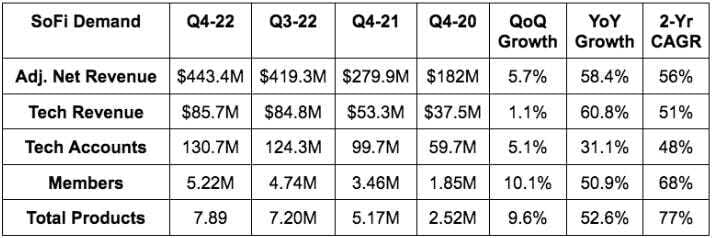
SoFi’s $443.4 million in adjusted net revenue beat analyst estimates by 4.2%.
More Context on Demand:
- SoFi’s 2022 guide anticipated a student loan volume ramp in December as the moratorium was supposed to end January 1st 2023. The extension prevented any ramp from taking place, which hit both revenue and -- as it’s a high margin product for SoFi -- profitability. It beat regardless of this.
- Revenue growth of 58% YoY accelerated from 51% YoY growth last Q.
- The 56% 2 year revenue CAGR compares to 39.1% last quarter.
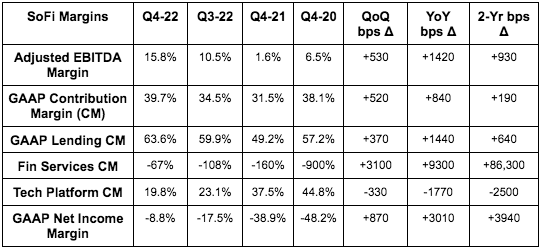
2. Profitability
More Context on Margins:
- SoFi’s incremental GAAP Net Income margin for Q4 2022 was 42%. Of the $171 in new GAAP revenue, $71 million flowed down to GAAP net income.
- Tech platform contribution margin was 24% ex-technisys. It expects margins here to expand in 2023 for the first time in several years.
- Improving financial services contribution margin is DESPITE raising marketing spend by $13 million QoQ to attract deposits. Conversely, this margin line is still being hard hit by SoFi building current expected credit losses (CECL) in connection with its newer credit card business.
- SoFi’s adjusted EBITDA margin for 2022 was 9% vs. 2.7% in 2021.
3. Balance Sheet
- $2.2 billion in cash & equivalents.
- $12 billion in personal and student loans.
- $5.4 billion in total debt including $1.2 billion in convertible notes.
- Using 36% of its warehouse facility capacity vs. 35% QoQ.
- Stock comp fell to 16% of sales vs. 27.5% YoY.
- This is still being heavily impacted by equity awards in connection with going public & includes restricted stock units with strikes that aren’t remotely close to vesting but still count as stock comp. We’ve been consistently told that this will fall below 10% of revenue in 2024.
- Adjusted EBITDA dollars reached stock comp dollars for the first time in SoFi’s history with that expected to continue like it needs to.
- 2 straight quarters of tangible book value growth.
- Total deposits grew 46% QoQ to reach $7.1 billion vs. just $1 billion at the start of 2022. The pace has accelerated greatly from $100 million per week in new deposits earlier in 2022.
- 88% of these deposits are of the direct deposit variety.
“We have ample cash, excess liquidity and strong capital and leverage ratios.” — CFO Chris Lapointe