
SoFi is a one-stop-shop for financial services. It aims to provide consumers with excellent products for all major needs and events. It further aims to delight them to the point of customers never going anywhere else. That creates key cross-selling and acquisition cost benefits. It owns its tech stack, has no branches and possesses a bank charter, which gives it cost advantages vs. incumbents and fellow disruptors. It also sells its tech stack to customers like H&R Block and Robinhood.
1. Demand
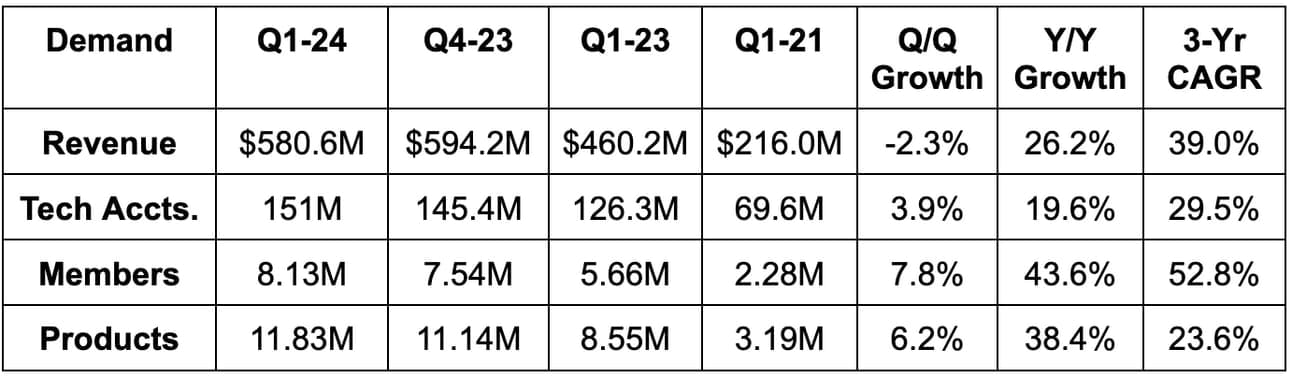
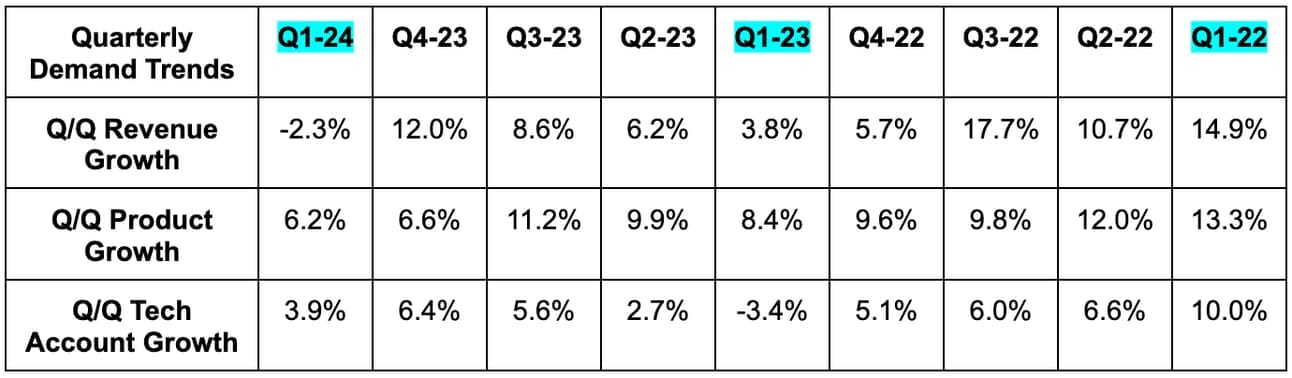
SoFi beat revenue estimates by 3.8% & beat guidance by 4.6%. Its 39.0% 3-year revenue CAGR compares to 48.3% last quarter and 34.8% 2 quarters ago.
2. Profitability & Margins
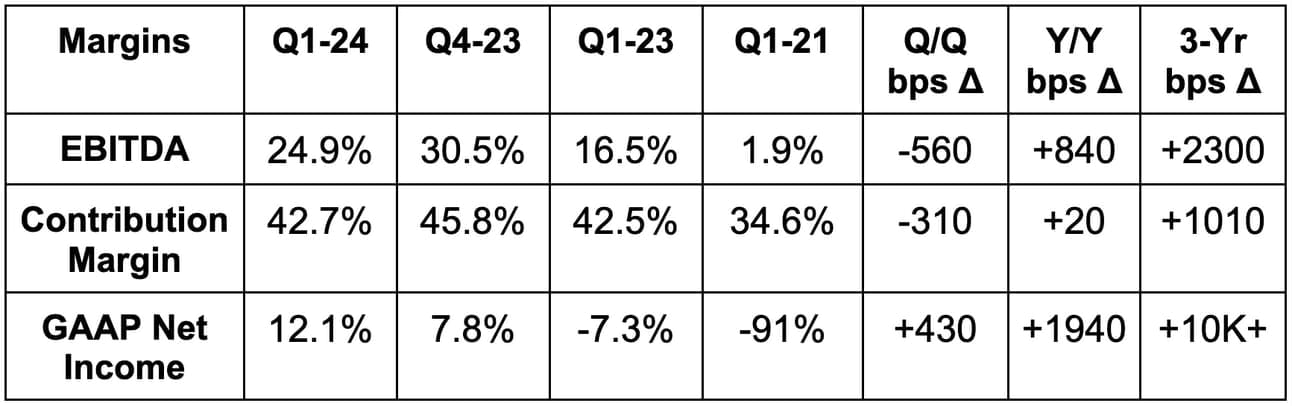
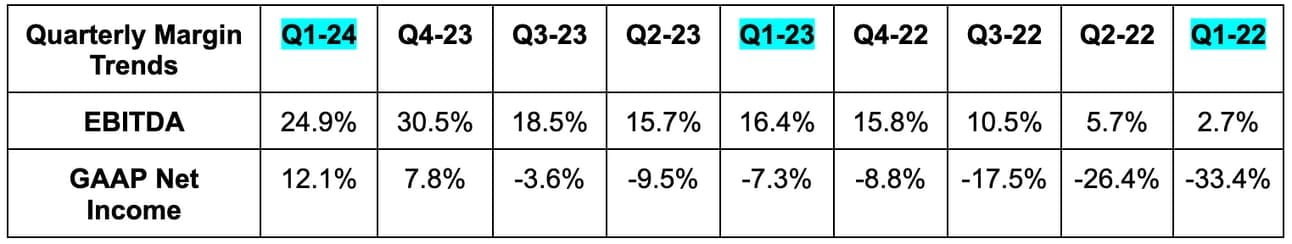
- Beat EBITDA estimates by 23.2% & beat guidance by 25.5%. Its incremental EBITDA margin for the quarter was 57%.
- Beat GAAP net income estimates & beat guidance sharply. This beat included a one-off benefit from repurchasing convertible notes at a discount as part of the recently completed capital market deals. Without this help, $28.7 million in GAAP net income more than doubled estimates and crushed $15 million guidance.
- Beat $0.01 GAAP EPS estimates by $0.01. With the dilution caused by the same capital market deals discussed above, they delivered no material boost to GAAP EPS.
- SoFi Bank (owned by SoFi Technologies) posted a 21% GAAP net income margin and an 11.7% return on tangible equity.
3. Balance Sheet
- $3.7 billion in cash & equivalents.
- $2.9 billion in debt.
- Share count spiked 12% Y/Y as expected via the capital market deals. As a reminder, the impact of those capital market deals is neutral to GAAP profit per share as the dilution is offset by more profits (via reductions in interest expense).
- Tangible book value per share is now $3.92.
- SoFi’s total capital ratio improved from 15.3% to 17.3% Q/Q due to those same aforementioned capital market deals. It does not plan to use this excess capital ratio leeway (regulatory minimum is 10.5%) in 2024 due to macro uncertainty and pessimism. That could quickly change if the backdrop were to brighten. It has $20 billion in annual origination capacity while staying comfortably over its capital ratio requirements.
4. Annual Guidance & Valuation
SoFi slightly raised its implied revenue guidance, which beat estimates by 1.3%. This still assumes -6.5% Y/Y lending growth and 20% Y/Y tech platform growth. That means the raise is coming from financial services. The capital market deals led to its tangible book value guidance rising from +$400 million Y/Y to +$900 million Y/Y. It reiterated adding at least 2.3 million members in 2024 for 30%+ growth.
From a profit point of view, it raised its annual EBITDA guide by 1.7%, which beat estimates by 3.4%. Finally, it boosted its $0.075 GAAP EPS guide by a penny, which beat estimates by $0.015. This is despite the 12% dilution because, again, the capital market deals were neutral to profit per share.
Quarterly guidance was light vs. analyst expectations across the board. Considering the annual raises, I don’t really care.
SoFi trades for 82x 2024 GAAP EPS with Y/Y EPS growth expected to compound at a triple digit clip through 2025.