

Read 25+ earnings reviews from this season here.
See my current portfolio & performance here.
Table of Contents
a. Demand
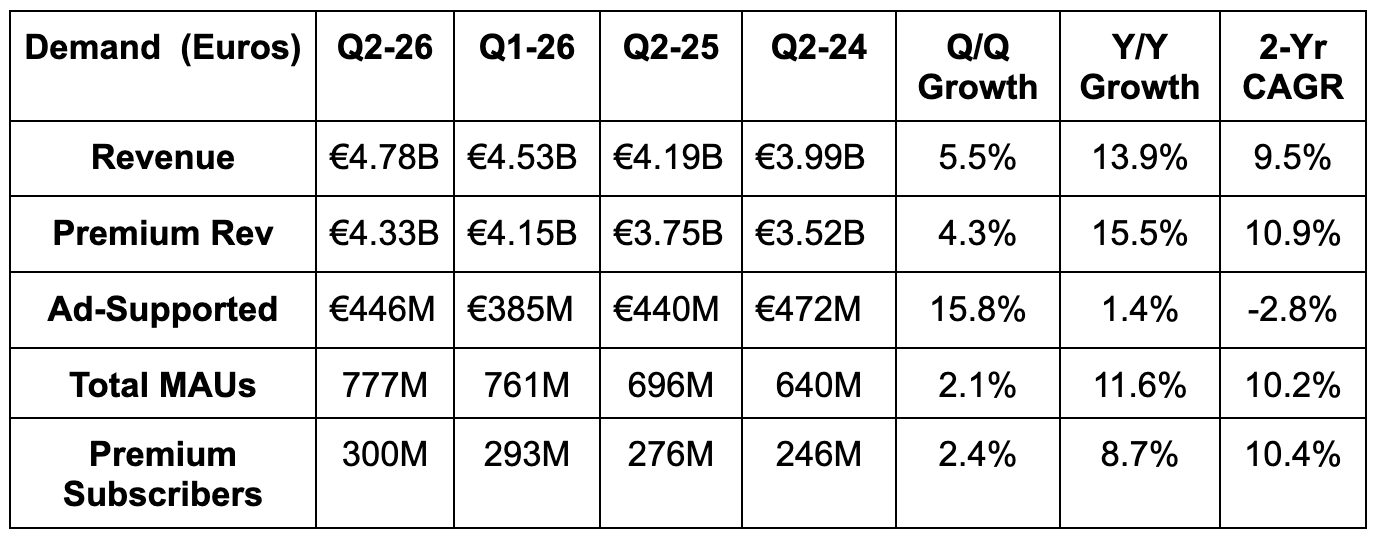
- Slightly missed revenue estimate & missed guide by 0.5%.
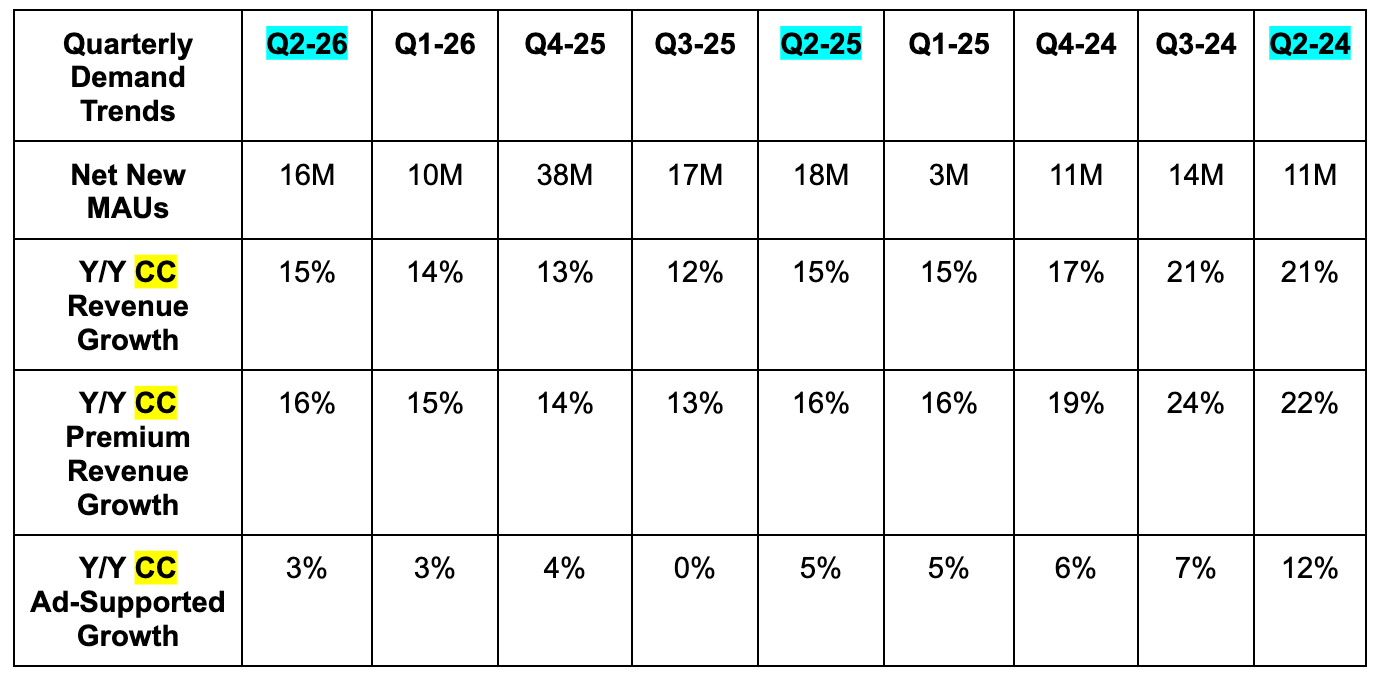
- The Foreign Exchange (FX) headwind was a few basis points larger than expected. Constant Currency (CC) growth was in line with expectations.
- Slightly missed monthly active user estimates & slightly missed guidance. More on the reasoning for this later.
- Slightly beat premium subscriber estimates & slightly beat guidance.
- Subscription revenue was driven by a mix of 9% subscriber growth and 7% revenue per user growth (price hikes).
b. Profits & Margins
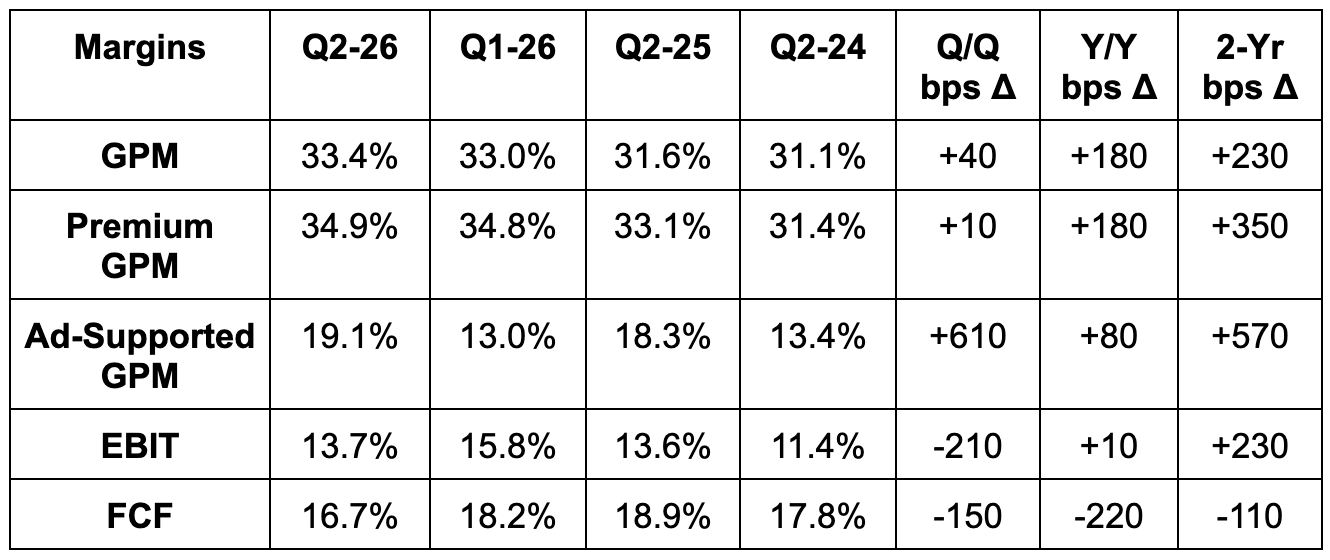
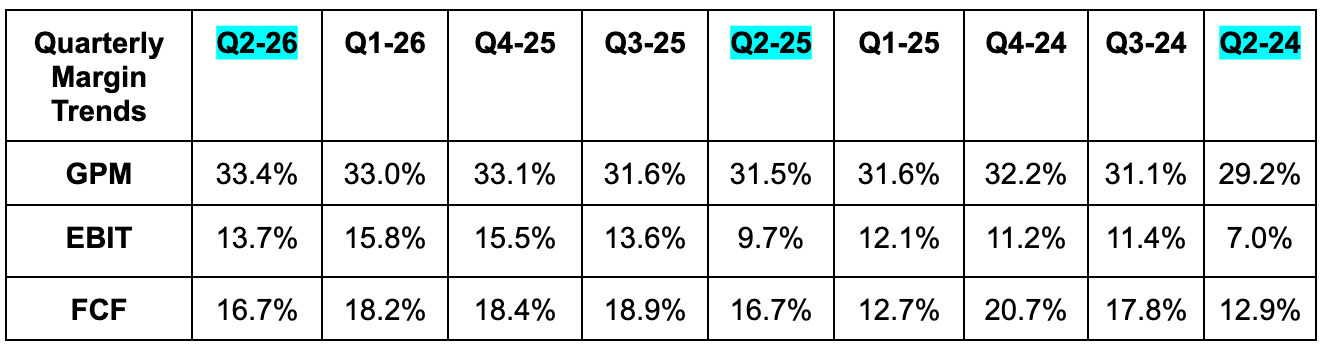
- Beat 33.1% GPM estimate by 30 bps & beat guide by 30 bps.
- The modest outperformance was thanks to shifts in growth spend timing and some tax favorability. They would have enjoyed Y/Y expansion across both major segments without this help, but it did extend the progress.
- Premium GPM improvement was thanks to strong revenue growth driving fixed cost leverage and audiobook and video podcast content expense favorability.
- Podcasting and the aforementioned tax favorability drove the ad-supported GPM improvement.
- Beat EBIT estimate by 3% & beat guidance by 4%.
- Payroll tax charges tied to equity compensation (social charges) were €9M lower than expected. Without this help, EBIT would have been 1.5% ahead of estimates.
- The combination of the temporary GPM help and the social charge favorability drove profit upside for the quarter. Certainly not the highest quality sources of beats, but beats nonetheless.
- The smaller degree of Y/Y EBIT leverage compared to GPM was due to a temporary surge in marketing and AI spending that is expected to continue during Q3 before normalizing in Q4 2026.
- Headcount growth is currently flat, so the rise in OpEx, as leadership pointed out, is purely variable cost-driven in nature. Their perceived ability to soon slow these expenses down should be very positive for leverage.
- Missed €2.75 EPS estimate by €0.14.
- Missed FCF estimate by 6.5%.
c. Balance Sheet
- €9.4B cash & equivalents.
- No debt.
- 1.7% Y/Y dilution.
- Buybacks are up 30% year-to-date.