
Table of Contents
a. Key Points
- Non-rewards member transactions grew in the USA for the first time in 4 years.
- They’ve already reached their drive-thru throughput goal.
- They’re confident that a margin recovery will follow the current demand recovery.
- They will offer multi-year financial targets at their investor day tomorrow.
b. Demand
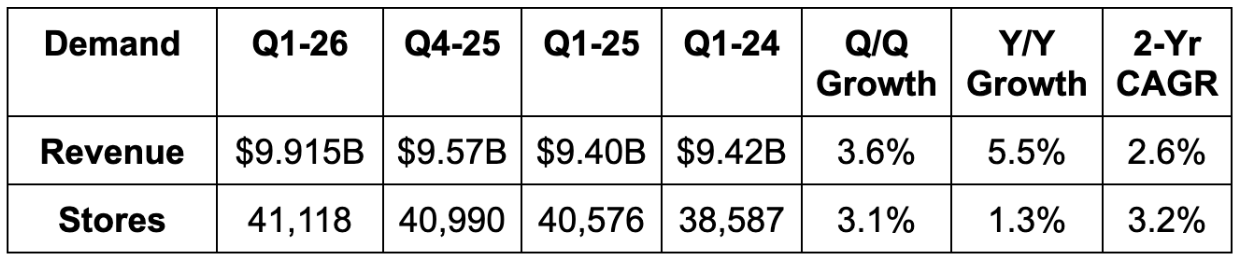
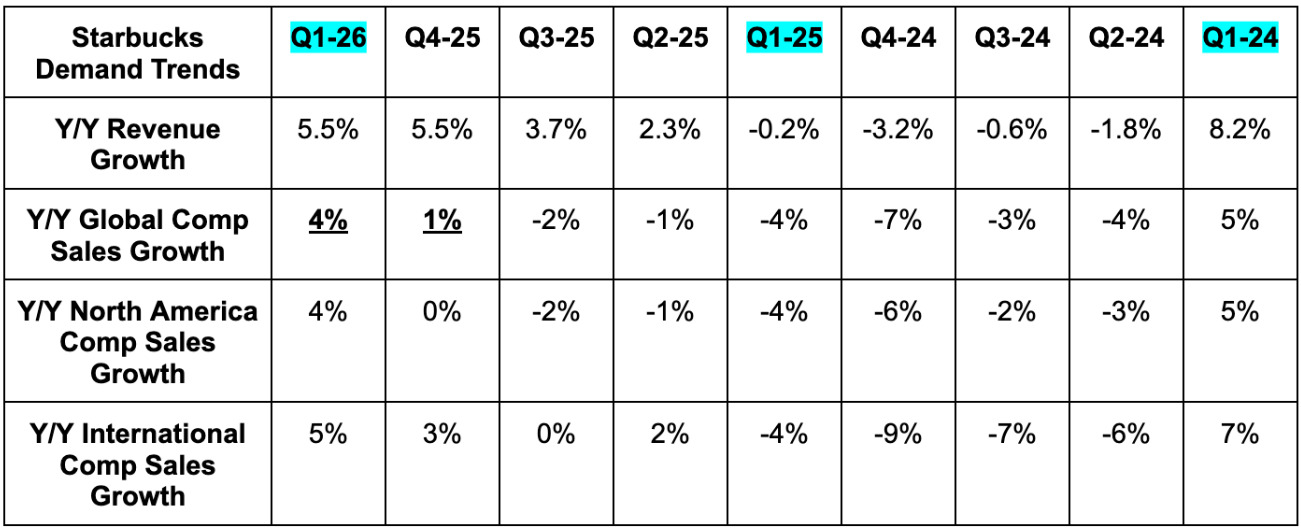
Starbucks beat revenue estimates by 2.7% and beat 2% global comp store sales (CSS) growth estimates by 2 points. 4% CSS growth in North America and the USA was better than 2% growth estimates for both. Importantly, USA growth only got 0.5 points of help from shuttering low-quality stores. The beat would have still been large without this help.
5% CSS growth internationally beat 2.5% growth estimates, with 7% China CSS growth comfortably beating 2.5% growth estimates. Strength was also driven by transaction volume, with ticket growth coming in as expected. This momentum is being driven by “more customers choosing Starbucks more often,” not taking more price. That’s a healthier and more structural source of growth.
Revenue growth was mostly driven by CSS growth, with 1% Y/Y store growth helping a bit too. In the USA, 4% CSS growth powered all of the 3% Y/Y revenue growth. Growth in the USA was weaker with their grocery and mall partners, but strong across campuses, hospitals and offices.
International revenue rose by 10% Y/Y thanks to strength in China (encouraging), Japan and the UK. CSS growth was positive in 9 of their 10 largest markets, as they opened their 500th store in India, entered 6 new LatAm markets and moved closer to their 1,000-store milestone in Mexico.
More Y/Y Comp Sales Growth Data:
- Within overall CSS:
- Transactions rose by 3% vs. 1% growth last quarter and -2% growth the quarter before.
- Ticket size rose by 1% vs. flat last quarter and a slight rise the quarter before.
- Within North American CSS:
- Transactions rose by 3% vs. -1% growth last quarter and -3% growth the quarter before.
- Ticket size rose by 2% vs. 1% growth last quarter and 1% growth the quarter before.
- In the USA, 4% CSS growth was via 3% transaction growth and 1% ticket growth. This compares to 0% CSS last quarter, which was driven by -1% transaction growth and 1% ticket growth. The quarter before, CSS growth was -2% via -4% transaction growth and 2% ticket growth. Much better.
- Within international CSS:
- Transactions rose by 3% vs. 6% growth last quarter and 1% growth the quarter before.
- Ticket size rose by 2% vs. -3% growth last quarter and -1% growth the quarter before.
- China CSS grew by 7% vs. 2% growth in each of the last 2 quarters.
- China transactions grew by 5% vs. 9% growth last quarter and 6% growth the quarter before.
- China ticket size grew by 2% vs. -7% growth last quarter and -4% growth the quarter before.