
In case you missed it:
- Nvidia & Cava Earnings Reviews
- Lemonade Earnings Review
- Coupang Earnings Review
- SoFi Earnings Review
- Netflix Earnings Review
- Nu Earnings Review
- Celsius Earnings Review
- Mercado Libre Earnings Review
- Amazon, Cloudflare and Disney Earnings Reviews
- Datadog Earnings Review
- Taiwan Semi Earnings Review
- Airbnb Earnings Review
- Uber Earnings Review
- Shopify & Chipotle Earnings Reviews
- Alphabet & AMD Earnings Reviews
- PayPal Earnings Review
- Palantir Earnings Review
- Meta, Tesla & Starbucks Earnings Reviews
- Microsoft & Apple Earnings Reviews
- ServiceNow Earnings Review (section 2)
- Spotify Earnings Review (section 3)
- The Trade Desk Earnings Review
- Hims Earnings Review
- Grab Earnings Review
- Palo Alto, DraftKings & Robinhood Earnings Reviews (sections 2, 3 & 4)
- Zscaler & On Running Earnings Reviews
- SentinelOne, Oracle & Block Earnings Reviews
- Broadcom Earnings Review (section 1)
- Adobe Earnings Review (section 1)
Table of Contents
- a. Key Points
- b. Demand
- c. Profits & Margins
- d. Balance Sheet
- e. Guidance & Valuation
- f. Call & Release
- g. Take
a. Key Points
- Solid quarter.
- Slightly underwhelming guidance.
- New inventory is working, but macro is fragile – just like for the rest of retail/apparel.
Please note that Lululemon raised quarterly guidance in January with only a few weeks left in the period.
b. Demand
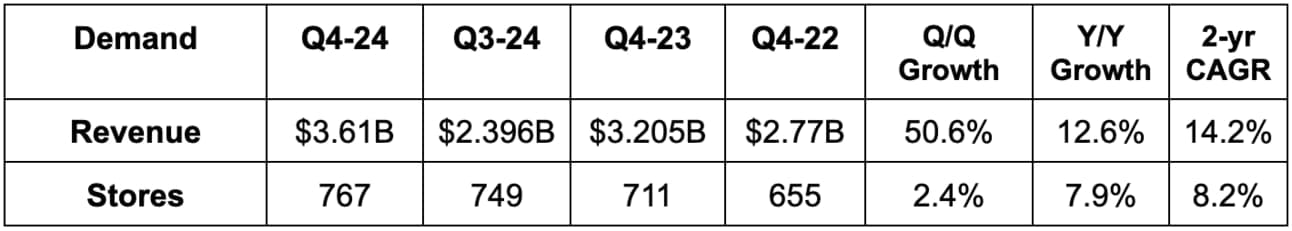
- Lululemon beat revenue estimates by 0.8% and beat its updated guidance by 1.1%.
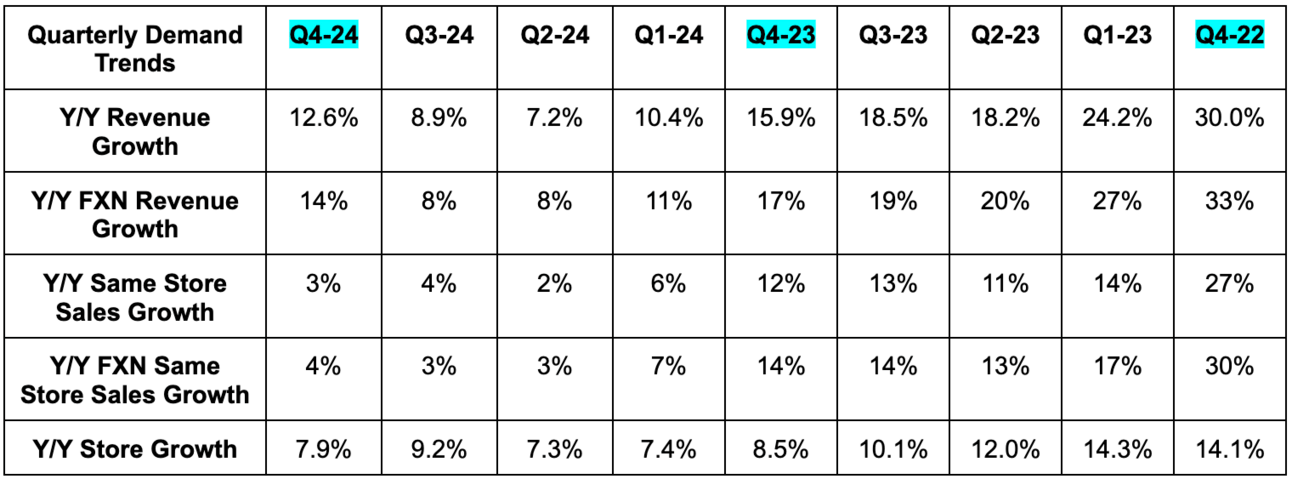
- Overall revenue growth excluding the extra week in the quarter was 8% Y/Y and 9% on a foreign exchange neutral (FXN) basis.
- In the Americas, excluding the extra week in the quarter, revenue rose by 2% Y/Y. FXN revenue rose by 3% Y/Y vs. 2% FXN Y/Y growth last quarter.
- Comparable store sales were flat Y/Y in the Americas.
- USA revenue rose by 1% Y/Y vs. 0% Y/Y growth last quarter; Canadian revenue rose by 11% Y/Y.
- In China, revenue rose by 38% excluding the extra week. FXN revenue rose by 39% Y/Y vs. 36% FXN Y/Y growth last quarter.
- Comparable store sales rose 26% Y/Y (27% FXN).
- In the Rest of World (RoW) revenue rose by 30% excluding the extra week. FXN revenue rose by 33% Y/Y vs. 23% FXN Y/Y growth last quarter.
- Comparable store sales rose by 14% (17% FXN).
- Men’s revenue rose by 12% Y/Y vs. 9% Y/Y last quarter; women’s revenue rose by 6% Y/Y vs. 8% Y/Y growth last quarter; accessories & other revenue rose by 9% Y/Y vs. 8% Y/Y growth last quarter.
c. Profits & Margins
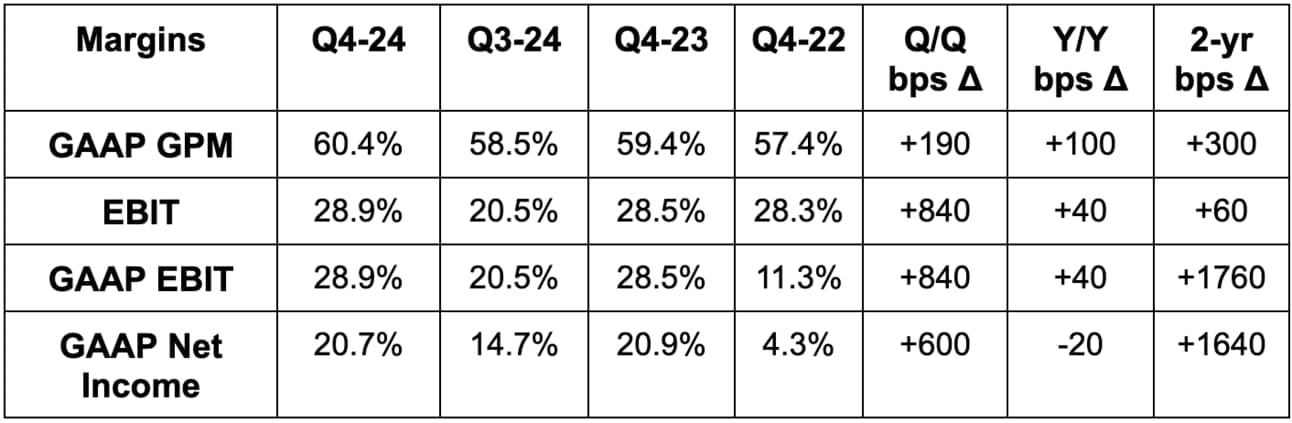
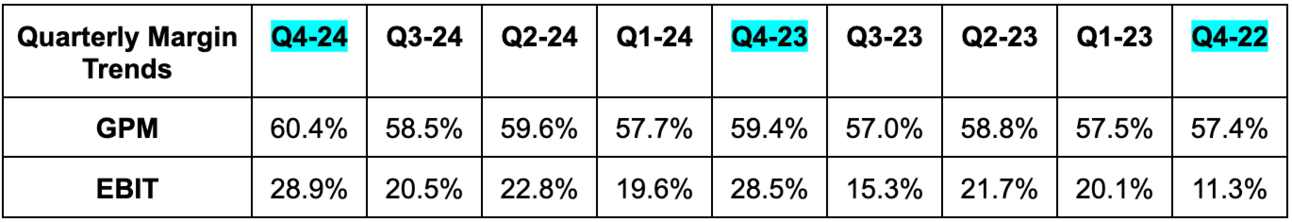
- Beat 59.7% GPM estimates & beat identical guidance by 70 basis points (bps; 1 basis point = 0.01%) each.
- GPM expansion was based on 160 bps of product margin expansion thanks to lower product costs, lower markdowns and lower inventory shrink (less theft & defects). That was offset by a 30 bps FX headwind and higher freight costs.
- Beat EBIT estimates by 4.2% & beat guidance by 4.4%.
- Selling, General and Administrative (SG&A) costs were 31.5% of revenue vs. 30.9% Y/Y. The deleveraging was due to corporate items, as well as depreciation and amortization (the effect of fulfillment center investments).
- Beat $5.87 EPS estimates by $0.27 & beat guidance by $0.31.
d. Balance Sheet
- $2 billion in cash & equivalents.
- $394 million in untapped credit revolver capacity.
- No traditional debt.
- Inventory rose 9% Y/Y.
- Diluted share count fell by 3.7% Y/Y. It has $1.3 billion left on its current buyback program.