

Discover more from Stock Market Nerd
News of the Week (November 15 - 19)
Sea Limited; Nubank; Palo Alto; PayPal; SoFi; Uber; Amazon; Progyny; Disney; Macro; Portfolio
Today’s Piece is Powered by My Friends at BBAE:
1. Sea Limited (SE) – Earnings Review
a. Demand
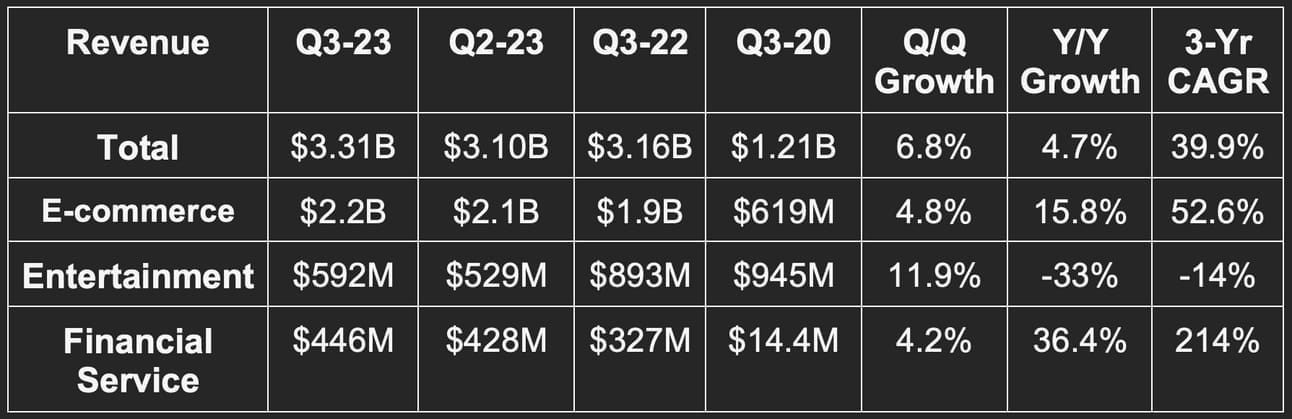
Sea Limited beat revenue estimates by 3.1%. .
Please note that the financial services 3-yr CAGR is comping vs. a base period in which revenue was close to $0. This makes the comp overly easy and not important.
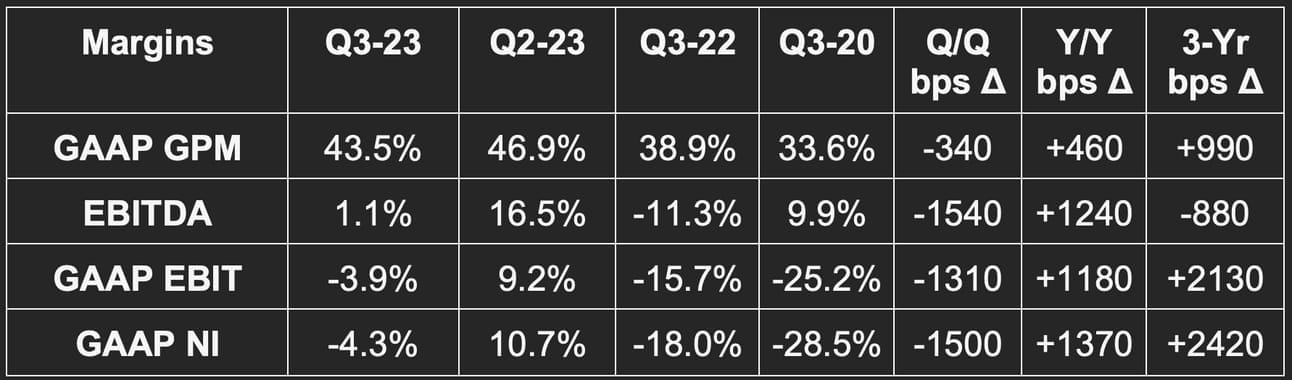
b. Margins
Missed $180 million EBITDA estimates by $145 million.
Missed -$55 million GAAP EBIT estimates by $72 million.
Missed $0.00 GAAP earnings per share (EPS) estimates by $0.26.
Missed 44.5% GAAP gross profit margin (GPM) estimates by 100 basis points (bps; 1 bps = 0.01%).
Most of the Y/Y leverage was from 30%+ declines in general/administrative and research/development costs.
c. Balance Sheet
$6 billion in cash & equivalents. Including other investments & restricted cash, it has $7.9 billion in total liquidity.
$800 million in debt.
$3.3 billion in convertible notes.
Share count rose by 1.4% Y/Y. Diluted share count rose by 7.0% Y/Y.
d. Call & Release Highlights
The Balancing Act:
Earlier in the year, Sea Limited pivoted in its operational approach. It went from a philosophy that predominantly sought more revenue to one that balanced future growth with current profit. The macro backdrop changed, and so Sea Limited changed too.
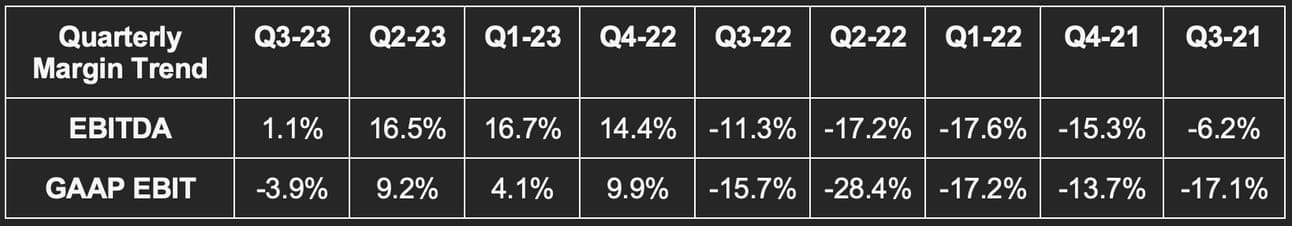
It fixated on “self-sufficiency” and funding operations without external cash raises. It strengthened its balance sheet and streamlined operations significantly. The recent explosion in margins is the result. You’ll notice, however, that the sequential margin trend turned materially negative this quarter. This is intentional. With SE now on firmer footing, it’s ready to re-accelerate growth spend. It will not return to its 2020-2021 spending philosophy, but it will lean back in a bit.
The catch 22 is that investors want profits, and massive e-commerce footprints need massive scale to generate those profits. So? It’s pushing forward with scaling its under-penetrated markets, but with more fiscal responsibility than in the past. Balance. As an aside, live streaming was called out as a significant focus area for supporting future growth.
E-Commerce:
Core marketplace revenue rose 31.7% Y/Y compared to 37.6% Y/Y growth last quarter. Value added services revenue rose by 4.2% Y/Y compared to 11.3% Y/Y growth last quarter. Interestingly, its rightsizing of logistics is negatively impacting value added service growth. Gross orders rose by 13.2% Y/Y to foster 5.1% Y/Y gross merchandise value growth. It believes that it took more market share in all of its geographies this quarter.
EBITDA margin for the segment was about -16% vs. roughly 7% Q/Q and -26% Y/Y. This is the effect of its re-accelerating growth spend. I’d love to see the coinciding margin contraction complemented by accelerating growth, but it’s likely too early to expect that.
Part of its recent shift to a profit-focused strategy is based on competition. Per the team, new entrants are intensifying that competition. It wants to support the e-commerce business with needed investments to ensure it maintains a strong category position. It seems that SE can support these investments while getting more efficient simultaneously. For evidence, cost per order fell 17% Y/Y.
Live Streaming:
Within e-commerce, it’s pushing heavily into live content streaming to juice market engagement. Shopee live, the streaming platform, is greatly expanding creator collaborations. This is already working in Indonesia where 20% of its daily platform users are watching live streaming. Overall, average daily streamers, hours streamed, and daily sessions rose by 300% from June to October.
Logistics Investments:
SE continues to build more sort centers and enhance its last-mile delivery coverage across all markets. Specifically, the firm is enjoying strong growth in Brazil with improving unit economics there as well. It continues to build out its footprint in that region and those investments continue to bear fruit.
Digital Entertainment:
Quarterly active users and payers continued to fall Q/Q. Payer ratio also continued to fall.
Garena bookings specifically rose Q/Q with quarterly active users and EBITDA stable Q/Q.
Free Fire was the most downloaded game in Q3 across the globe per Sensor Tower. The firm upgraded Free Fire in an attempt to make it more social.
EBITDA was 52.2% of bookings vs. 54% Q/Q.
Financial Services:
Its credit portfolio overall rose 5% Q/Q to $2.9 billion. This includes $500 million in loans from other financial institutions through its platform. The credit book “stayed healthy” per the team. Specifically, the rate of non-performing loans (NPL) 90+ days due improved sequentially to 1.6% of gross receivables. Rate of loans 30+ days past due also improved Q/Q. Finally, the firm is actively expanding funding supply sources to lower overall cost of capital. Its own deposits and asset backed lending deals with 3rd parties are the two main examples.
e. Take
Fine quarter. This company remains in “prove it” mode. The cost cutting to prop up margins is nice, but it will need to reignite spending (like it’s starting to do) to juice demand. That spending must result in growth rather than another instance of costs spiraling out of control. With ramping competition across all of its markets, it’s unclear how sticky its business truly is. Can they keep cutting costs while taking share, re-accelerating demand and expanding margins? I’m not sure. That’s what needs to happen for this to work.
Step one was right-sizing the cost base. To the firm’s credit, it completed this step very quickly. Now onto step 2.
2. Nubank (NU) – Earnings Review
NuBank is a large & rapidly growing digital bank in Latin America.
a. Demand
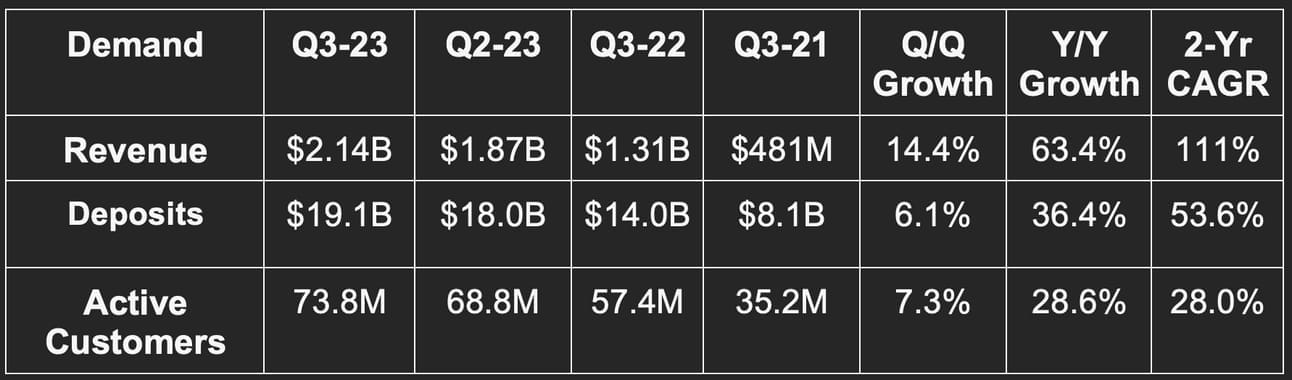
Revenue was 4.4% better than consensus. Its 111% 2-year revenue CAGR compares to 136% as of last quarter and 157% as of 2 quarters ago. Revenue rose by 53% Y/Y on a foreign exchange neutral (FXN) basis.
b. Margins
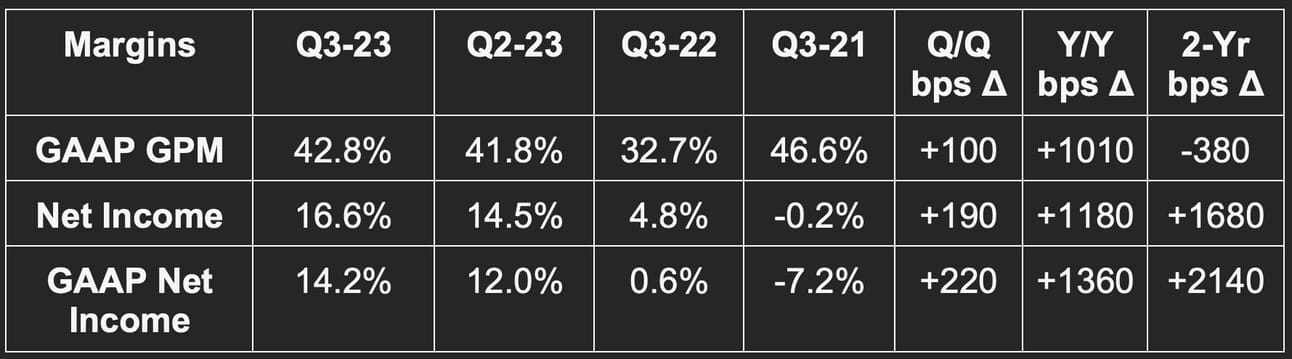
Beat net income estimates by 18.4%.
Beat GAAP net income estimates by 22.7%.
Beat 40.5% GAAP GPM estimates by 230 bps.
Please note that a lower credit loss allowance expense is a good thing.
“We anticipate continued gains in operating leverage as we continue to scale… we believe there is potential for increased future leverage as our Mexican and Colombian businesses, which are currently operating with losses, reach their inflection points.” – CFO Guilherme Lago
c. Balance Sheet
$2.3 billion in excess cash.
$1.1 billion in borrowings and financing vs. $585 million Y/Y.
Loan to Deposit Ratio (LDR) of 35% vs. 35% Q/Q & 25% Y/Y. The team sees room for this to rise further to continue lowering the cost of funding loans.
d. Call & Release Highlights
Customer & Product Growth:
Nu is now the 5th largest financial institution in Latin America by customer count and the 4th largest in Brazil. Rapid customer growth continues to coincide with rising engagement. Its customer activity rate set a new record high at 82.8% vs. 82.2% Q/Q and 81.6% Y/Y. Customers using Nu for primary banking services rose from 58% to 59% Q/Q as well. Impressively, it has 51% of Brazil’s entire population as customers vs. 49% Q/Q. Impressive.
Revenue per active member rose to $10.00 vs. $9.30 Q/Q and $7.90 Y/Y. Products per member on average surpassed 4.0 for the first time. Per the team, cross-selling is a main driver of its “extraordinary pace of customer growth.” It continues to enjoy a modest $7 customer acquisition cost because of this cross-selling. That reality allows it to invest more heavily in customer growth. It’s a key competitive edge. Specifically, its cost to serve users is 85% lower than incumbents.
Broader product breadth also means better access to consumer data which it can use to sharpen underwriting and boost approval rates. This quarter, it added payroll lending to further fortify this equation. It will add a new savings account in Colombia this year.
“We believe $7 is one of the lowest customer acquisition costs among consumer fintechs and banks on a global scale.” – CFO Guilherme Lago
Demand Metrics:
23% Y/Y credit card customer growth to reach 38.9 million
100%+ Y/Y NuInvest customer growth to reach 12.4 million
32% Y/Y bank account growth to reach 64.7 million
52% Y/Y loan customer growth to reach 7.3 million.
Personal loan originations rose 93% Y/Y.
54% Y/Y small merchant account growth to reach 2 million.
Overall purchase volume rose by 36.8% Y/Y (28% FXN) to reach $29 billion.
In Brazil, its growth is outpacing growth of the 5 largest banks there… combined.
Market share across Brazil, Mexico and Colombia continued to rise at a rapid clip. In Mexico specifically, its Cuenta Nu savings product was credited for re-accelerating user growth as the product gained rapid adoption. Cuenta Nu already has 2.4 million accounts and $150 million in deposits early on. Per CFO Guilherme Lago on the call, this success will lead to it “further expanding the deposit franchise model across Latin America.”
Deposits & Credit Portfolio Growth:
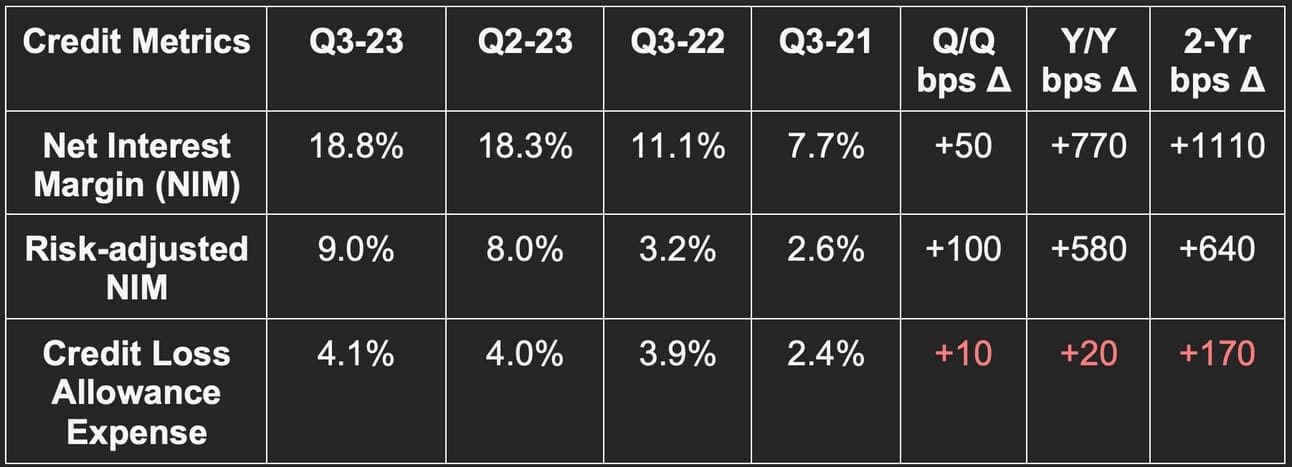
The rapid 36% Y/Y deposit growth was 26% Y/Y on an FXN basis. This continued momentum in building deposits is directly helping its cost of funding. This quarter, that cost sat at 80% of the Brazilian Interbank Deposit Rate (CDI) vs. 95% Y/Y. 80% is not a floor.
Its credit card and lending portfolio rose by 58.7% Y/Y (48% Y/Y FXN growth) to reach $15.4 billion. Importantly, NuBank’s shift to interest earning assets within this base continued. 21% of its total portfolio is now within the interest earning bucket vs. 10% Y/Y. This is feeding net interest income and is positively supporting its overall results. The trend is expected to continue.
NuBank’s new secured credit product is off to a good start as well. This product is secured by a customer’s federally-mandated savings account in Brazil. Thanks to the entirely digital nature of this offering, time to fund the loan and input costs are best in class.
Credit Health:
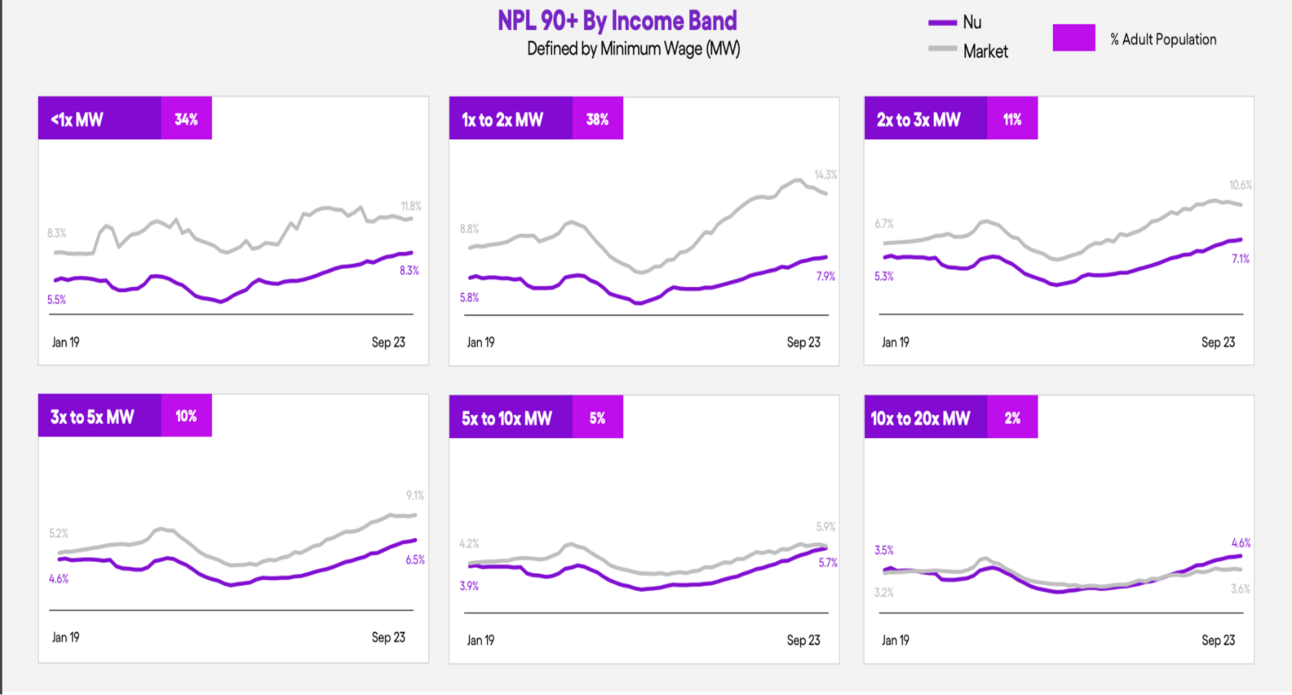
15-90 day non-performing loan (NPL) rate was stable Y/Y at 4.2%. The 4.2% result improved slightly Q/Q vs. 4.3%. This is good news considering the metric is a leading indicator of 90+ day NPL rates. Still, the 90+ day NPL rate continued to worsen. It rose from 4.7% to 6.1% Y/Y and vs. 5.9% Q/Q. NuBank blamed this on the buildup of newer originations continuing to mature. This is leading to a “stacking up” of early delinquencies. All in all, delinquency rates for the firm are about 15% lower than Brazilian benchmarks. It continues to outperform in its underwriting role. This is true across 98% of its addressable market (and the 98% that are most difficult to underwrite):
“Our personal loan cohorts continue to exhibit expected behavior. This is enabling us to continue to increase originations… we see an opportunity to expand credit with attractive returns and robust resilience going forward. This may lead to higher delinquency rates, which we expect to be more than offset by additional revenue.” – CFO Guilherme Lago
Margins & Ratios:
Cost of financial and transactional services is similar to gross margin for a non-bank. It deducts costs directly tied to the firm’s products. This margin line sharply improved from 32.7% to 42.8% Y/Y. From an operating expense (OpEx) point of view, general/administrative costs are driving the firm’s rapid leverage. This cost bucket was flat Y/Y while demand torridly grew.
Nu’s Capital Adequacy Ratio (important capital ratio in its markets) sits at 11.0% and is well above its 6.75% minimum. This gives it a lot more room to use low-cost funding sources like deposits to fund credit.
Trailing 12 month return on equity (ROE) (using adjusted net income) was 25% vs. 19% Q/Q and 8% Y/Y.
e. Take
Another impressive quarter from NuBank. The 90+ NPL rate is a bit concerning, but the cohort build-up reasoning does make sense. Aside from that, there’s absolutely nothing to pick at here. Only growth, market share gains, rapid leverage and successful product launches to praise. Its competitive advantages are clear. Its costs to acquire customers and service them are comparatively low; its 35% efficiency ratio is comparatively excellent and improving; its funding supply is healthy and cheap; its underwriting is outperforming. MercadoLibre is the highest quality Latin American firm that I cover, but Nu is quickly entering that conversation. I added NuBank to my short watchlist this week.
Is BBAE the best investing platform for long term investors? Is the sky blue?
Looking for a better investment platform? Enter BBAE. The product speaks for itself. The Town Square copy trading tool allows you to emulate Wall Street’s finest. Its curated stock themes (under BBAE Discover) inspire new ideas, and its valuable educational lessons guide you through key concepts. Highly touted technical and fundamental research tools paired with an AI-powered service to track SEC filings serve as delicious icing on the cake.
BBAE is the broker dedicated to giving investors what matters to us. No gimmicks, no charms, no confetti, and never any pressure to trade. This is THE broker for long-term investors. Oh… and it’s offering generous deposit bonuses of up to $400.
Need another reason to make the switch now? BBAE just launched three exclusive smart beta portfolios. These are crafted by industry leader MarketGrader and based on indexes that consistently outperform benchmarks across tests. Check it out here. You’ll be glad you did.
3. Palo Alto (PANW) – Earnings Review
Palo Alto provides network, cloud and endpoint security services.
a. Demand
Missed its billings guidance by 2%,
Beat analyst revenue estimates by 2.2% and beat its own revenue guidance by 2.5%.
Its 25.7% 3-year revenue CAGR compares to a 27.1% 3-year revenue CAGR as of last quarter and a 25.6% CAGR as of two quarters ago.
83% of total revenue is recurring vs. 77% Y/Y.
Next generation security (NGS) annual recurring revenue (ARR) rose by 53% Y/Y to surpass $3 billion.
b. Margins
The firm beat $0.42 GAAP earnings per share (EPS) estimates by $0.14. It also beat $1.16 EPS estimates and its same EPS guidance by $0.22. EPS rose by 66% Y/Y as Palo Alto enjoyed Y/Y operating leverage across all three major cost buckets.
Please note that PANW’s Q1 is seasonally strong for free cash flow (FCF) generation. This occurs as strong fiscal year Q4 bookings lead to Q1 collections being higher than any other quarter.
c. Fiscal Year (FY) 2024 Guidance
Lowered its annual billings guidance by 1.8%.
Reiterated its revenue guidance which slightly missed revenue estimates.
Raised its $5.34 EPS estimate to $5.46.
Reiterated 37.5% adjusted FCF margins for the year.
d. Balance Sheet
$3.9 billion in cash & equivalents.
$3.0 billion in long term investments.
$2.0 billion in senior convertible notes.
Basic share count rose by 3.4% Y/Y. Stock comp fell as a percent of revenue and the firm expects this to continue. Considering the stage of maturity for PANW, I’d like to see that happen. It’s diluting shareholders at a faster rate than rapidly growing CrowdStrike.
e. Call & Release Highlights
Remaining Performance Obligations (RPO) vs. Billings:
RPO measures total revenue under contract, but that has not yet been recognized. Billings measure invoices/bills sent during a time period.
Much attention on the call was paid to the billings miss and billings guidance reduction. It blamed this miss on “cost of money” pushing clients to get more aggressive in pursuit of special deals and promotions. Given the strength of PANW’s balance sheet and cash flows, it has been working with customers through these uncertain times. In some cases, more customers are looking for better rates on multi-year deals. They’re also seeking out financing through Palo Alto and others to diminish initial cost outlays. In other cases, customers are looking to move from multi-year deals to annual billing in order to reduce upfront costs. All of this means stable revenue generation over the full course of contracts, continued strong pipeline generation and stable RPO. For evidence, RPO rose by 26% Y/Y. Conversely, this phenomenon means fewer near-term billings.
“We feel like we have de-risked ourselves in terms of future billings guidance… We are not concerned with demand or ability to execute. Billings is a pure consequence of payment conversations with customers.” – CEO Nikesh Arora
Product Revenue:
Product and hardware revenue trends have normalized for the firm. Supply chain issues are resolved, “backlog is being shipped” and performance is reverting to pre-pandemic results. This won’t mean explosive growth ahead, as this segment is a more legacy/mature area. Still, it did lead to a sharp upward spike in gross margins which rose from 63.6% to 77.3%.
Customer Wins:
$25 million expansion deal with the federal government for its endpoint and cloud products.
$18 million cloud deal to consume “multiple modules across the suite.”
$15 million add-on with an educational organization for more endpoint and cloud security tools. It’s already a network security client.
$28 million contract with a “Nation State” for its secure access service edge (SASE) and its extended security intelligence and automation management (XSIAM) (endpoint). More on these acronyms later.
56% of Global 2,000 works with Palo Alto.
Cloud Security (Prisma):
Palo Alto debuted a new cloud product called Darwin. This gives a view across all cloud apps to “help customers understand risks with deeper context and to overlay active attacks in near real time.” It offers “full coverage from source code to the cloud.” It will also buy a firm called Dig Security (for $235 million in cash) to help identify and protect sensitive assets in public cloud environments.
Endpoint Security (Cortex):
Cortex’s customer count rose 25% Y/Y to reach 5,300. Cortex’s Extended Detection and Response (XDR) tool was the only to achieve 100% protection and detection in MITRE’s most recent test. Its Extended Security, Orchestration, Automation and Response (XSOAR) and Extended Security Intelligence and Automation Management (XSIAM) products were named leaders by independent third parties. XSIAM also landed its first 8 figure expansion deal. The newer product has a $1 billion backlog which rose 100% Q/Q. PANW just launched its latest iteration of its XSIAM product this quarter to a warm customer reception. The launch includes a “bring your own AI tool.” That allows 3rd party developers to more freely access and leverage models from within the secure PANW environment.
Endpoint security companies LOVE to confuse us with acronyms. Here’s what these acronyms actually mean:
XDR is an overarching threat detection and response tool. It uses 3rd party data sources on top of PANW’s 1st party security data to uplift endpoint security beyond solely the endpoint.
XSOAR automates the remediation work needed to resolve a breach or vulnerability.
XSIAM collects, organizes and derives patterns/meaning from security events.
Network Security (Strata):
The move from legacy technologies like fire walls to zero trust architecture continues. As a reminder, zero trust means what it sounds like: zero trust. It prevents irresponsible access and permissions from being abused. With zero trust, a bad actor cannot penetrate the most vulnerable part of a digital ecosystem and move freely within it thereafter. zero trust ensures consistent and complex validation of these permissions at every turn.
PANW debuted a new operating system (PAN-OS 11.1) within Strata Cloud Manager this quarter. The tool “unifies the management of all 3 form factors (network, cloud, endpoint) in a single pane of glass.” This is its push to become more of a unified platform play like CrowdStrike. It has all of the product breadth to do this; now, it’s just about integrating them in a more cohesive fashion. Customers of all 3 form factors rose 34% Y/Y with 64% of its 100 largest using all 3 vs. 53% Y/Y. These “platform customers” boast 15x spend rates vs. single product users.
SASE stands for Secure Access Service Edge. It combines network security tools to extend protection. It prevents unauthorized access to data, abuse of networks by bad actors (like phishing attacks to overwhelm networks with traffic) and broad visibility into health, hygiene and performance of a network. This is a key place (among several) where network and cloud security tie closely together. Palo Alto’s SASE product enjoyed 60% Y/Y growth and presence in 35% of its $5 million+ network deals vs. 10% Y/Y.
Within the SASE realm, it’s also buying a company called Talon Cyber Security (for $435 million). This will allow it to add unmanaged devices from independent contractors/employees to its coverage wing. This will closely tie into PANW’s cloud access tools (called Prisma Access).
Quick Note on Generative AI:
We can’t get through a tech report without discussing Gen AI. I’m sorry, I don’t make the rules (ok maybe I do). In this case, GenAI is further accelerating demand for services like PANW’s. Why? It lowers the sophistication barrier to conducting complex ransomware attacks. Hackers no longer need to be experts, they just need to buy a piece of software to structure the hack for them. This diminished bad actor friction is an unfortunate demand tailwind here.
f. Take
We can’t call this a perfect quarter with the billings miss. Still, I think we can call this a positive quarter given all of the other data.
The billings miss makes all the sense in the world. We live in a world where minimizing near-term costs is a top priority for many firms. Understanding this, the current quarter revenue and overall RPO are likely better demand signals here for now. The first focuses on actual collections from services conducted. The second focuses on overall value of contracts signed. If overall demand were suffering and deals were shrinking instead of the structure and timing of deals changing, RPO would suffer too. It isn’t. Furthermore, the reduced billings guidance amid reiterated revenue provides more evidence for this being the actual reasoning.
I think it’s important to note here that I don’t own shares of PANW. I own shares of a direct competitor in CrowdStrike (CRWD). Regardless, I will defend any company when it deserves defending (not just holdings) and vice versa (including holdings). My goal is not to skew your thinking or convince you of anything. It’s to share my research and explain my findings.
4. PayPal (PYPL) – Chriss’s Shake Up
New CEO Alex Chriss is shaking up the structure of PayPal. He’s driving more reporting transparency, more obvious segment organization and more focus. To that I say thank you. The 3 newly formed groups will be Consumer, Small Business and Large Enterprise. Consumer and Small Business will both focus on unifying the maze of disparate tools that PayPal provides to their respective stakeholders. The large enterprise segment will clearly also focus on product excellence, but with an added emphasis on margin expansion within Braintree.
As part of the news, PayPal also made a series of executive team announcements. Isabel Cruz will be the firm’s new Chief People Officer and will lead its global real estate strategy. She comes from Walmart where she was a Senior VP (SVP) and “People Leader” for its Tech, Services and Corporate teams (30,000 people). Before that, she spent 20 years at General Electric climbing the ranks. Importantly, Kausik Rajgopal, whom she will replace, is remaining with PayPal as its new Executive VP (EVP) of Strategy, Corporate Development and Partnerships. Always good when executives from the old team (who are wanted) decide to stay through leadership changes.
Michelle Gill was named the new EVP and General Manager of the Small Business segment. Gill previously worked with Chriss at Intuit as the SVP of QuickBooks and its Money Platform. Before that, she was EVP of Consumer Lending and Capital Markets at SoFI. Per the release, she was a driving force behind SoFi reorganizing its balance sheet to power more lending growth “despite regulatory headwinds.” Unsurprisingly, she was with Goldman Sachs (with SoFi CEO Anthony Noto) for 14 years before that as its co-lead of Structured Financing.
Diego Scotti will be the new EVP and General Manager of the Consumer Group. He comes from Verizon where he was the Chief Marketing Officer (CMO). He held “top marketing roles” at American Express before that. Finally, current PayPal employee Frank Keller was promoted to SVP of the large enterprise segment.
The new hires boast impressive resumes and the retained talent points to Chriss jumpstarting a positive culture at PayPal. Is this massive news and an “all clear” to restart adding to my position? Not yet. But this is all positive.
5. SoFi Technologies (SOFI) – CFO Chat
CFO Chris Lapointe gave the most valuable investor conference interview I’ve heard in a while. It was jam-packed with new information. Here, I’ll cover all of the important highlights. There were a lot of them.
On Why Net Interest Margin (NIM) Keeps Expanding:
SoFi mainly uses warehouse credit and deposits to fund loans. It pays 4.6% cost of capital on most of these deposits, and somewhere around 6% for warehouse debt. Despite paying more for deposits over the last year, its net interest margin keeps rising. How?
It has raised its weighted coupon (average yield paid by borrowers) at a faster clip than benchmark rates have risen. This unique pricing power is a byproduct of how affluent SoFi’s borrower is and how strict its underwriting is (only approves 25% of borrowers). Secondly, its cost of deposits (via higher savings APYs) has risen more slowly than the upward movement in rates. Finally, it continues to shift from warehouse-funded loans to deposit-funded loans.
Deposits now fund 65% of its originations with that expected to rise to 90% in the coming years. Again, this mix shift directly lowers cost of capital. Importantly, its credit metrics also remain in very healthy shape. Loss ratios remain below 2019 levels and below what’s assumed in its credit valuation markings. It expects this outperformance to normalize a bit, but still continue. Strong repayment levels help support NIM maintenance while all of these other tailwinds rage on. Given that dynamic, we’re left with its NIM now pushing 6%.
Capital Market Deals:
Much has been made recently on SoFi’s gain-on-sale margins for capital market loan sales. Critics complain that much of the premium embedded in this margin is coming from capitalized service fees rather than the actual remaining principal. I explained last week why this was entirely noise and not concerning. Still, I know most of you would rather hear it directly from a firm’s CFO and not just me. Luckily, Lapointe reiterated pretty much all of what I said.
He took us through a SoFi history lesson in which capital market deals occasionally yet consistently included gain on sale contribution from this same servicing item. This is not new. It has routinely capitalized the present value of future servicing revenue (called a “servicing strip”) to allow part of the premium incurred by capital market participants to be paid over time. This lowers up-front payment and makes SoFi’s credit deals more attractive amid poor macro like we have today. But why does SoFi make this concession to close the sales? Because it wants to. The concession is being made in exchange for MORE future value derived from the loan pool in question… not less.
SoFi’s confidence in its balance sheet flexibility and credit book health make this an easy decision. These two items will enable the firm to continue “flexibly structuring deals” to “meet buyers where they are.” This, along with the ultra-prime nature of its assets, is how it continues to find so much capital market demand at favorable margins. Most recently, its announced $375 million BlackRock asset-backed securitization (ABS) deal closed at a 105% gain on sale margin; its newest $100 million whole loan sale also closed at a favorable 105.1% gain on sale margin. Both sales closed well above 104% which is where the credit was marked on the book. This is what happens when you mark your credit based on doomsday scenarios. When something other than doomsday surfaces, you outperform. Under promise, over deliver.
The last 2 years have essentially been a tryout for testing SoFi’s underwriting abilities amid wildly fluctuating backdrops. It passed this test with flying colors while many others failed miserably.
Per Chris, the firm is “merely scratching the surface” of capital market demand. If it needs to offload more loans to maintain origination capacity, it has demonstrated an easy and profitable ability to do so. That isn’t yet required but will be eventually which makes that open access absolutely imperative.
“In hindsight, I would’ve wanted to address this concern on the call.” – CFO Chris Lapointe
Risk Sharing in Capital Market Deals:
The item that spooked some investors was Chris saying that there is risk-sharing embedded in the capital market deals. Wedbush’s analyst came out claiming this was a pressing risk based on the risk cap not being quantified. But it was quantified. The risk sharing agreements are always “very small” and capped at the premium that the credit sells for. Chris explicitly said that. So? In an absolute worst-case scenario where 100% of the loans default, SoFi still receives the original par value of the loans. That’s an easy worst case to accept given it’ll never come to fruition and that SoFI will enjoy some level of premium (likely close to gain on sale) from all of these deals. STILL, it’s worth noting that a 105% gain on sale margin at the time of closing could actually mean a slightly lower gain on sale as the loans fully season. That calculus is embedded in the company’s forecasts which are consistently conservative.
Capital Market Deal Financing & Origination Capacity:
Part of this aforementioned deal structure flexibility is SoFi’s willingness to finance part of a capital market buyer’s purchase. This essentially allows it to double dip in value realization from the loan pools. Meaning? While the risk sharing agreement could bring realized premium below listed gain on sale margin, this would theoretically push that value realization right back up. It gets compensation via premium paid for the pool and compensation for assuming some of the risk via financing.
Its “Northstar is to maximize return on equity (ROE).”
SoFi’s willingness to offer this deal financing points to its continued determination to chase that max ROE. The chase shows that SoFi’s origination capacity remains in good shape like I said last week. If it’s willing to re-assume some of the credit risk that it’s offloading, clearly there’s no pressing or urgent need to shrink the credit position. It’s making this decision based on the “size of its balance sheet” and capital ratios which remain in very good shape. This financing is secured by the underlying loans in an accounting maneuver that mimics adding investment-grade bonds to the balance sheet.
There was one item added to this credit capacity argument that I made. Lapointe expects to add about $3.2 billion in lending capacity via $400 million in tangible book value growth expected for 2024. When pairing this with the following items (review), we’re left with its continued ability to comfortably originate:
$8 billion in credit being paid down (amortizing) annually with strong credit metrics leading to strong collections. That’s the luxury of short duration credit.
$2 billion in forward funding secured at similar terms to recent deals.
“Scratching the surface” for capital market demand per Chris this week.
Continued credit metric outperformance and HIGHLY conservative credit markings.
A 14.5% total risk-based capital ratio vs. 10.5% minimum and rapid deposit growth. It sees close to 90% of its loans being deposit funded over time vs. 65% today. The movement from 65% to 90% will mean lower cost of capital as it sheds reliance on pricier warehouse credit. This move requires the capital ratio cushions that it still has.
Continued growth in net income further feeding book value and retained earnings to support more risk absorption capacity in the coming years.
“We feel very good about our ability to maintain healthy capital ratios and enable growth at the pace we want without raising capital.” – CFO Chris Lapointe
2024:
Lapointe sees 50% of 2024 revenue coming from non-lending. Let’s do some fun math with this juicy nugget. It has done $1.02 billion in lending revenue year to date. If it disappoints in Q4, revenue there should be roughly flat Q/Q leading to $1.35 billion in annual revenue. Assuming entirely flat lending revenue from 2023-2024 (not at all likely, but not out of the question), this means it will do roughly $2.7 billion in 2024 revenue. This is about 7% ahead of consensus 2024 revenue estimates, and the SoFi team consistently under-promises.
He reiterated plans for positive GAAP net income in Q4 2023.
Market Share Updates:
SoFi’s personal loan market share now sits at 9.5% within its 680+ FICO credit band (average FICO over 740). It was at 8.0% last time we were updated and 6.0% not long before that. The market share taking continues. Student loan market share is at a whopping 60%. SoFi sees a $200 billion market opportunity for student loan borrowers that it can offer lower rates to. This doesn’t include any volume from borrowers seeking to extend terms and lower principal payments at stable (or even rising) interest rates. That opportunity is bigger than what I had assumed.
Market share within home loans is 0.1%. Just 1%-2% of SoFi’s app users who have a mortgage secured it through SoFi. There’s a massive opportunity to go after the other 98%. This pursuit will feature low customer acquisition cost as these are already SoFi customers of other products.
Lantern:
This wasn’t a big part of the call, but it is a much underrated part of SoFi’s business in my view. This is SoFi’s loan placement marketplace. It sends rejected borrowers here to be matched with a lending partner for approval. What does this mean? It means that the 75% of borrowers that SoFi is rejecting are being monetized. SoFi collects a referral fee and services these loans without assuming any credit risk. This lets it derive value from ALL loan inquiries while maintaining highly strict underwriting standards.
SoFi Invest:
While SoFi is taking deposit and lending market share from incumbents, it’s not doing so within investing. Most SoFi Brokerage customers are brand new to investing. This is why it was so important to get the bare bones product released rather than waiting until it had more advanced tools. Most of its Invest customers don’t want complex options data or technical help. They just want to auto-invest in ETFs.
6. Uber Technologies (UBER) – Miscellaneous
Drizzly launched a new holiday marketing campaign to help provide ideas for alcohol-based gift giving. ‘Tis the season for getting plastered.
Uber is rolling out a software upgrade to weed out bad-actor consumers on the platform. It will seek out patterns of negative reviews to secure a refund. With this information, it will remove commentary from these users from a driver’s profile. It’s also upgrading explanations given to drivers for poor reviews and account deactivations with the ability to appeal.
Uber is launching a new type of service offering. It functions similarly to Fiverr as a marketplace for contractors. With it, consumers can hire people to complete tasks or run errands. It’s beta testing the service in Florida and Canada. The more services it provides, the better its lifetime value to customer acquisition dynamics will become and the larger of an edge it will have over mono-line competition.
7. Amazon (AMZN) – Prime Subscription, Margin Expansion & Miscellaneous
a. Prime Subscription
There were two interesting pieces of news this week to support Prime Subscription pricing power. First, Amazon will add package tracking and return services for “Buy With Prime” merchants. With this introduction, Prime subscribers will be able to track deliveries through Amazon merchants selling on their own sites.
Secondly, Amazon’s Project Kuiper (low orbit satellites to rival firms like Starlink) delivered a 100% success rate. This is an important step towards cloaking the world with affordable satellite internet. This is expected to eventually be laced into the Prime Subscription to drive more value.
b. Margin Expansion
There were also a few interest margin expansion notes on Amazon this week. First is advertising. Amazon and Meta are partnering to integrate user accounts and transform Amazon ads on Instagram and Facebook into commerce (shop-able) links. Commerce links, unsurprisingly, convert customers at a higher clip than non-commerce links. They mean fewer clicks to checkout and lower friction. This diminished fraction raises checkout performance for merchants.
This friction erodes further when checkout is native to a site where consumers shop. In this case, that would be Facebook’s apps. Native simply means that checkout starts and finishes on Meta’s apps. It means shoppers don’t bounce in and out of the page which, again, raises conversion. This new relationship brings both conversion tailwinds fully to the table. It should be a revenue tailwind for Meta’s ad impression value and demand. It should be a revenue tailwind for Amazon as it enjoys a more effective selling channel. That enhanced efficacy should mean enhanced selling efficiency and better margins from this channel partner. I love it when my two largest holdings get along.
Along similar lines, Amazon is partnering with many social services to expand the reach of its ad impressions for merchants. It has recently added Meta, Snapchat and Pinterest to this program. That means more placements to sell to merchants and more high margin revenue to generate.
It’s also pushing hard into India to attract more 3rd party sellers to its marketplace. It wants to foster $20 billion in exports from that nation by 2025. 3rd party seller revenue is higher margin for Amazon than its 1st party marketplace revenue. India, with its giant population, growing middle class, business friendly government and current technological revolution, is an ideal country in which to seek out growth. That’s why every mega cap tech name is doing so.
Finally, it fired some employees within its gaming and Alexa segments in a move to drive more focus.
c. Miscellaneous
It will also start selling Hyundai’s in 2024. Shoppers will be able to buy a car on Amazon and pick it up at a dealer.
Nasdaq continues to move more of its infrastructure to AWS.
Amazon, Google and Microsoft will invest $8.5 billion in Thailand’s digital evolution.
8. Progyny (PGNY) – CEO Chat
Review of its Competitive Edge:
How has Progyny created such a monopoly-like presence within this small niche? It’s a simple formula. The firm fully customizes all treatment cycles. It treats prospective mothers like individuals. Competition treats them in a one-size-fits-all manner with mandated therapy steps and dollar maximums. These limitations force poor treatment decisions and complications.
Conversely, Patient Care Advocates (PCAs) perfectly complement Progyny’s treatment customization to ensure mothers are making the best decisions for themselves. This, in turn, leads to better treatment selection and faster time to fertilization. That diminishes treatment needs and lowers usage rates of neo-intensive care units (NICUs) due to better treatment structure.
This outcome edge means a cost edge due to avoided NICU expenses and the lower number of treatments. Finally, its early clients “went to bat” for the company to force national carriers to fully integrate with Progyny’s offering. So? This means Progyny offers benefits on a pre-tax, not post-tax basis. That means several thousand dollars in cost advantages for the patient too. Healthier and wealthier parents, wealthier employers. That’s Progyny.
The Specialist Network:
We got a couple of interesting updates on the size of Progyny’s network and its presence within that network. As of today, members of Progyny’s specialist network perform 70% of treatment cycles in the U.S. About 35% of this 70% is covered by insurance with the rest being cash pay. This means that Progyny represents a maximum of 25% of U.S. treatment cycles, and likely a much lower proportion given that it doesn’t own 100% of the market (yet).
Selling Season & Another Domino:
The firm is entering 2024 with its largest active pipeline to date. This sets it up well for continued strong growth in 2025. Furthermore, 2023’s selling season marked the 8th straight year of 20%+ of its existing clients expanding coverage. This fell from 25% Y/Y due to ProgynyRx penetration now approaching 100%.
Last year, Progyny won the Detroit Pistons as its first sports team. This year, it won 2 more NBA teams and an entire sports league. This is a consistent pattern. It wins a client in an industry and then proceeds to up-sell more services to that client and its competition. Competition follows the first domino to fall as they race to stay competitive in talent recruiting.
Progyny added 1.3 million lives this selling season vs. 1.2 million last year and it guides to stable or growing net additions annually. It is noteworthy that 300,000 of these 1.3 million lives were from a federal government win which will initially monetize at a lower clip. That led some analysts to discount these 300,000 covered lives out of the selling season results and claim this was a poor showing. I disagree. A few notes on this.
The federal government is a massive opportunity. Just like other industries show a domino-like pattern, the firm thinks this public sector will too. It expects to up-sell more services over time to smooth out the monetization gap and expects this to lead to more federal government wins. So? I don’t think it makes sense to back these lives out. BUT… even if you want to, results amid this backdrop were very good. Without the contract, it will grow members by 20% Y/Y for 2024. That’s amid one of the most difficult backdrops for selling employer benefits in recent history. And? The potentially lost members aren’t actually lost, they’re simply delayed.
Progyny’s “not now” clients from one year generally represent a large chunk of client wins in the following year. The cohort of not-nows heading into 2024 is quite large and sets them up for a highly successful selling season next year. Something similar happened in 2020 when clinics were shuttered and appetite to add benefits diminished amid the pandemic shock. It used this exact commentary of the not-now backlog growing larger with the expectation of that leading to stronger 2021-2022 growth. That’s exactly what happened, and I expect that to happen this time as well.
Long Term Opportunity:
Progyny won’t offer longer term revenue guidance until its opportunity matures a bit more. It’s just too early on to be giving that guidance with the firm being less than 5% penetrated in its directly addressable market. It does offer more color on longer term margin targets. It expects cash flow margin to reach 15% over time.
9. Disney (DIS) — ESPN Bet & Another Activist
ESPN Bet launched in 17 states this past week. ValueAct is joining Nelson Peltz as another activist investor in Disney.
The firm built the stake (amount not reported) throughout the summer and it was disclosed this past week. The activist thinks Disney’s parks and consumer-products businesses are worth $80 on their own. As I said about Peltz’s investment, I don’t think Disney needs activist investors at this time. I view it as being on the right path to a recovery. That will take time to play out (especially in film as we can see from The Marvels early performance), but the free cash flow guide and operational changes point to things moving firmly in the right direction.
10. Macro
Inflation Data:
Consumer Price Index (CPI) Y/Y for October was 3.2% vs. 3.3% expected and 3.7% last month.
Core CPI (strips out food & energy) Y/Y for October was 4.0% vs. 4.1% expected and 4.1% last month.
CPI M/M for October was 0% vs. 0.1% expected and 0.4% last month.
Core CPI M/M for October was 0.2% vs. 0.3% expected and 0.3% last month.
Producer Price Index (PPI) M/M for October was -0.5% vs. 0.1% expected and 0.4% last month.
Core PPI M/M for October was 0% vs. 0.3% expected and 0.2% last month.
Export Price Index M/M for October was -1.1% vs. -0.5% expected and 0.5% last month.
Import Price Index M/M for October was -0.8% vs. -0.3% expected and 0.4% last month.
Consumption, Output and Employment Data:
New York Empire State Manufacturing Index for November came in at 9.1 vs. -2.8 expected and -4.6 last month.
Philadelphia Fed Manufacturing Index for November was -5.9 vs. -9.0 expected and -9.0 last month.
Industrial Production M/M for October grew by -0.6% vs. -0.3% expected and 0.1% last month.
Retail Sales M/M for October grew by -0.1% vs. -0.3% expected and 0.9% last month.
Initial Jobless Claims were 231,000 vs. 220,000 expected and 218,000 last report.
11. Portfolio
I bought more SoFi and Lemonade during the week.
News of the Week (November 15 - 19)
Brad continues to become a more trusted and important part of my investing journey.
Brad puts out a lot of outstanding info every week.