

News of the Week
News of the Week
Visa; Mastercard; ServiceNow; Enphase; Spotify; Intel; Chipotle; Verizon; Airbnb; JFrog; Disney; Global Fintech Chaos; Market Headlines from Uber, CrowdStrike, Match, Shopify, PayPal; Macro; Portfolio

Today’s Piece is Powered by Savvy Trader:

In case you missed it, the following content was published during the week:
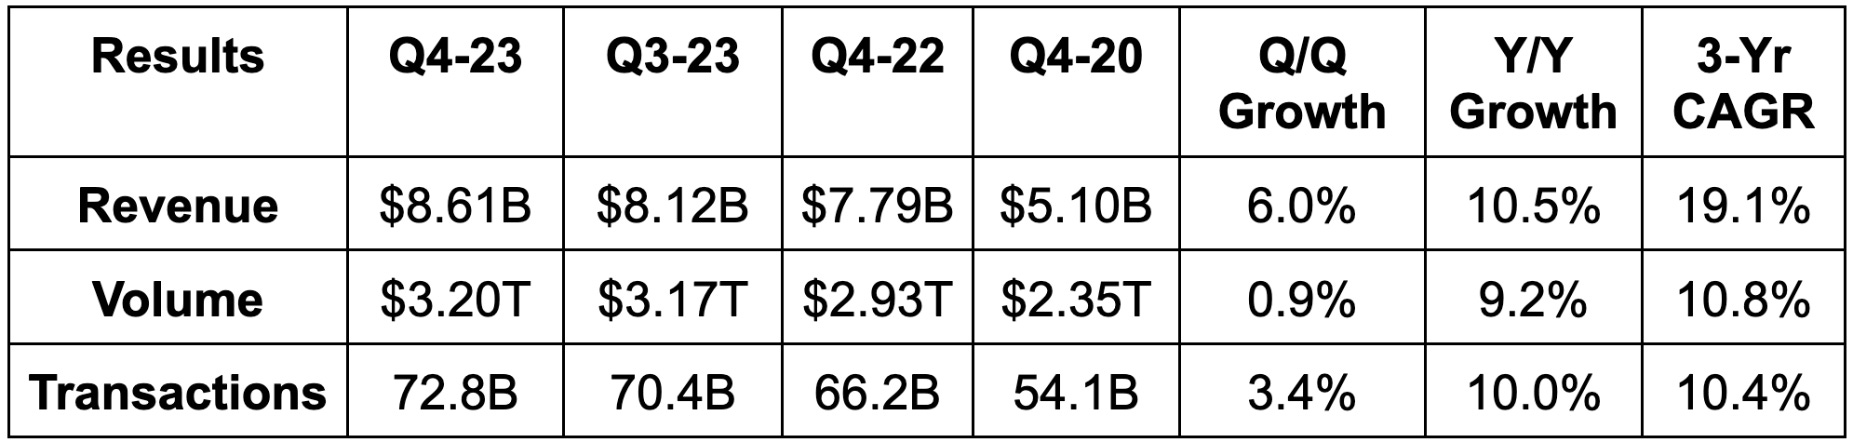
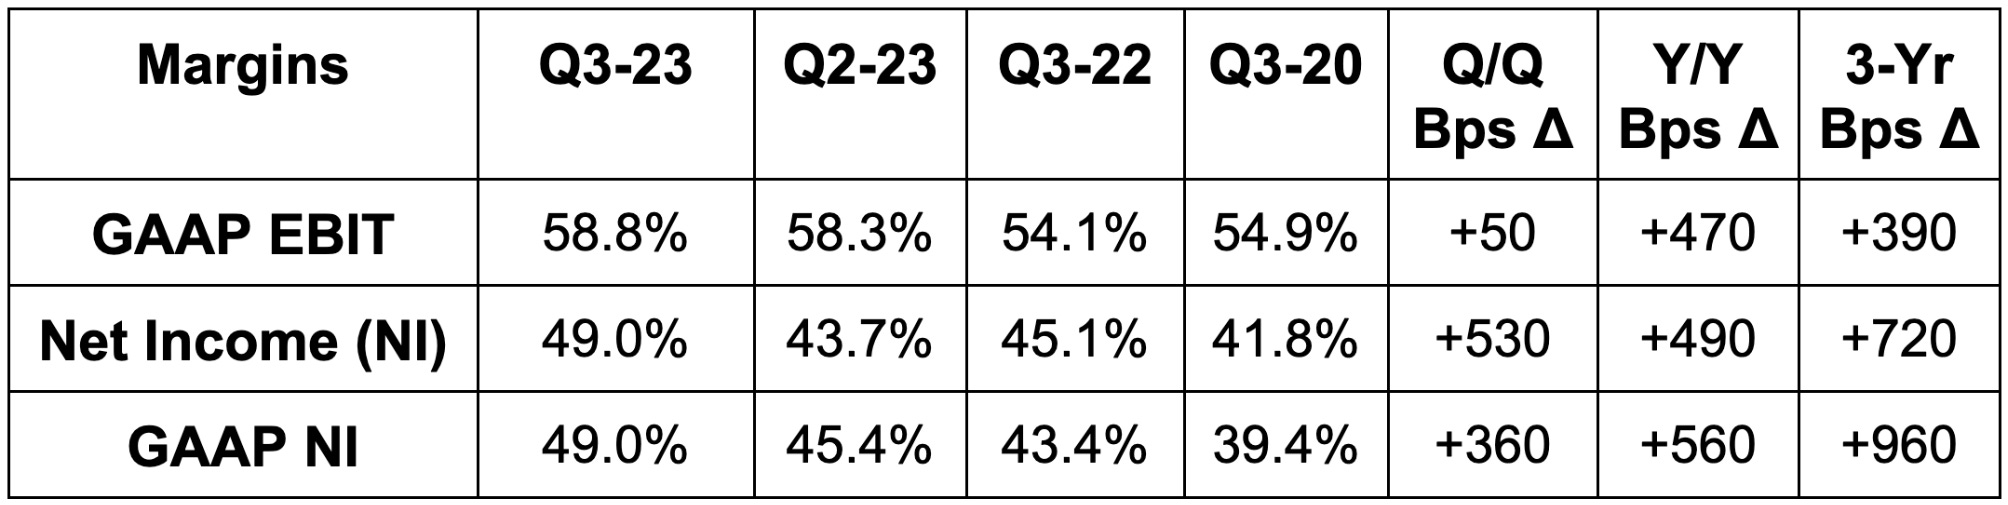
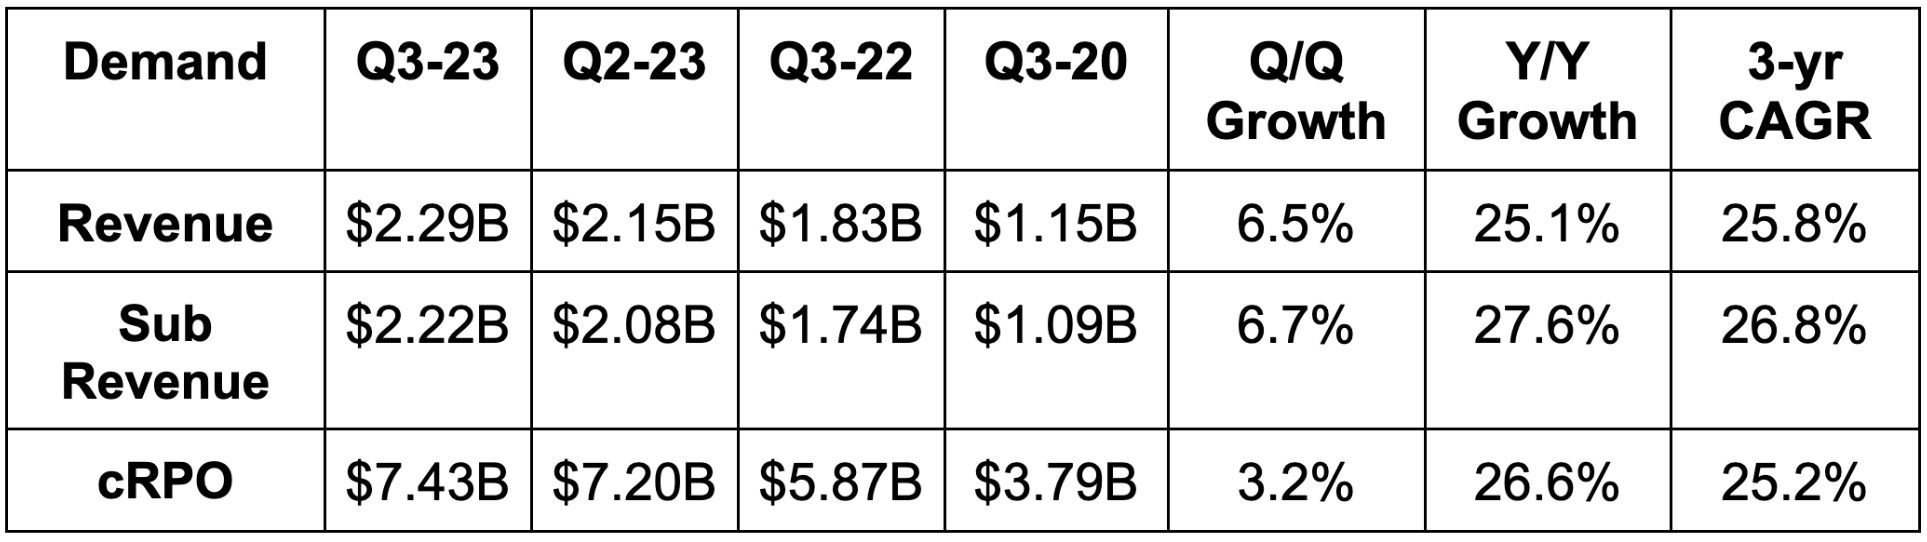
1. Visa (V) — Earnings Review
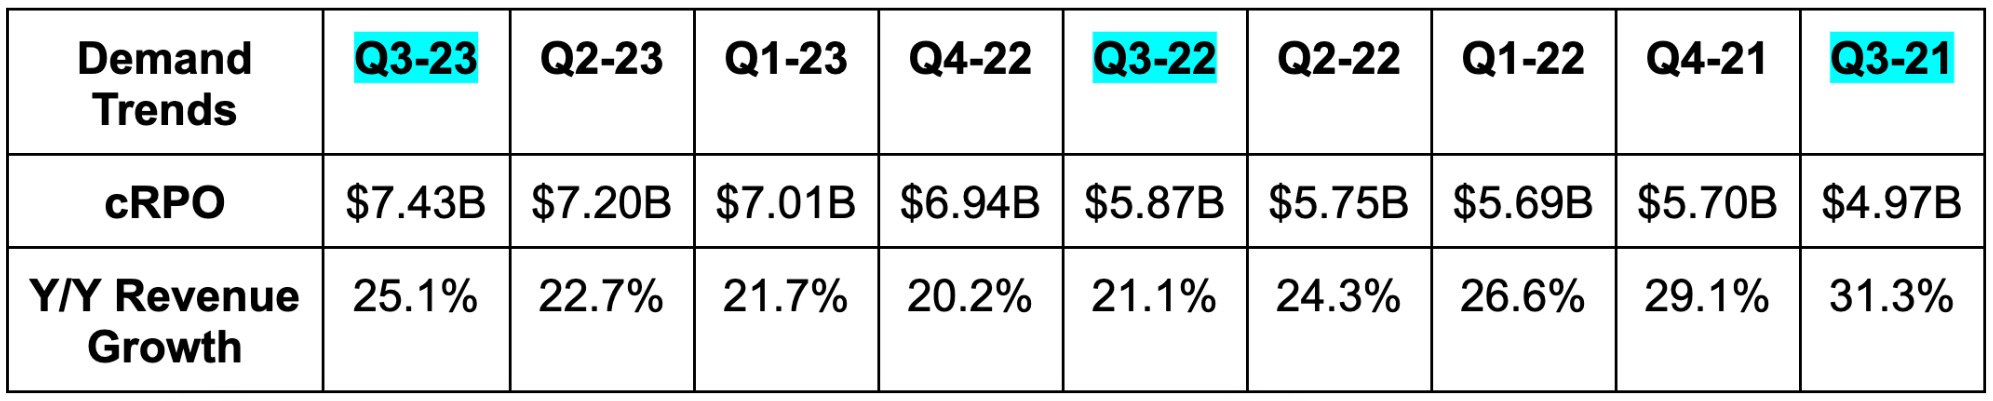
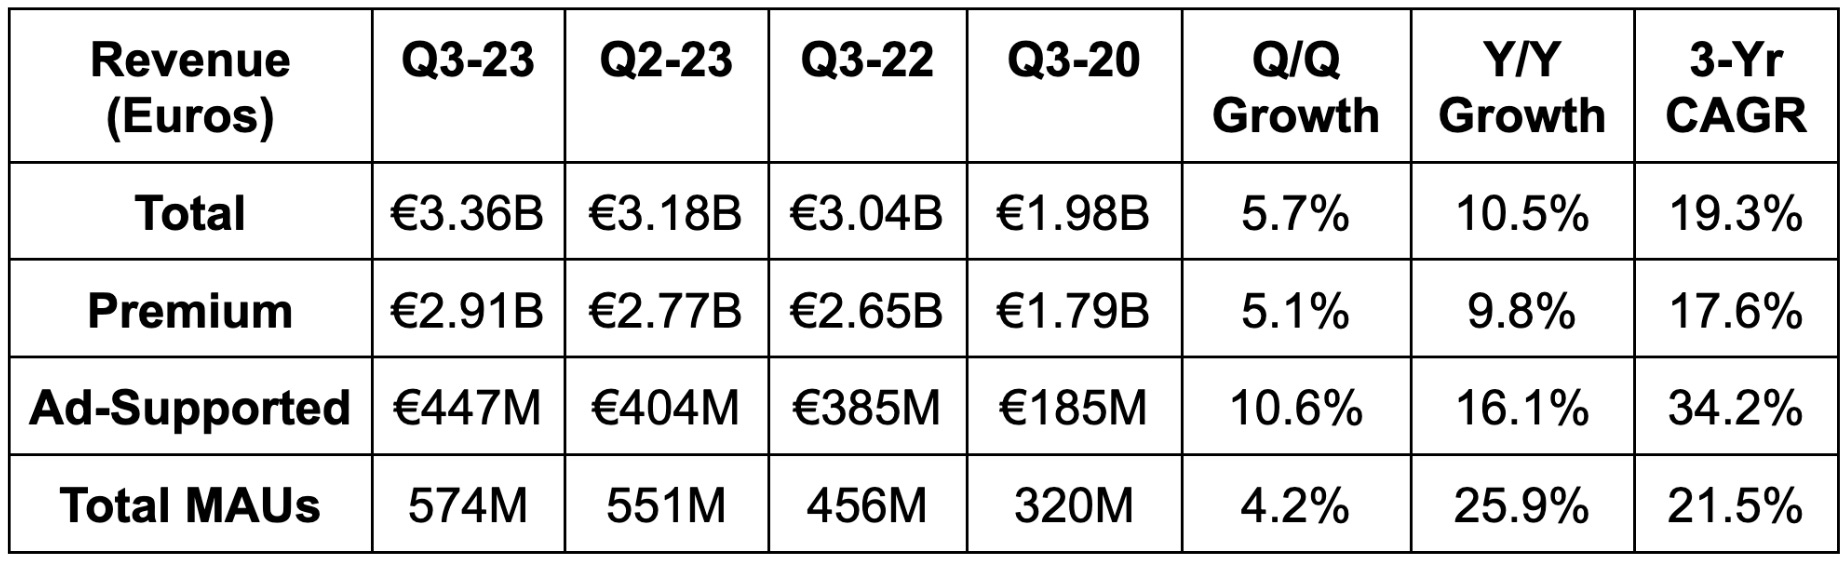
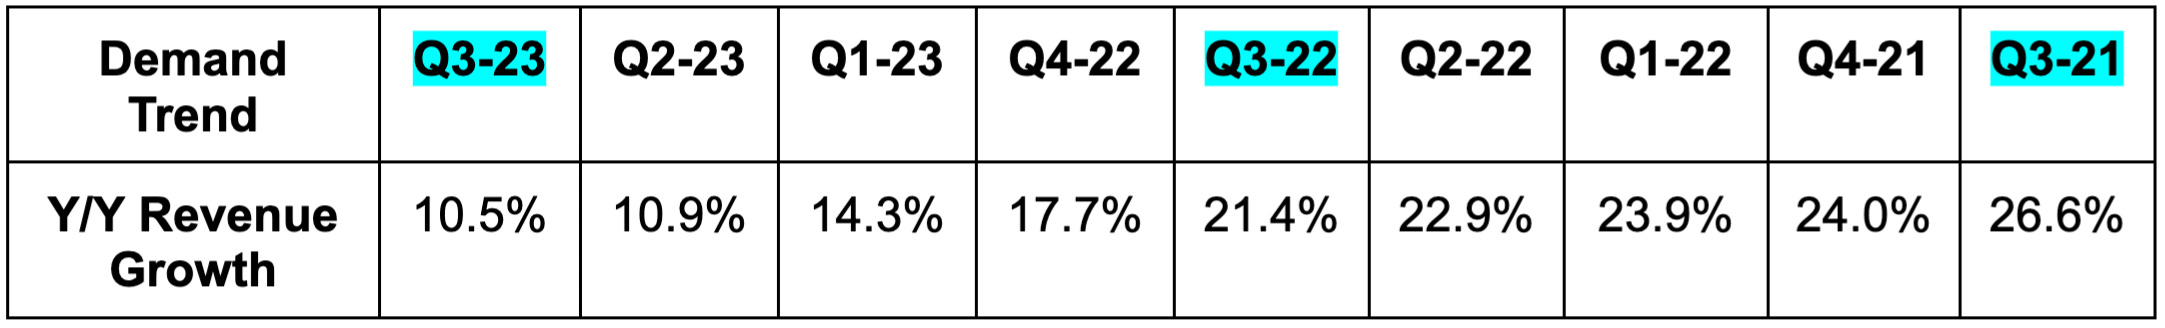
a. Demand
Visa beat revenue estimates by 0.7% & beat its guidance by 0.5%. Its 19.1% 3-year revenue compounded annual growth rate (CAGR) compares to 18.8% Q/Q & 11.0% 2 quarters ago. For the full year, revenue roughly met guidance.

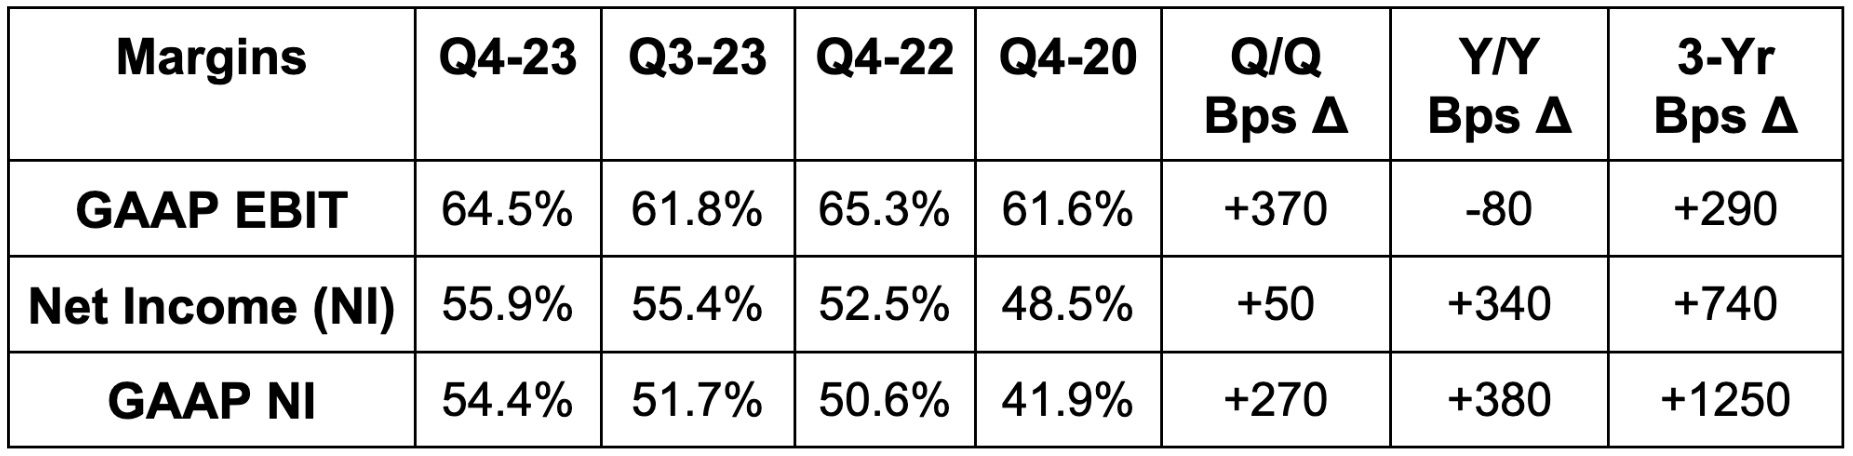
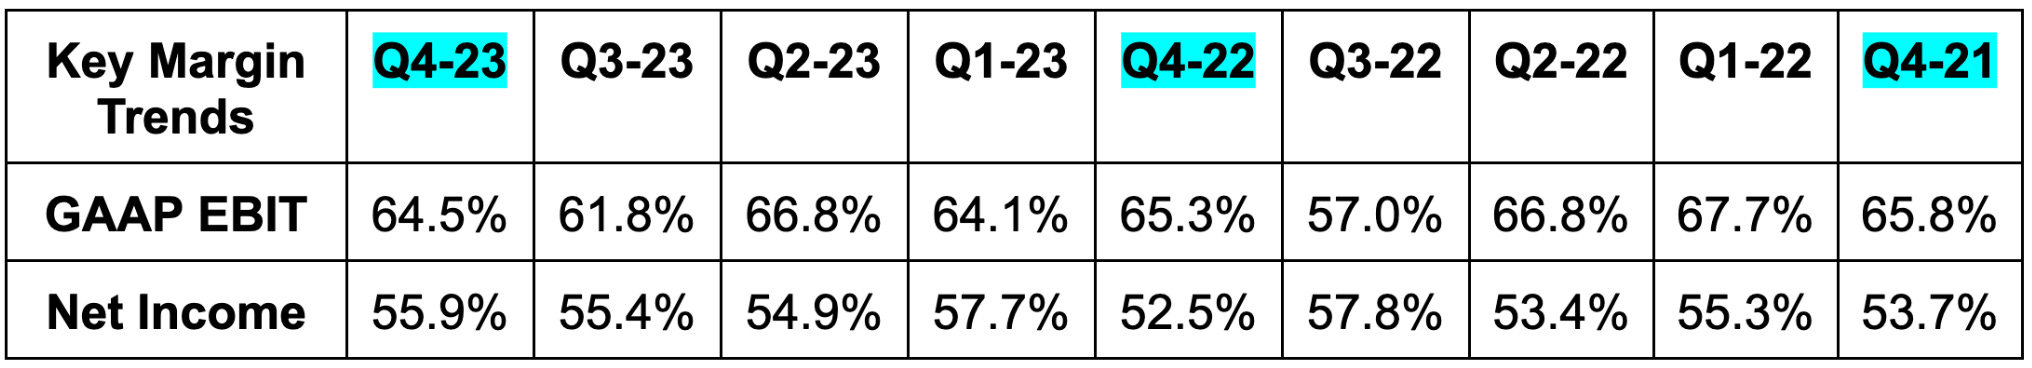
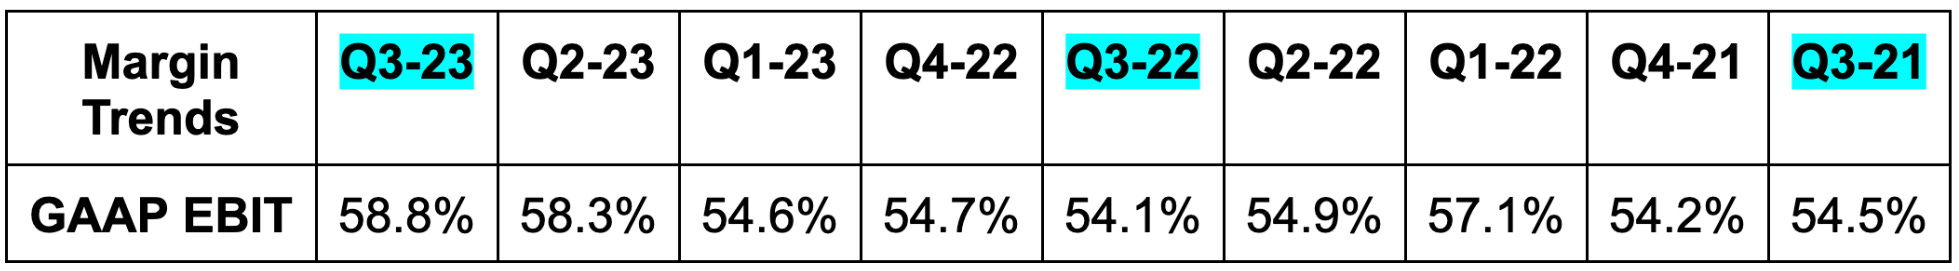
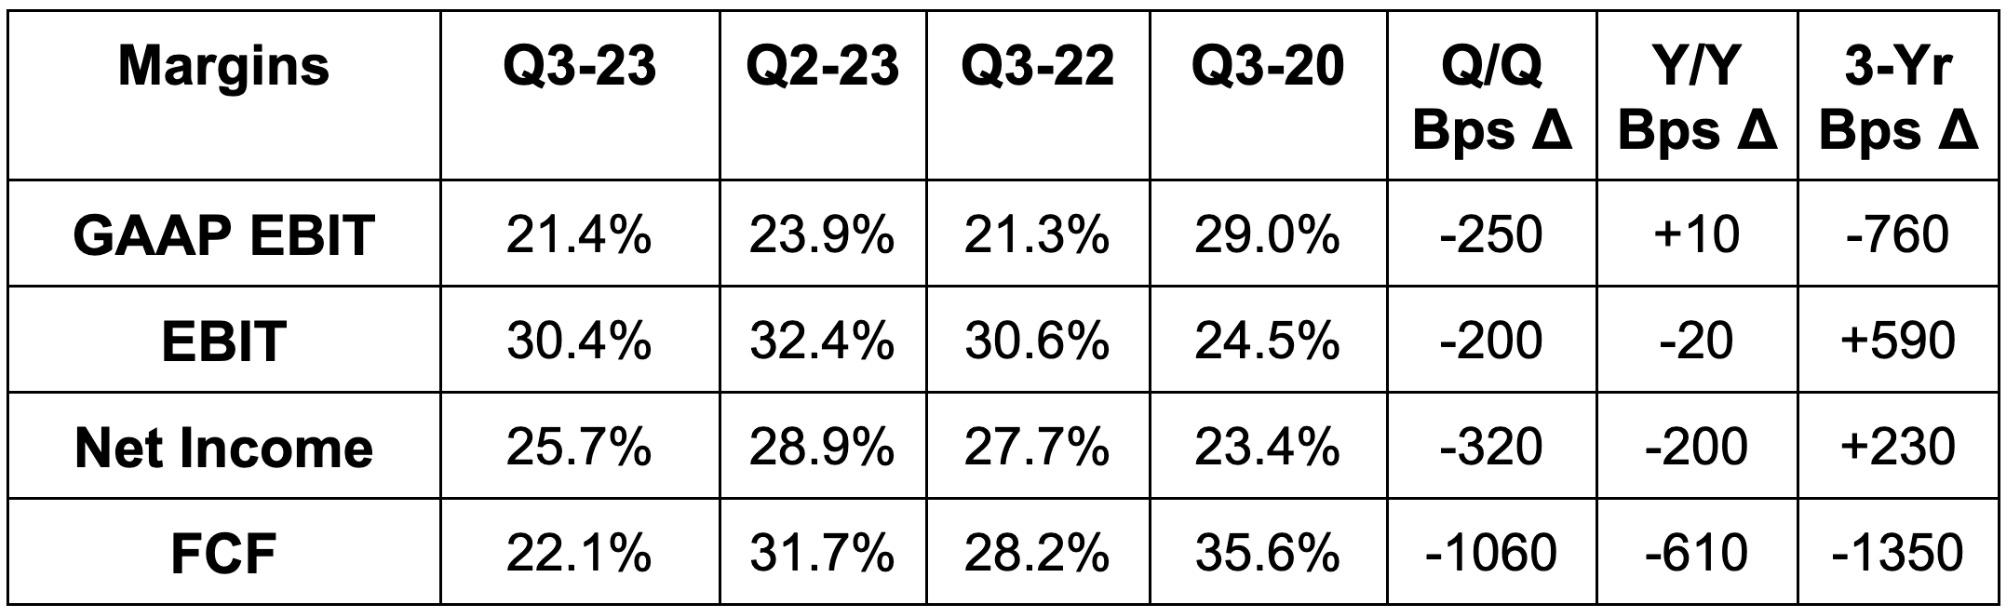
b. Margins
Visa beat $2.24 GAAP earnings per share (EPS) estimates by $0.09. That represents about 21% Y/Y growth and 3-year EPS compounding of 27.7%. For the full year, EPS rose by 17% which met loose guidance.
c. Balance Sheet
$20 billion in cash & equivalents.
$20.5 billion in total debt.
Dividend payments rose 17.1% Y/Y.
Share count fell 2.1% Y/Y. It bought back $12.1 billion in stock for fiscal 2023 vs. $11.6 billion Y/Y.
Visa added another $25 billion in buyback capacity. Pristine balance sheets are a wonderful thing.
d. Guidance
Visa sees fiscal year (FY) 2024 as being the most “normal” year that it’s had in a while. That was interesting to hear. It has lapped variant comps and the exit of Russia while inflation “continues to moderate” across core markets. Its outlook currently assumes no recession in 2024, and also no headwind from the resumption of student loan payments. It hasn’t seen any material impact to date from these payments restarting.
For the full fiscal year, Visa expects low double-digit revenue, volume and transaction growth, roughly 10% operating expense growth and low teens EPS growth. All of this was better than expected. Through the first 3 weeks of October, U.S. payment volume growth slowed to 5% for both credit and debit. The fall from 6% in September and this past quarter is mainly due to fuel disinflation.
Growth is expected to be the slowest in Q1 and to accelerate throughout the year. In the first quarter, revenue growth is expected to be 6%-7% with operating expenses (OpEx) rising in the “high single digit range” and EPS rising ~10% Y/Y.
e. Call & Presentation Highlights
Macro:
There are few companies in the world with a better sense of consumer health than Visa. According to leadership, consumer spend “across all segments” has been remarkably stable all year. Its data “indicates no behavior changes across consumer segments.” Volume growth even accelerated throughout the quarter. Again, it did slow into October, but that was via welcomed fuel disinflation.
Partnership Momentum:
Visa continues to rapidly add to its list of financial institution and enterprise partners. New FinTech deals rose 25% Y/Y while transit system deals rose 30% Y/Y. Importantly, 40% of the transit system deals include multiple value-add services. These high margin software upsells bolster the overall unit economics of Visa while lowering churn.
Visa Connect is its product connector between bank and FinTech partners to enhance access to digital-first tools. It enjoyed 70% Y/Y bank client growth. Transactions under this program doubled Y/Y.
This quarter, Visa signed an agreement with Tencent for cross-border and its peer-to-peer payments product called Visa Direct. The deal brings Visa Direct’s “wallet endpoints” to 2.5 billion.
Visa renewed its credit contract with Shinhan Card (largest issuer in Korea). Shinhan also added cross-border and data analytics services as part of the agreement. It also inked a new Citibank deal in 60 countries for a commercial business card and 20 value add services. Relatedly, IBM will use Visa (and Citi) for its new commercial card.
Finally, Visa renewed its U.S. Bank agreement while adding consulting and co-marketing products to the deal. Along those lines, Visa’s largest clients continue to utilize more of its products. As of this quarter, its largest cohort uses 22 Visa products, which is up 8% Y/Y. The more they use, the longer they’ll likely stay and the more revenue they’ll generate.
New Nequi partnership in Colombia enables the “first digital wallet there” to tap-to-pay.
New epiFi partnership in India to target high net worth individuals with consumer credit products.
New Razer Pay partnership to allow debit card holders to directly buy bonds and mutual funds.
Renewed its contract with Shopify for its merchant credit and debit tools.
Its CyberSource (fraud and security management) segment closed deals with 2,600 clients this year including Costco and Alaska Airlines.
Growth Metrics:
Y/Y Volume growth:
9% growth globally vs. 9% growth last quarter and 10% growth 2 quarters ago.
6% growth in North America vs. 6% growth last quarter.
11% growth in Rest of World vs. 12% growth last quarter
18% cross-border ex-intra Europe growth vs. 22% growth last quarter.
Commercial payment volumes rose 12% constant currency Y/Y.
Visa Direct saw 19% Y/Y growth in transactions and 30% Y/Y growth ex-Russia (where it exited last year).
Card-not-present growth of 9% Y/Y compares to 3% Y/Y card present growth. This divergence depicts e-commerce and service-based spending enjoying easier Y/Y comps vs. brick and mortar shopping.
FedNow:
Visa is now a certified provider for the FedNow program. This means its institutional clients can use FedNow and the Visa network to transmit funds in real time.
Travel:
Visa’s travel index vs. 2019 levels actually improved Q/Q. Travel volumes rose by a robust 26% Y/Y for the quarter. It continues to enjoy healthy travel growth across most of the globe. Outbound travel from Mainland China has been the slowest to recover, but is now showing signs of life.
f. Take
Like Bank of America, JP Morgan and Mastercard (as we’ll see below), this quarter points to continued consumer resilience. People are still spending. While loss rates are creeping up, they’re still under 2019 levels for non-sub-prime credit bands. Consumer balance sheets are in worsening, but still good shape and that will likely remain the case while the employment market remains so strong.
Considering consumer spending is over 70% of North American GDP, this should mean continued economic resilience overall. While that may mean one more rate hike or a longer pause, it should also mean a more favorable demand backdrop than some seem to think.
2. Mastercard (MA) – Earnings Review
a. Demand
Mastercard met revenue estimates and roughly met its revenue guidance. Purchase volume of $1.88 trillion also slightly surpassed expectations. Cross border growth met estimates. Its 19.4% 3-year revenue CAGR compares to 23.4% Q/Q & 12.8% 2 quarters ago.

b. Margins
Mastercard beat EBIT estimates by 0.4% and beat $3.23 GAAP EPS estimates by $0.16.
c. Guidance
For next quarter, Mastercard guided to low double digit revenue growth vs. 13.3% Y/Y growth expected. This includes a 50 bps foreign exchange (FX) tailwind while a 300 bps FX tailwind was expected. Its revenue guide would’ve been well ahead of consensus if the expected FX boost came to fruition. It also sees roughly 8.5% OpEx growth next quarter.
Quarter to date, Y/Y switched volume growth slowed from 14% to 11%, Y/Y switched transaction growth slowed from 15% to 12% and Y/Y cross-border growth slowed from 21% to 20%. The slowing is being driven by lapping its NatWest contract win, timing of social security payments and other comp headwinds. Mastercard did not cite the same fuel disinflation headwind that Visa did.
d. Balance Sheet
$7 billion in cash & equivalents.
$15.5 billion in debt ($1.3 billion is current or due within 12 months).
Share count fell 2.5% Y/Y. It bought back $1.9 billion in stock with $4.5 billion left on its current plan.
Dividend payments rose 13.6% Y/Y.
e. Call & Presentation Highlights
Macro:
Like Visa and others, Mastercard cited continued “resilience” in consumer spending. The strong labor market continues to support volume growth while credit and savings health is still in reasonable shape. Things are slowly getting more fragile… but they’re bending rather than breaking. Its forward guidance assumes this same level of “resilience” and stable macro headwinds play out next quarter.
Y/Y Growth:
5% North American volume growth vs. 6% Q/Q & 9% 2 quarters ago.
13% Rest of World volume growth vs. 16% Q/Q & 18% 2 quarters ago.
13.4% Y/Y revenue growth overall was 11% Y/Y growth FX neutral. Notably, FX helped revenue growth by 100 bps less than assumed. Mastercard would have beaten estimates had the impact been as expected.
By bucket, value added service revenue rose 17% Y/Y and payment network volume rose 12% Y/Y.
Its cyber security and marketing solutions were cited as standouts for the value-added service segment.
Y/Y Assessment (fees charged to other pieces of the value chain) growth:
Domestic growth of 11% vs. 10% last quarter and 7% 2 quarters ago.
Cross-border growth of 28% vs. 27% last quarter and 33% 2 quarters ago.
Transaction processing growth of 14% vs. 16% last quarter and 12% 2 quarters ago.
Deal Momentum:
Webster Bank is using Mastercard as its exclusive payment network. It will also use its marketing and security services.
Won Citizens Bank’s debit business.
Launched an “ultra-high net worth” credit suite for Citi’s Singapore and Hong Kong customer base. It signed a new Citibank deal to “forge a new card partnership in 60 countries” as well.
Barclays and Mastercard launched a new Xbox credit card.
Newer Opportunities:
Open-loop transit momentum remains strong. Open vs. closed loop simply means payment collection lets consumers use their choice of card or digital wallet vs. forcing a specific option. It launched open-loop systems in Toronto, Philadelphia, Pakistan and the Netherlands this quarter.
Tokenized transactions (means that data is anonymized with a digital token similar to hashing) have doubled over the last 2 years. New deals here include a Mercedes program allowing customers to pay for gas from within their cars.
Maestro card is Mastercard’s old debit card system. It’s being replaced by “Debit Mastercard” to enhance fraud prevention, cross-border compliance and contactless payment capabilities. It’s sunsetting Maestro cards in Europe and will move 100 million cards to the new format in the coming years.
New Flows:
Commercial growth within new payment flows was “strong.” This is where Mastercard works with enterprises to embed intuitive financial service products into their own platforms. It’s working with Oracle to add its virtual card tech for handling supplier billing and business purchases. It’s also working with SAP to add its commercial payments software. This is really where open banking comes into play. Open banking refers to freer 3rd party data sharing to uplift risk management and underwriting capabilities. By sharing data between Mastercard and giants like SAP, firms can enjoy more meaningful insight gleaning to make product interfaces work better and to price services more appropriately.
In value-add services, Safety Net, its fraud prevention tool, surpassed $20 billion in savings over the past year. This is another area where open banking helps to enrich datasets and thus minimize loss, fraud and chargeback rates. It’s now actively using AI models within these products to “create real time predictive risk scores” on a per transaction basis.
Its personalization and test to learn capabilities are also being globally recognized. For the third straight year, Gartner ranked it as the leader in this category for its “superior dynamic yield personalization activities.” This basically means Mastercard is better at creating custom products for important clients than others in the space. It partners with Aldi and Dunkin here to constantly test new product iterations.
Switched or not Switched, that is the question:
A switched transaction means the transaction is routed through software that connects different parts of the payment ecosystem. This means customers who utilize Mastercard as a primary network can tap into various other gateways and card networks. The “switch” is what sends this processed payment to the appropriate piece of the value chain. Switched transactions enhance security and flexibility for consumers. Furthermore, a switched transaction is higher margin for Mastercard than processing a check for example. As of this quarter, 65% of its transactions were switched by Mastercard vs. 55% 5 years ago.
f. Take
This was a fine quarter and was eerily similar to Visa (if not a little bit weaker). Mastercard, like Visa, is an elite company. We have decades of revenue compounding at sky high margins to prove that point. This result did not deviate from that consistently positive theme. It’s performing about as well as anyone can expect while macro uncertainty runs rampant. What we heard from the team echoed what we’ve heard from other consumer giants. The consumer and economy are both strong as employment markets stay robust. Still, that same consumer and economy are on growingly precarious footing.
Savvy Trader today is the only place where readers can view my current, complete holdings. It allows me to seamlessly re-create my portfolio, alert subscribers of transactions with real-time SMS and email notifications, include context-rich comments explaining why each transaction took place AND track my performance vs. benchmarks. Simply put: It elevates my transparency in a way that’s wildly convenient for me and you. What’s not to like?
Interested in building your own portfolio? You can do so for free here. Creators can charge a fee for subscriber access or offer it for free like I do. This is objectively a value-creating product, and I’m sure you’ll agree.

3. ServiceNow (NOW) – Earnings Review
a. Demand
ServiceNow beat its subscription revenue guidance by 1.4%. It also beat consensus estimates for total revenue by 0.7%. Its 25.8% 3-year revenue CAGR compares to 26.2% Q/Q and 26.1% 2 quarters ago. Finally, the company signed an impressive 83 new $1 million contracts vs. 70 Q/Q & 69 Y/Y.
b. Margins
ServiceNow beat EBIT estimates by 9.8% and beat $2.55 EPS estimates by $0.40.
c. Annual Guidance
ServiceNow slightly raised its full year subscription revenue growth guidance from 24.75% Y/Y to 25.5% Y/Y. The raise was via strong Q3 performance and not easier currency conversion rates. It also raised its EBIT margin guidance from 26.5% to 27.0%. It reiterated FCF and subscription gross margin guidance.
Guidance assumes no improvement to current macro headwinds.
d. Balance Sheet
$7 billion in cash & equivalents.
$1.5 billion in debt.
The company expects 1.5% Y/Y share growth for 2023.
e. Call & Release Highlights
Landing:
ServiceNow enjoyed its third straight quarter of large client growth acceleration. It signed FedEx as a new IT workflow customer, one of the “largest automakers” to displace dozens of point solutions, Cleveland Clinic, the U.S. Department of Defense and many more. The pipeline is healthy and “growing quickly.” Not only are new customers rapidly signing with ServiceNow, but they’re not going anywhere afterwards. Renewal rates are stable at 98%.
Along similar lines, it deepened a partnership with Deloitte. Now, the consulting giant will integrate ServiceNow’s newer GenAI products into its own product suite. The two also co-invested in a workflow management leader in India.
Expanding & Doing more for Customers:
The company enjoyed 58% Y/Y growth in $20 million+ customers. This accelerated vs. the 55% Y/Y growth it delivered last quarter. Average contract value (ACV) for its largest customers rose by 10% Y/Y. Of its 20 largest deals this quarter, 14 included all of its workflow categories (service management, operations, asset management, security, customer management, employee management and creator management). 18 of its largest 20 deals included 8 or more products.
Federal Traction:
This was the firm’s best quarter ever for new contract growth with the Federal Government. It enjoyed 75% Y/Y growth here and its 3rd largest deal ever with the U.S. Air Force. All in all, it closed nineteen $1 million+ deals and three worth more than $10 million.
Generative AI:
ServiceNow released its Vancouver platform during the quarter. This infuses the firm’s GenAI work directly into its workflow automation products. Vancouver also includes a product called “Now Assist” which is a virtual chat bot to bolster work productivity. This is a similar concept to Microsoft Copilot, Google’s Bard Assistant, Meta AI and other offerings. Now Assistant boasts agent conversation and case summarization, chatbots and conversational search. ServiceNow is directly monetizing these GenAI upsells in an approach that mimics Microsoft’s. Despite Vancouver being released one day before this quarter ended, ServiceNow closed 4 large deals with the product in Q3.
“Gartner forecasts that $3 trillion will be spent on GenAI between 2023 and 2027… this isn’t a hype cycle. It is a generational movement. The investments in GenAI are already accelerating the pipeline with customers lining up.” — CEO Bill McDermott
f. Take
The point solution consolidators and platform plays within software continue to thrive. ServiceNow finds itself in a compelling position where it can market its products as cost savers AND utility enhancers. That combination is very much in vogue today, which this quarter depicts. Everyone wants to do “more with less” and that’s what ServiceNow’s workflow tools deliver.
This quarter offers a positive hint for other platform plays across different pieces of software. Workday, Salesforce, The Trade Desk and CrowdStrike first come to mind. If you’re letting customers consolidate point solutions to thread the better efficacy and cost needle, you’re likely doing just fine. If you are one of those point solutions, you’re likely struggling.
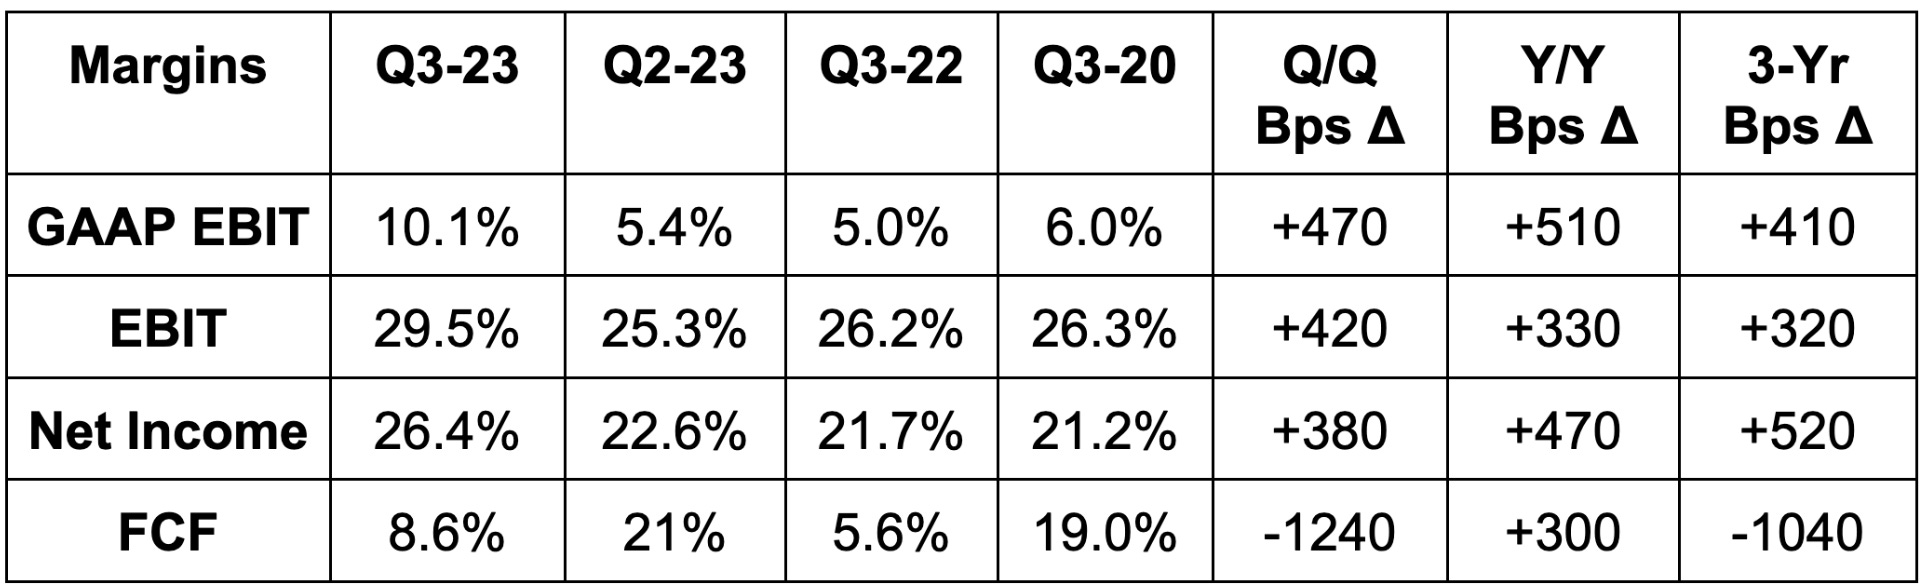
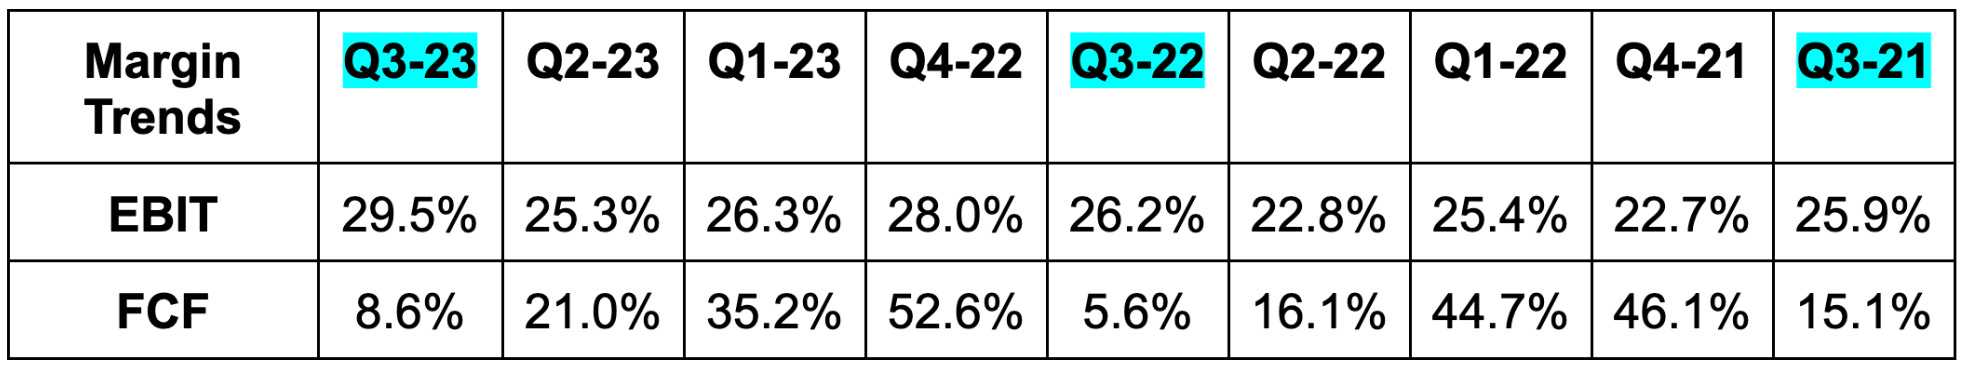
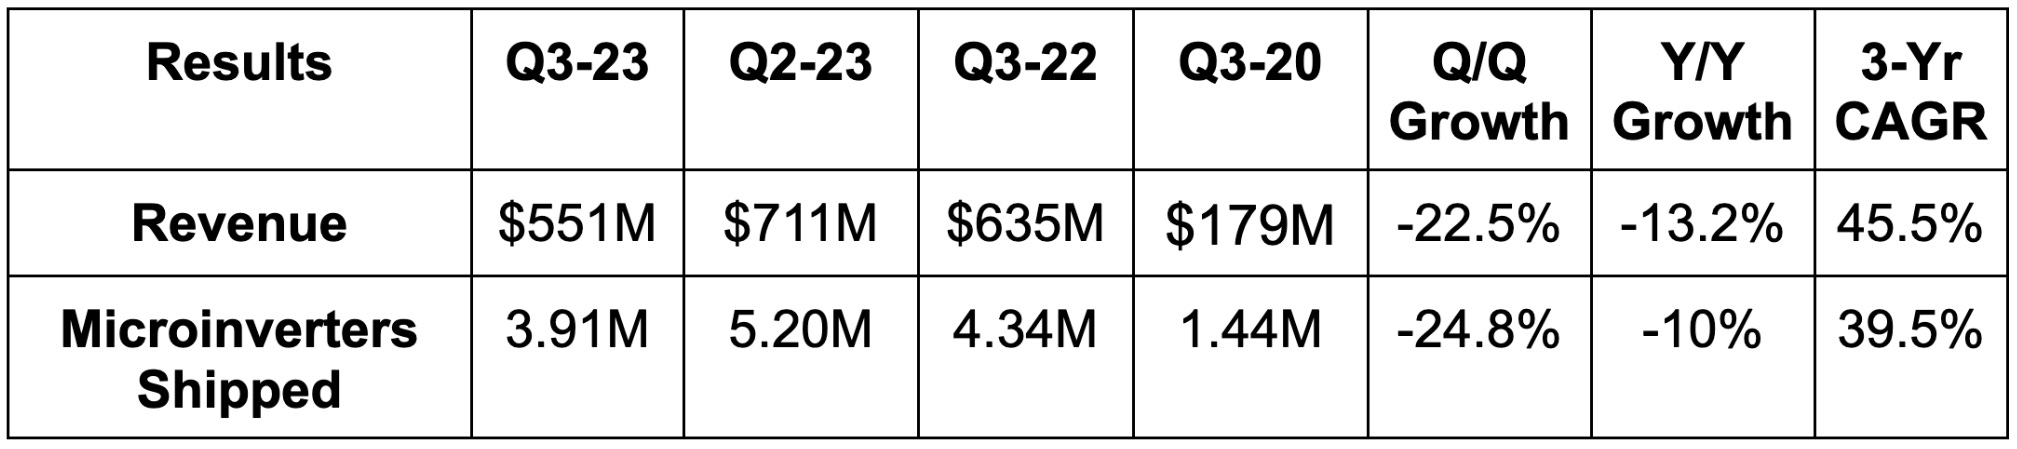
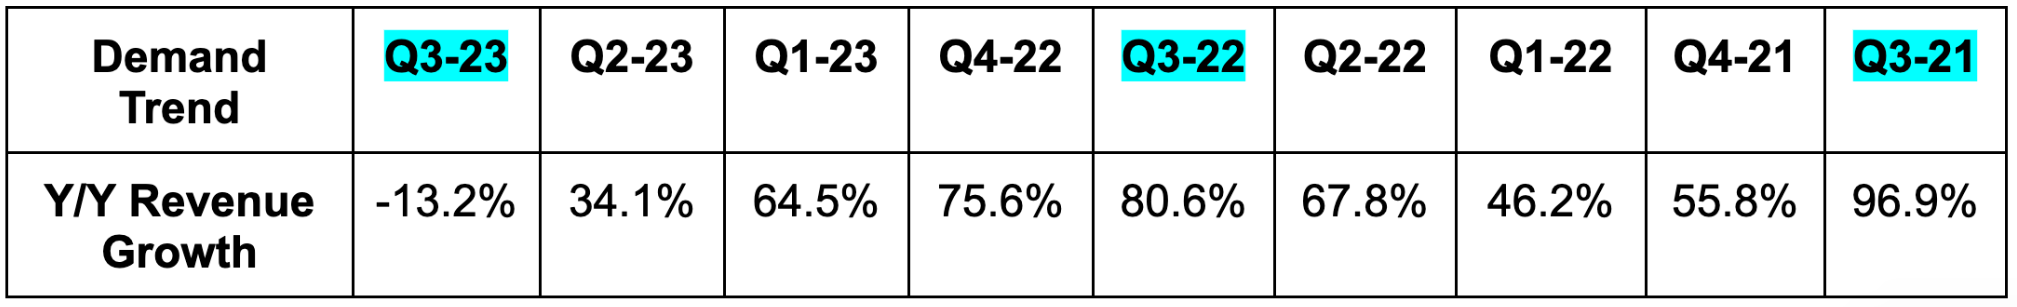
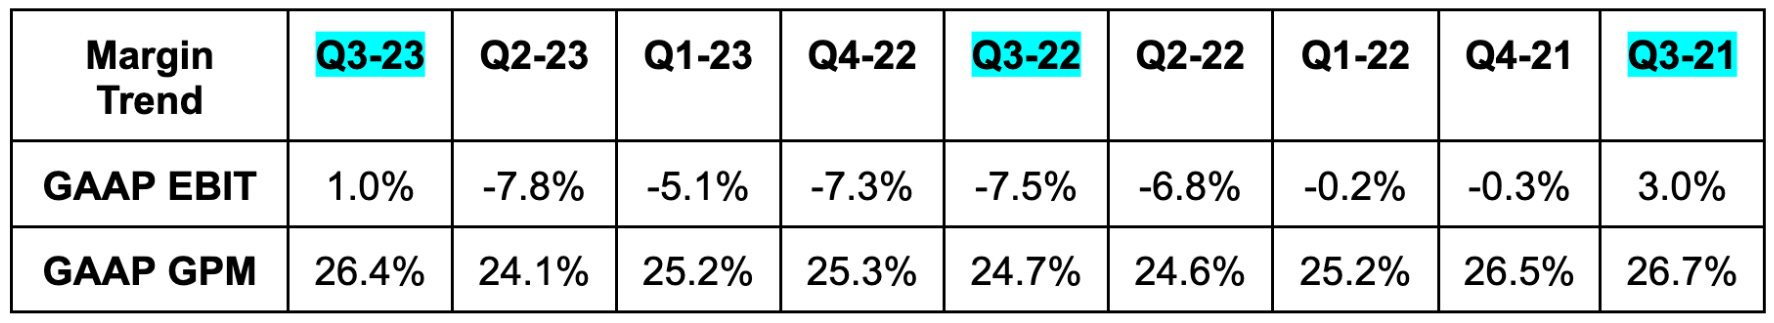
4. Enphase Energy (ENPH) – Earnings Review
Residential solar is among the sectors most directly hurt by soaring interest rates. On an apples-to-apples basis, installations become more expensive and this form of discretionary spend becomes less appealing. California’s recent compensation cuts for excess credits merely add to the challenges. Especially for individuals rather than giant enterprises, macro matters dearly for this sector. Budgets are finite and when those budgets are stressed, solar energy products are far from priority 1. This is a classic case of why sell side estimates for violently cyclical companies should be taken with a massive grain of salt. Analysts get too excited on the way up, and they’re generally too slow to lower unrealistic estimates on the way down. Let’s dig in.
a. Demand
Enphase missed revenue estimates by 2.8% and missed its guidance by 4.2%. Its 45.5% 3-year revenue CAGR compares to 78.3% Q/Q & 52.2% 2 quarters ago.
b. Margins
Beat EBIT estimates by 18.7% and beat its EBIT guidance by 41.5%. It sharply missed FCF estimates as well. Gross margin was better than expected due to a larger IRA benefit.

c. Guidance
Next quarter revenue guidance missed estimates by 43%. This includes a $150 million (or 46%) hit from channel inventory corrections. These corrections will last through the first half of 2024 vs. previously being expected to wrap up by this quarter. Leadership was wrong here. Gross margin was better than expected, but it guided to about $10 million in EBIT vs. expectations of $106 million. The guidance assumes zero improvement in demand or macro, and was called conservative multiple times on the call.
d. Balance Sheet
$1.8 billion in cash & equivalents.
$1.2 billion in debt.
Share count fell 1.5% Y/Y. It repurchased $110 million in stock during the quarter with $890 million left on the current program.
e. Call & Release Highlights
Microinverters:
Microinverters convert the energy generated by solar panels into usable electricity. The IQ8 Microinverter (pictured below) is Enphase’s latest iteration and represents 86% of its total shipments across 15 countries. It also began shipping IQ8 Microinverters from its newest Texas plant this quarter.
 | Enphase")
This is where California’s net energy metering 3.0 (NEM 3.0) policy change, which cuts the value of excess solar credits, is hurting. California sell-through fell 25% Q/Q vs. -4% in the other 49 states as high rates also hit demand. Enphase thinks this California headwind will persist for a few more quarters; the state’s 22% utility rate hike proposal could speed that up. Market share in the USA is stable and it’s not incrementally cutting pricing. This is a matter of macro, not growing competitive threats.
Throughout Europe and the USA, inventory gluts from channel partners and softening demand (especially in Europe) are hurting results significantly. It debuted new technology there to “dramatically improve installation experience with significant time savings.” That should help over time as macro cooperates a bit less putridly. In the Netherlands specifically, leadership cited fears of export penalties and changing net metering laws as creating yet another demand shock. This should be short-lived; when it rains it pours.
Batteries:
Enphase’s newer battery business has fared a bit better. Shipments rose modestly Q/Q in the USA and fell in Europe. All of its manufacturing capacity for its newest battery is in China. It’s working to add capacity in the USA next year.
f. Take
It would be very easy to pick on this company and team today. Leadership underestimated the harshness of macro headwinds, which is not ok. Still, this is truly related to the exogenous environment being more difficult than perhaps ever before. Performance here will look better eventually, I’m just not sure when eventually will come. This company is down, but it is not out. The balance sheet is healthy enough and the market share maintenance points to brighter days ahead. For now, tough times.
5. Spotify (SPOT) – Earnings Review
a. Demand
Beat revenue estimates by 0.9% & beat guidance by 1.8%.
The 19.3% 3-yr revenue CAGR compares to 18.9% Q/Q & 18.1% 2 quarters ago.
Premium subscribers rose 3% Q/Q and 16% Y/Y.
Beat monthly active user (MAU) guidance by 0.3%; Beat premium subscriber guidance by 0.9%.
b. Margins
Beat 26.0% GPM estimates & beat same guidance by 40 basis points (bps) each.
Beat (€45M) EBIT estimates by €78M & beat EBIT guidance by €77M.
Beat FCF estimates by 44%.
c. Guidance
Beat Q4 revenue estimates by 0.5%.
Beat 26.3% GPM estimates by 30 bps.
Beat (€12M) EBIT estimates by €49M.
Reiterated long term investor day targets including 1 billion users by 2030.
It also expects to add 27 million monthly active users (MAUs) in what would be a banner quarter for user growth. This pairs nicely with the new trend of margin expansion. Based on strength year to date, it now sees 30 million premium subscriber adds in 2023 vs. 20 million at the start of the year.
d. Balance Sheet
€3.8 billion in cash & equivalents.
Share count up 1% Y/Y.
e. Call & Letter Highlights
Gross Margin:
Consistent gross margin de-levering has been a primary bear case for this investment. That consistent trend encouragingly reversed (as expected) this quarter. Gross margin outperformance was driven by both podcasting and music strength. It also has now lapped previous changes in historical estimates which fostered about a quarter of the margin expansion. Premium gross margin set a 5 year quarterly high at 29.1% while ad-supported gross margin was 8.3% vs. under 2% last year. This gross margin outperformance paired with lower marketing spend powered the large operating income beat.
Price increases were implemented this quarter which also boosted margins. That wasn’t the main factor, but did help. I must say, these price hikes coinciding with such healthy net user growth is impressive. It points to significant demand elasticity and more pricing power in the docket.
Advertising & Macro:
Advertising trends stabilized for Spotify during the quarter. 20% Y/Y growth in music ads and “solidly double digit podcast ad growth” were powered by impression growth thanks to more users and also stable pricing. It tightened its Roku partnership to allow video ad placements within Spotify.
User Growth:
User growth remains strong across the globe. It’s slowest in North America, but still at a healthy 19% Y/Y clip. It’s between 21% and 31% across all other regions. Premium subscriber growth is even healthier in North America at 27% Y/Y and 39% Y/Y in Europe. It’s slower in Latin America and the rest of the world where traction is expectedly lagging.
Products & AI:
AI DJ (better song and content recommendations) was released in 50 more markets this quarter. Innovation like this is expected to keep user growth robust. Along similar AI lines, it’s beta testing Voice Translations for its podcasts to translate dialogue into a listener’s native tongue (in the creator’s voice). It’s now actively adding audiobooks to its overall library with 150,000 titles introduced in the UK and Australia this quarter. The more content types that its subscribers consume, the less they’ll churn.
“While it’s still too early to see the audiobook impact in our numbers, initial signs are incredibly positive.” – Founder/CEO Daniel Ek
Spotify also debuted Showcase. This is somewhat similar to sponsored listings on a marketplace like Amazon, for example. It allows artists to select new content for promotion upon release. All of these new ad tools come with a revamped analytics dashboard to enhance performance reporting transparency.
f. Take
This was the best quarter I’ve seen from Spotify in a while. The user growth was very impressive and the needed gross margin bottom came. Affordable luxuries like this one (and like a Starbucks for example) generally fare better amid poor macro vs. big ticket purchases. Some people rely on music for wellbeing… myself included. This quarter is evidence of that relative immunity from economic cycles and should be a report that has shareholders grinning. Well done, Spotify.
6. Earnings Roundup — Intel, Chipotle, Verizon
a. Intel
Results:
Beat revenue estimates by 4.1% & beat guidance by 5.7%.
Data Center and AI revenue fell 5% Q/Q and fell 9.5% Y/Y (no 3-year comp data).
Beat non-GAAP gross profit margin (GPM) estimates & same guidance by 280 bps.
Beat $0.22 EPS estimates by $0.19 & beat EPS guidance by $0.21.
Guidance:
Beat revenue estimates by 5.6%.
Beat 44.4% GPM estimates by 210 bps.
Beat $0.32 EPS estimates by $0.12.
Beat $0.08 GAAP EPS estimates by $0.15.
Balance Sheet:
$25 billion in cash & equivalents.
Inventory is down materially year to date.
$49 billion in total debt.
Share count is up 2.0%.
b. Chipotle (CMG)
Results:
Met revenue estimates & met comparable sales guidance.
15.6% 3-yr revenue CAGR compares to 22.6% Q/Q & 19% 2 quarters ago.
Beat EBIT estimates by 4.7%.
Beat $10.63 GAAP EPS estimates by $0.73.
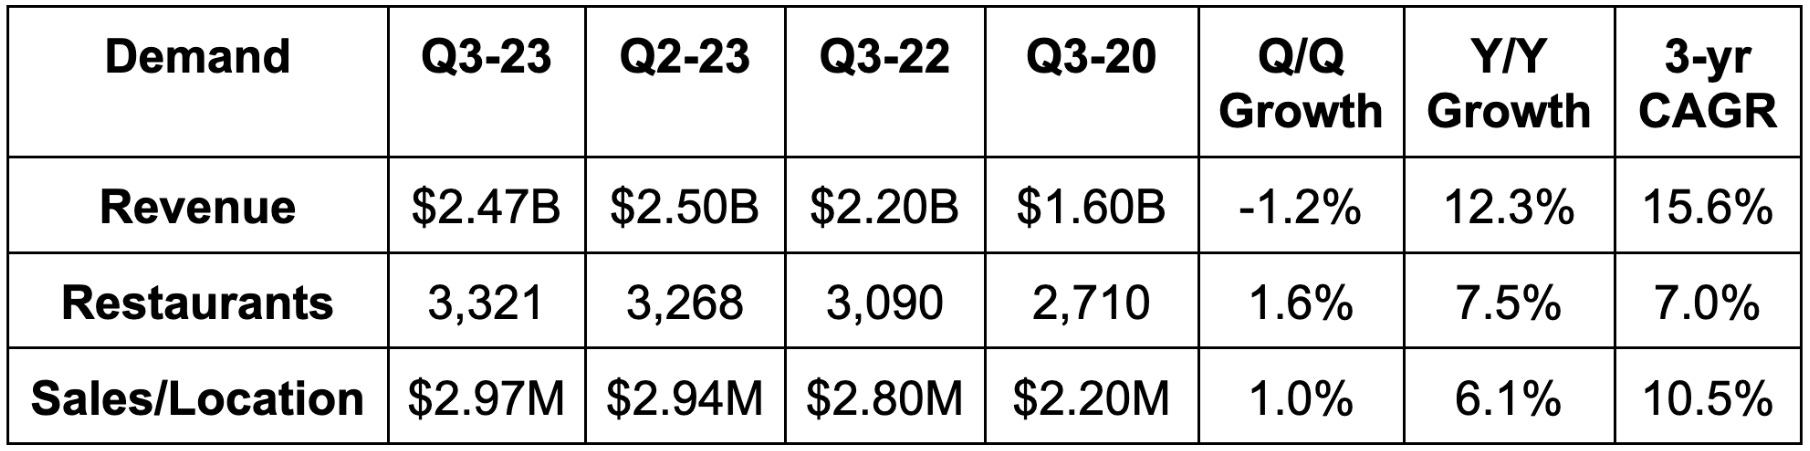
Guidance:
Comparable restaurant sales growth and store openings guidance for the full year were both reiterated. That’s all it gives us.
Balance Sheet:
$602 million in cash & equivalents.
Share count is down slightly Y/Y.
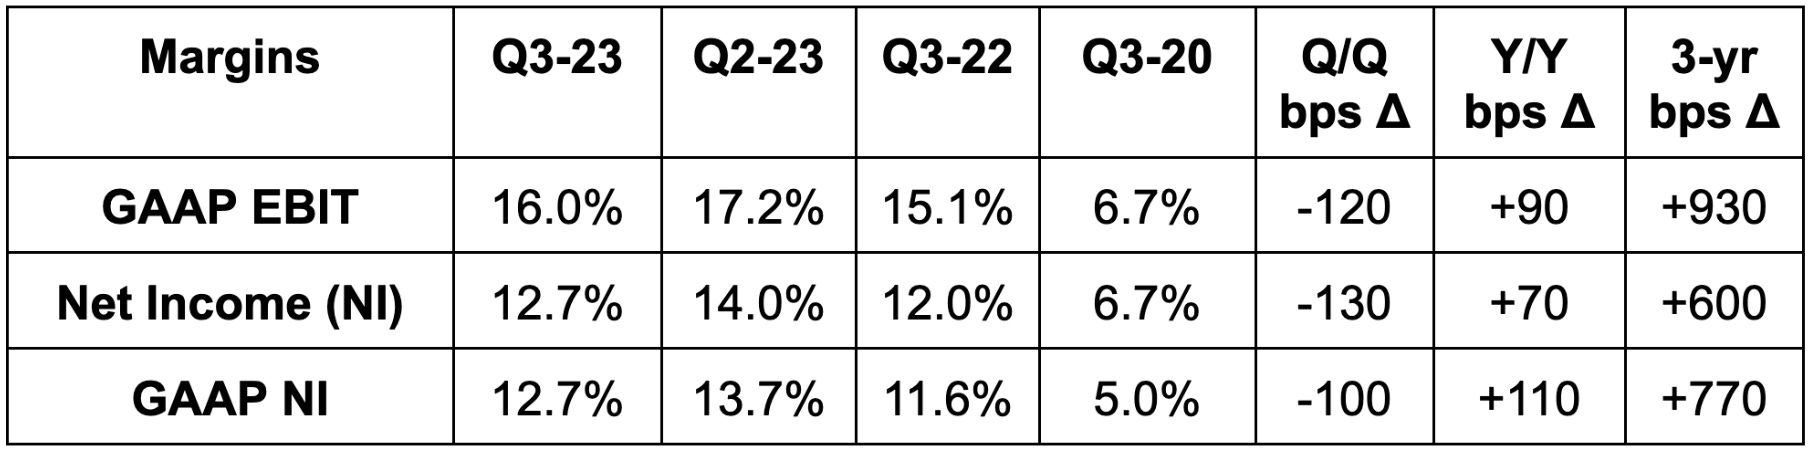
c. Verizon (VZ)
Results:
Met revenue estimates.
434,000 net broadband additions vs. 418,000 Q/Q & 377,000 Y/Y.
2.6 million wireless postpaid phone adds vs. 2.3 million Q/Q & 2.6 million Y/Y.
Met EBITDA estimates.
Missed EBIT estimates by 3.6%.
Beat $1.18 EPS estimates by $0.04.
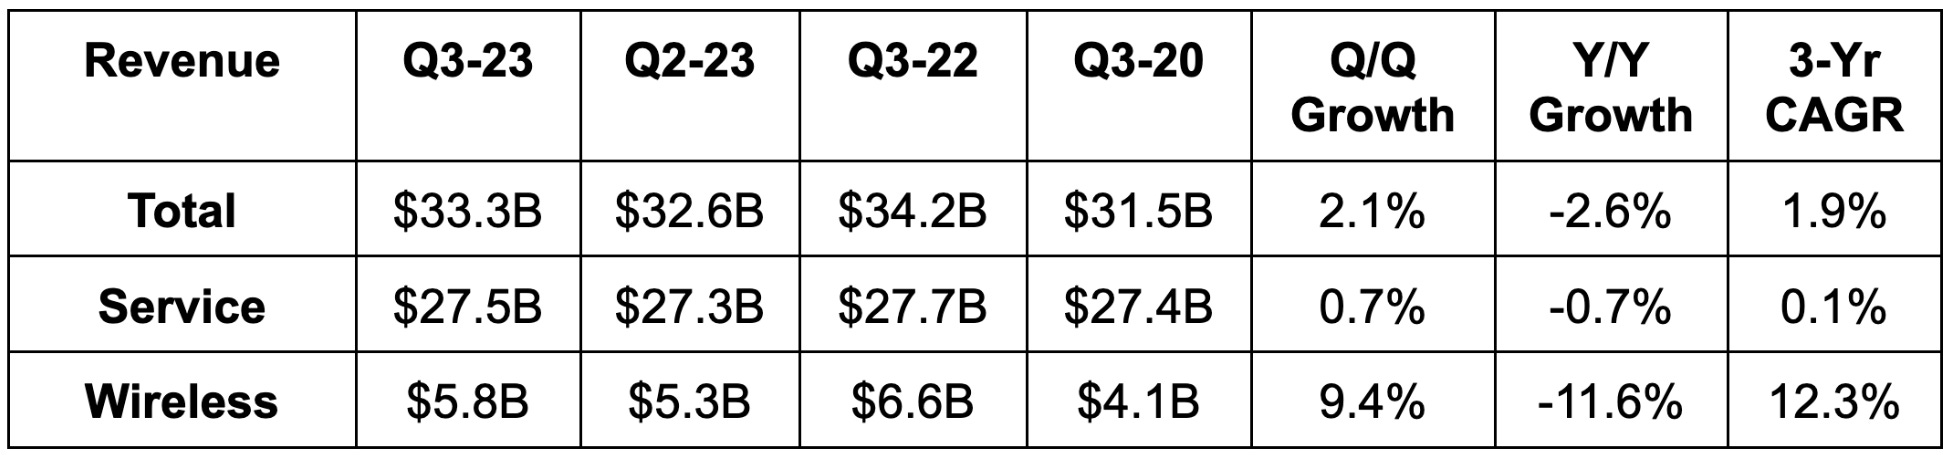
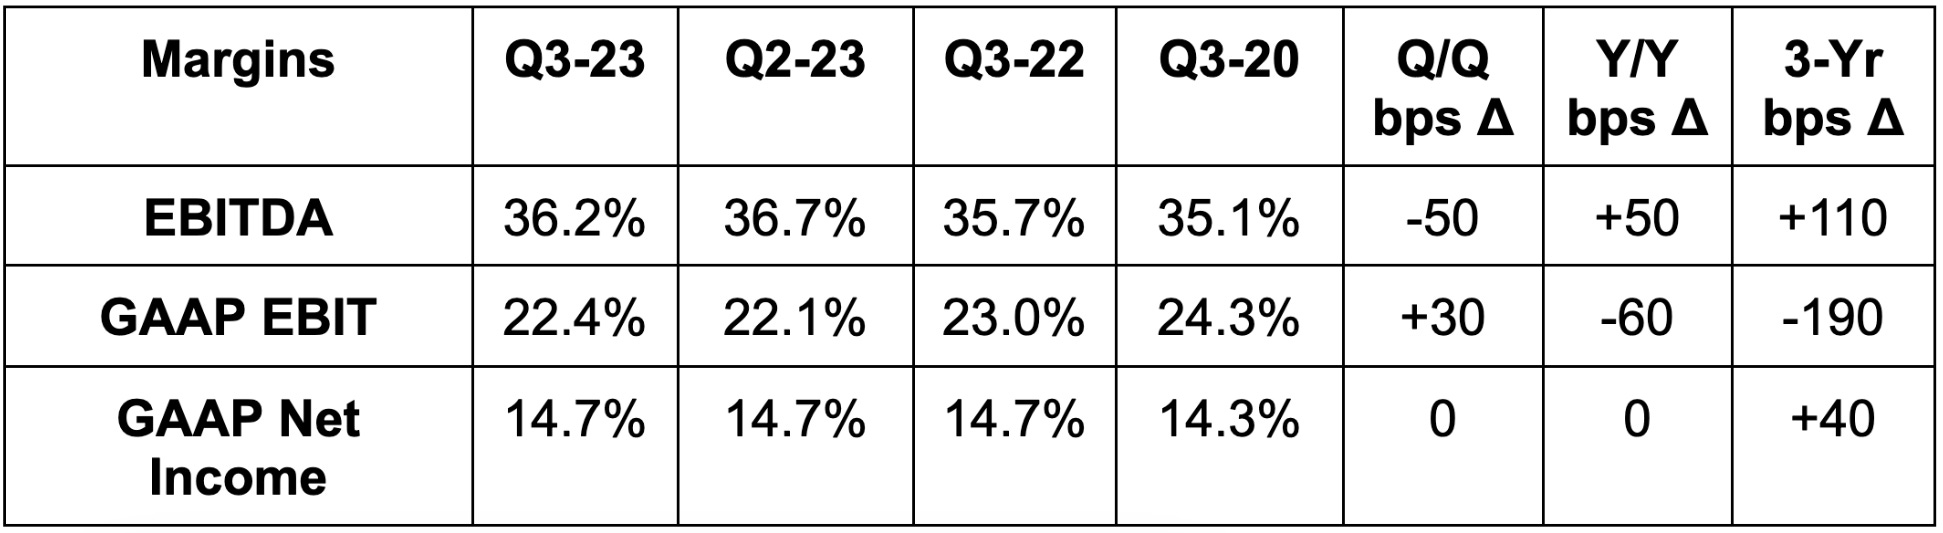
Guidance:
Verizon raised 2023 FCF guidance by 6% which was 4% ahead of estimates. It reiterated wireless service revenue growth of 3.5% Y/Y, adjusted EBITDA, $4.70 EPS guidance and an expected tax rate of 23.25%.
Balance Sheet:
Dividends up 2% Y/Y.
$147 billion in total debt.
$4.2 billion in cash & equivalents.
6. Material Portfolio Changes – Airbnb & JFrog Exits
I exited both Airbnb and JFrog this past week and wanted to explain why. The explanation for Airbnb is identical to why I trimmed 30% a few weeks ago. I continued to contemplate the risks that were bothering me and this quickly entered my “too hard” pile. The commentary then about what it would take to resume adding is what it would take for me to restart the position. To avoid repetition, that explanation can be found here.
I will continue to cover Airbnb as closely as I would a holding. I’d like to re-enter this name at some point down the road.
JFrog was the toughest sell decision I’ve ever had. The company is executing, and profits are compounding at a very compelling rate given the current multiple. It’s mission critical, owns most of the Fortune 100 as clients and has abundant up-sell opportunities. So what happened? This company was founded in Israel and has nearly half of its entire workforce in that nation. I’m going to do my absolute best here to stay emotionless and entirely focused on the investment case vs. geopolitics. I have my opinions here… you don’t need to hear them.
Its employees are relatively young, and many may be required to serve 2 years in the military while staying in reserves thereafter. Reserves are being called to action given the recent war that broke out this month. It is impossible for me to believe this isn’t causing a material disruption to its operations, pace of innovation and selling activity. I am a stock picker. I weigh financial risks when making investing decisions. What am I not? A geopolitical expert. I have no ability to get comfortable with this new risk as I have no clue how it will develop. That utter lack of certainty alone shifted JFrog from a core holding to my “too hard” pile. Wildly frustrating considering how deeply I believe in its investment case, but sadly necessary.
I will continue to closely cover this name. I would absolutely love to own it again if the Middle East is able to calm down a bit.
I used some of (not all of) these proceeds to add to SoFi, Shopify, Progyny, Disney, Amazon, Lululemon and Uber this week. I am leaning into a smaller core.
7. Disney (DIS) – India, ESPN & Film Delays
a. India
Over the last few weeks, I’ve covered several potential bidders for Disney’s India business. One of those bidders was Mukesh Ambani and Reliance Industries. This week, broad reports surfaced that Reliance and Disney are in late stage, multi-billion dollar negotiations to close this sale. It sounds like Disney will sell a majority stake in the Disney Star business valued at roughly $10 billion. It will maintain a minority stake. I’ve previously covered why I think this is such a good decision and will summarize those points here.
First, the cash infusion is a large positive. Several billion more in cash on the balance sheet would give Disney ample flexibility to invest in higher return businesses like domestic streaming, quality films and parks. India has not been a high return business for Disney. For example, the streaming service there enjoys less than $100 million in annual revenue. The business in that country overall loses significant money. It does not move the financial success needle and instead is a sharp deterrent to that success. This sale will immediately mean better margins with a large EBIT boost and a small revenue hit.
Not only does the India business not help its financials in any way, it dilutes the company’s focus. Disney’s core moat is in its intellectual property flywheel. You hear CEO Bob Iger discuss this constantly. It leverages its iconic franchises and brands with sequels, consumer packaged goods and loyalty activation at its parks. All of this raises its lifetime value ceiling and allows Disney to more deeply build fan connections. India does not at all work into this equation. Just like ABC (which it should also sell) is a puzzle piece that just doesn’t fit the investment case, India is too.
Some have argued that this is admitting failure in the important Indian growth market. Those critics are 100% right. Disney has failed to turn India into a compelling growth opportunity. This is why I’m glad it’s expected to maintain a less than 50% stake in the entity. It can use Reliance’s distribution and expertise in the region to take part in India’s growth without needing to steer the ship itself. It clearly cannot successfully steer that ship and it is time to wave the white flag. There are plenty of other value creators to focus on.
b. ESPN
This week, we heard very upbeat commentary on live sports from both Google and Amazon. Both pointed to strong viewership supporting the content investments they’ve made. Both hinted at making more of these investments in the future. That will innately make live sports bidding more competitive and pricier. These mega cap tech names have deeper pockets than Disney and more indirect mechanisms to monetize fan eyeballs than does Disney. So? This is why I find it imperative for Disney to partner with Amazon, Apple and/or Google on ESPN content and distribution. That’s expected to happen. It will ease the cost burden for its more limited balance sheet and will make bidding wars easier to win.
Along similar lines, Disney unveiled the new logo for its planned ESPN Bet gambling app. I’m excited to do some “product research.”

c. Film Delays
Like other studios, Disney announced changes to its film release schedule. The changes likely stem from writer and ongoing actor strikes. These strikes have prevented studios from utilizing actors for title marketing. It’s unclear if Disney’s more aggressive content curation approach under Iger has anything to do with the news. Here are the changes:
Removed Two unnamed Pixar films set for a 2025 release from the schedule.
Removed Magazine Dreams from the schedule two months before release.
Delayed Snow White live-action remake by a year.
Delayed Elio by 15 months.
8. Global Fintech Chaos
This sector simply cannot catch a break. 2 FinTechs in Europe (CAB Payments and Worldline) this week came out with alarming notes on financials being far worse than expected. CAB caters to money remittance in developing economies like Nigeria, which makes that less relevant to most FinTechs domiciled in North America. Worldline, conversely, does a lot of business in Germany and France where most FinTechs also generate a lot of revenue.

Specifically, PayPal, Adyen and Shopify all do a lot of business in Germany. That is a VERY important growth market for all of them and this is undeniably intimidating. Companies like Robinhood and SoFi are immune to this obstacle.
Considering this development, it was great to hear Visa’s and Mastercard’s forward-looking commentary. They continue to expect cross border volumes to grow at a healthy clip and did not call out abrupt worsening in Europe like these others did. This could just be a matter of struggling companies using exogenous factors as scapegoats and higher quality companies continuing to execute. I think that’s the case, but we’ll see when the rest report in the coming weeks. As a reminder, PayPal is on my do not add list as I wait for a transaction margin bottom. This news usually would be something I’d like to take advantage of. I’m just not willing to add to PayPal right now because of the other risks we’ve already covered in detail.
9. More Market Headlines
Uber (UBER):
Uber and Waymo announced a deepening partnership earlier this week. The deal includes sharing core competencies, Uber’s vast network and Waymo’s driverless tech, to shape the future of ride-hailing. This week, the first program went live in Phoenix with plans to enter more cities in the future. Autonomous competition was a real threat for Uber. It’s harder to compete with Tesla, Google and GM than Lyft. This insulates the firm from that competitive threat by making arguably the more formidable competitor a close friend.
CrowdStrike (CRWD):
CrowdStrike became the first AWS Marketplace independent software vendor to reach $1 billion in sales. Since partnering in 2018, CrowdStrike has enjoyed a 3,000% AWS revenue CAGR and contract sizes 140% larger than its other market channels. CrowdStrike and Zscaler partner here (as they so often do) to provide AWS customers with intuitively integrated and conjoined endpoint and network security. This outlet has been so impactful that CrowdStrike now directly focuses on AWS partner integrations to jointly go-to-market under AWS’s infrastructure. Microsoft is a fierce competitor, but AWS is a friend and Google is quickly becoming one as well.
Match (MTCH):
Parents and friends can now recommend matches on Tinder. Tinder is trying to become more open and social.
Shopify (SHOP):
Shopify released a holiday shopper survey that echoed what Amazon had to say about the consumer this week. People are more aggressively seeking out deals and are leaning more on technology like GenAI to more effectively locate purchases. Social channels as a source of commerce are, unsurprisingly, becoming much more popular. What’s more interesting is that brick and mortar shopping is still near the top in terms of desired shopping channels for product discovery. People like going to stores.
PayPal (PYPL):
PayPal sold Happy Returns to UPS. The deal terms were not shared. This was PayPal’s product to handle e-commerce returns. The news hints at new CEO Alex Chriss’s attempt to drive better focus. Some were worried about him trying to make large, unneeded M&A splashes but this points to his focus being better placed.
10. Macro
Output data:
Manufacturing Purchasing Managers Index (PMI) for October was 50 vs. 49.5 expected and 49.8 last month.
Services PMI for October was 50.9 vs. 49.8 expected and 50.1 last month.
Building Permits came in at 1.471 million which missed by 2,000 permits and compares to 1.541 million last month.
Core Durable Goods Orders M/M for September rose 0.5% vs. 0.2% expected and 0.5% last month.
Durable Goods Orders M/M for September rose 4.7% vs. 1.7% growth expected and 0.1% last month.
Q3 GDP rose 3.5% Q/Q vs. 2.5% expected and 1.7% last month.
Consumer & Employment data:
New Home Sales were 759,000 vs. 680,000 expected and 676,000 last month.
Pending Home Sales M/M for September rose 1.1% vs. -1.8% expected and -7.1% last month.
Initial Jobless Claims came in at 210,000 vs. 208,000 expected and 200,000 last month.
Personal Spending M/M for September rose 0.7% vs. 0.5% expected and 0.4% last month.
The Michigan Consumer Expectations reading for October was 59.3 vs. 60.7 expected and 66 last month.
The Michigan Consumer Sentiment reading for October was 63.8 vs. 63 expected and 68.1 last month.
Inflation data:
The 2-year note auction carried a 5.055% yield vs. 5.085% last month.
The 5-year note auction carried a 4.899% yield vs. 4.659% last month.
Core Personal Consumption Expenditures (PCE) Y/Y for September was 3.7% as expected and vs. 3.8% last month.
Core PCE M/M for September was 0.3% as expected and vs. 0.1% last month.
PCE Y/Y for September was 3.4% as expected and vs. 3.4% last month.
PCE M/M was 0.4% vs. 0.3% expected and 0.4% last month.
Michigan 1-year Inflation Expectations for October are 4.2% vs. 3.8% expected and 3.2% last month.
Michigan 5-year Inflation Expectations for October are 3% vs. 3% expected and 2.8% last month.
Inflation continues to fall while employment markets hang in there. Cyclical disinflation is never linear and this time will not be different. The important thing is that the trend towards 2% inflation overall continues. As that becomes more and more obvious, the Fed will more and more likely be done with tightening. There will be more fits and starts, but we are moving in the right direction.
Whether it hikes rates one more time or not and whether the first cut comes a month later or not is not paramount to my investing process. It was in 2022 when the debate was between 5 or 10 or 20 more rate hikes and if runaway inflation was likely. That’s no longer part of the dialogue. So? I will continue to lean in as sentiment worsens and as pundits overreact to single data points. I will also trim a bit more readily than I normally do as macro and geopolitical uncertainty remains elevated and as inflation has more needed progress to enjoy. I’ll do all of this while staying predominantly invested as always. Balance.
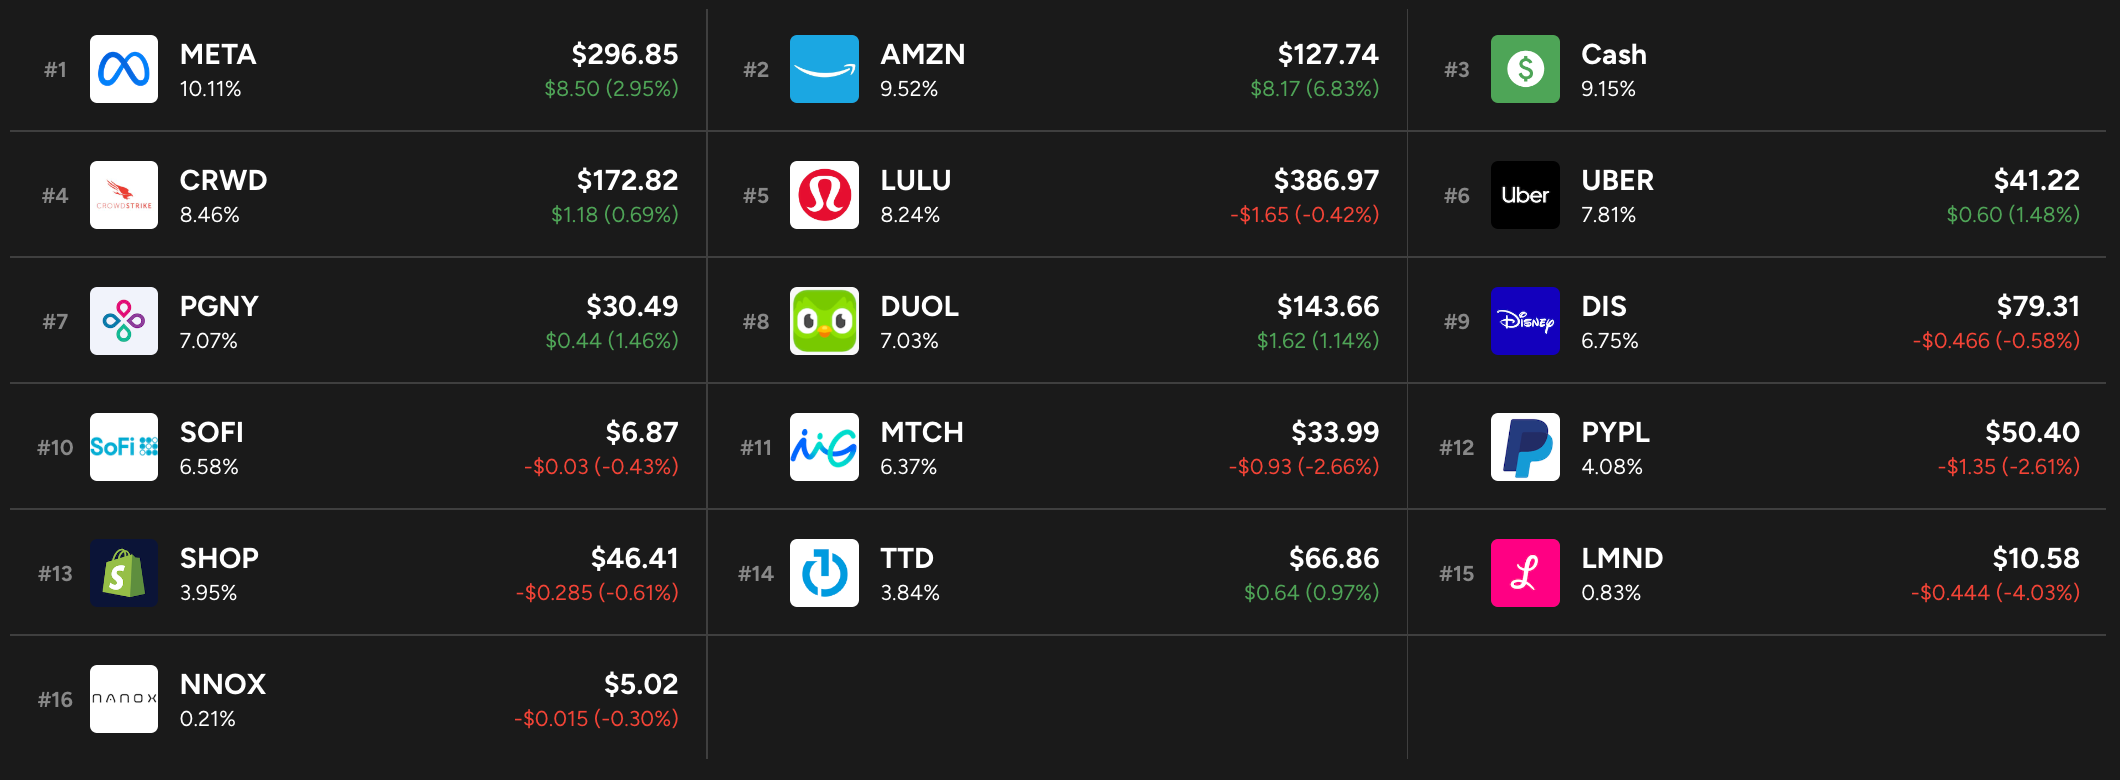
11. Updated Portfolio
See section 6 for transaction commentary
Absolutely love your earnings breakdowns and outlook. Fantastic work!
Love you're news of the week articles ! Very rich in information. Thank you 🙂👍