Discover more from Stock Market Nerd
News of the Week (July 31 - August 4)
Match; JFrog; Lemonade; Progyny; Apple; AMD; MercadoLibre; Cloudflare; Block; DraftKings; Fortinet; Portfolio
What an absolutely crazy week this was. If you blinked, you probably missed something. Luckily, I do not blink (ok, maybe I do). We covered the following earnings reports during the week:
We did not have time to get to the Revolve Group this week. After digging through the financial statements, it looked as ugly as we expected considering its young, aspirational customer and high price point. We have zero plans to trim and may entertain adding to the stake after getting through the rest of the report. We owe you a full review there in next week’s article or we may sneak it into The Trade Desk review mid-next week.
1. Match Group (MTCH) -- Q2 Earnings Review
a. Demand
Beat revenue estimate by 2.3% & beat guide by 2.4%.
Foreign exchange (FX) hit revenue growth by 180 basis points (bps; 0.01%). This was compared to an expected hit of just 100 basis points, yet it still comfortably beat revenue expectations and guidance.
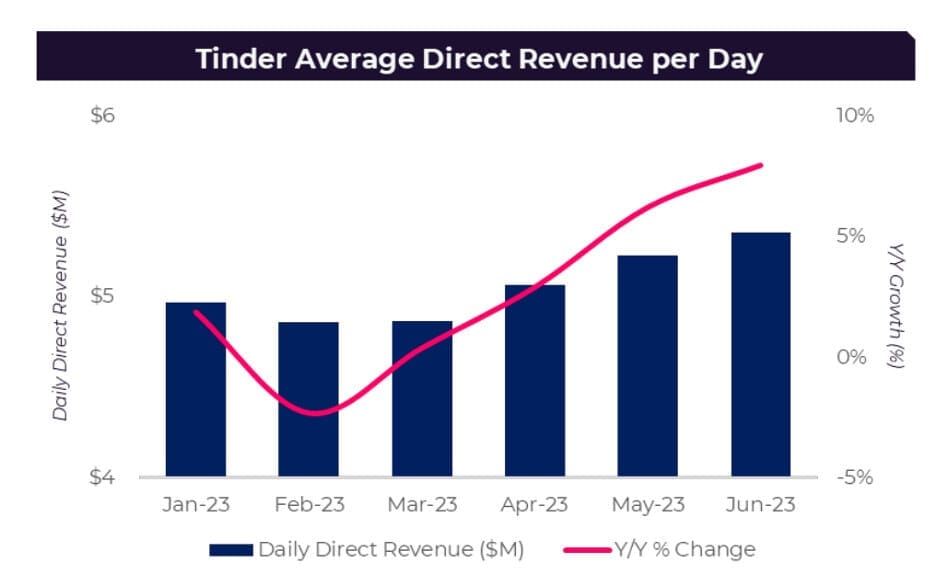
Tinder direct revenue growth of 6% Y/Y beat low single digit growth guidance. Payers fell as part of the price hike strategy to maximize revenue.
Hinge met guidance of accelerating Y/Y growth vs. last quarter with 35% Y/Y growth vs. 27% Y/Y growth last quarter.
Match Group Asia beat FX neutral 0% growth guidance with 2.5% Y/Y growth.
Demand Context:
Rapid revenue per payer progress is the result of recent price hikes while the payer decline was due to the same thing.
6.2% Y/Y FX neutral (FXN) revenue growth
Tinder Direct revenue up 6% Y/Y (7% FXN); Hinge revenue rose 35% Y/Y to reach $90 million; Match Group Asia revenue fell 4% Y/Y (+2.5% FXN growth) while emerging and evergreen brands saw revenue fall 5% Y/Y.
Revenue in the Americas rose 5% Y/Y, 9% Y/Y in Europe & -3% Y/Y in APAC.
b. Margins
Beat EBITDA estimates by 8% & beat guidance by 8.5%.
Beat GAAP EBIT estimate by 7.7%.
Beat $0.45 GAAP earnings per share (EPS) estimate by $0.04.
Margin context:
$441 million legal settlement charge for Tinder litigation in Q2 2022 hit cash flow margins.
Marketing spend was flat at 16% of revenue Y/Y and so was R&D.
In-app payments rose 140 bps as a percent of revenue.
As Tinder is the firm’s highest margin product, its outperforming demand yields outperforming profits as was the case this quarter.
c. Outlook
Next quarter:
Revenue guidance was 1.8% ahead of estimates and represents 8.5% Y/Y growth at the midpoint (6.5% Y/Y growth FXN).
Tinder revenue to rise 10% Y/Y. Growth was not expected to reach 10% Y/Y until Q4, so this is a full quarter ahead of schedule. Love it.
Hinge to keep accelerating beyond 35% Y/Y growth.
Hyperconnect to keep showing improvement but Pairs won’t.
Includes a 200 bps FX TAILWIND.
Indirect revenue (ads) to rise Y/Y as the demand environment improves.
RPP growth to continue accelerating beyond this quarter’s 9.8% Y/Y growth result.
EBITDA guidance was 2.0% ahead of estimates.
Marketing intensity to rise 200 bps Y/Y to support Tinder, Hinge, The League and Archer.
Q/Q payer growth to still be negative but to moderate vs. this quarter’s -184,000 result. It continues to build back momentum and roll out the pricing increases across the U.S. It’s on track to return to positive user growth in the coming quarters. Still, payer growth will be negative until the first half of 2024 as only 50% of its U.S. user base has had their prices changed to date.
Full year:
The team is increasingly confident in its ability to exit the year at 10%+ Y/Y growth at Tinder and overall. It added that growth will be “solidly double digits” in what could be interpreted as a small raise. It also improved its EBITDA margin guidance from flat or better Y/Y to just better Y/Y. The team hinted at 50 bps of Y/Y expansion expected. Strong. All of this led to a 6.5% Y/Y 2023 growth guide with analysts expecting 5.5% Y/Y growth and vs. Match’s previous guidance of near 5% Y/Y growth. Love it.
“If Tinder delivers solidly double digit Q4 growth, it’s logical to think the overall company will deliver growth similar to that.” -- CFO Gary Swidler
d. Balance Sheet
$741M in cash & equivalents.
$3.9B in total debt.
Net leverage sits at 2x which is better than its 3x goal.
$33M in buybacks as it started its $1 billion buyback program.
“We began buying back shares in the open window after our last earnings call, but we weren't able to buy back as many shares as we had intended over the past 3 months due to the strong stock price run-up, which occurred after the window had closed. We will revisit buybacks again after this call.” -- CFO Gary Swidler
e. Call & Letter Highlights
Momentum:
New CEO Bernard Kim called the quarter evidence of an “ability to reignite momentum” at Match. Organizational improvements to accelerate product testing and sharpen focus are bearing fruit. That’s the cause… The strong results are the effect. Kim called the team more “stable, focused, and united.”
Tinder:
Tinder is the first, second and third most important asset at Match today. Signs of a turnaround are now evident. The Q1 marketing campaign (“it starts with a Swipe”) to take back its brand narrative directly led to revenue and user trend improvements. This was especially true with younger females which is ideal for driving better ecosystem balance. Sign-up growth spiked higher exactly when this campaign started:
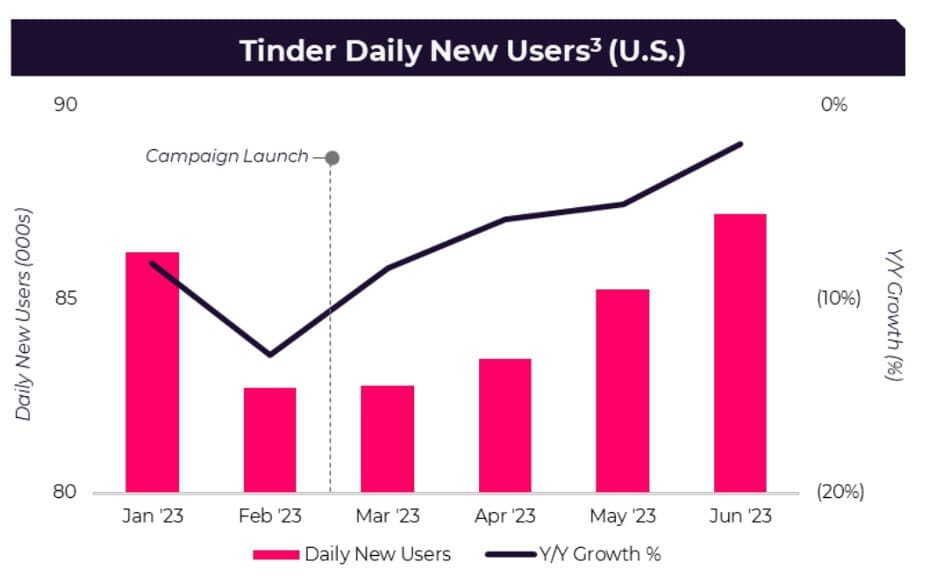
When taking that tailwind together with weekly subscriptions working wonders along with price hikes, Tinder’s growth continued to “accelerate throughout the quarter.”
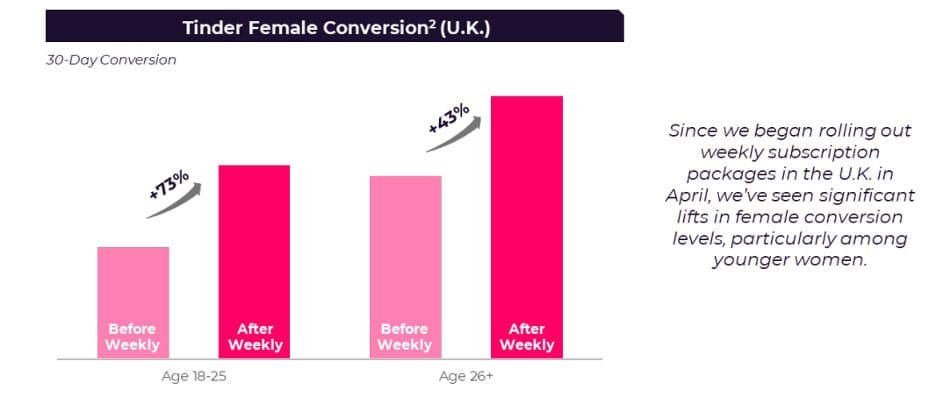
Tinder will debut weekly subscriptions globally this quarter. These weekly subscriptions are raising paid conversion ESPECIALLY FOR FEMALES resulting in a better app gender balance.
The team is now developing a new user experience to cater to Gen Z. This is expected to bolster “authenticity” by making self-expression easier and more data driven. It will make it easier to customize profiles with best picture recommendations and quizzes. The core swipe feature that made Tinder famous will remain as this rolls out in August.
Importantly, churned users from the price increases are still staying on the platform as non-paying users.
The team is “increasingly optimistic about the long-term trajectory.”
It tested the same pricing initiatives in international markets which didn’t deliver any benefit. That’s inevitable when you ramp split testing. Strikeouts are ok. Maximize quality at-bats. One experiment won’t work… others will.
Will roll out its ultra-expensive subscription tier for power users later this year. This could deliver “tens of millions” in annual incremental revenue.
“Tinder outperformed our expectations in the quarter as the revenue momentum we saw from price optimizations in the U.S. and weekly subscriptions over-delivered.” -- CEO Gary Swidler
Hinge:
Payer growth was 24% Y/Y to reach 1.2 million while RPP crossed $25 (vs. $5 when Match bought it). Downloads rose 50% Y/Y as its global expansion efforts work like a charm. Incredibly, it’s already a top 3 dating app in 14 countries (with Tinder and Bumble the other two in most markets). This is just a year into the initiative. Revenue is on pace to grow 40% Y/Y to pass $400 million annually. Match paid $150 million for Hinge in 2019. What a purchase.
“Product market fit is clear in every market thus far.” -- CEO Bernard Kim
Match Group Asia:
Azar revenue rose 24% Y/Y while Pairs and Hakuna struggled. Azar’s new AI-powered matching algorithm was credited for the delightfully surprising growth. It’s raising engagement and monetization. While Match overpaid for Hyperconnect, it’s not just the apps it got. Match also got a large team of engineers who are now actively working on product upgrades and unification across ALL Match Group properties. Plenty of Fish will run live streaming through Hyperconnect and Tinder’s work in AI will be thanks to Hyperconnect. It wasn’t a zero. Still not a great purchase from the old team.
“Given Hyperconnect’s strong reputation in Korea, we expect to grow the engineering team more quickly & effectively than we could in other markets.” -- CEO Bernard Kim
Pairs continues to struggle in Japan as that market remains weak and the dating stigma strong. It’s the leader there, but leading isn’t all that lucrative right now. The team is “re-evaluating brand strategy to raise growth.” It thinks now that dating app TV marketing is legal in the country, it can begin to see better momentum. We’ll see.
AI:
“We’re approaching AI very thoughtfully as dating requires unique considerations. It's imperative that our features and tools enhance trust, authenticity and respect and, ultimately, lead to better matches and dates in real life… By the end of the year, we expect to have launched a number of initiatives that will use generative AI to eliminate awkwardness, make dating more rewarding and surprise and delight users, all in a way that focuses on authenticity and maintaining the highest ethical and privacy standards.” -- CEO Bernard Kim
Things like profile creation are real points of friction for new users. Match will roll out tools such as AI-powered photo selection algorithms to make it more seamless.
Emerging & Evergreen Brands:
Match is working on a long-term project to eliminate redundant costs by operating all legacy brands under a shared tech stack. It has moved two brands as of today, but this project will take it another 18 months to complete. Cost savings will be realized as this takes place.
Archer launched in New York City and will be live across the nation by 2024. It will focus on user growth first and revenue second.
f. Takeaway
This was the quarter where the new team started to put everything together. Split test acceleration is bearing fruit, rational marketing campaigns are working, cost cuts are continuing and its two most important apps (Tinder & Hinge) are both meaningfully accelerating. It’s good to own 50%+ share of a global market set to grow by nearly 10% annually for the foreseeable future. It’s good to be Match. Some people took negative price action to mean the category was saturated and the company was a dinosaur. Not even close.
This was a gratifying quarter for me personally as I’ve defended the investment case through the worst of the stock’s volatility.
2. JFrog (FROG) -- Earnings Review
a. Demand
Beat revenue estimates by 1.4% & beat guidance by 1.4%.
Met cloud revenue estimates.
Demand Context:
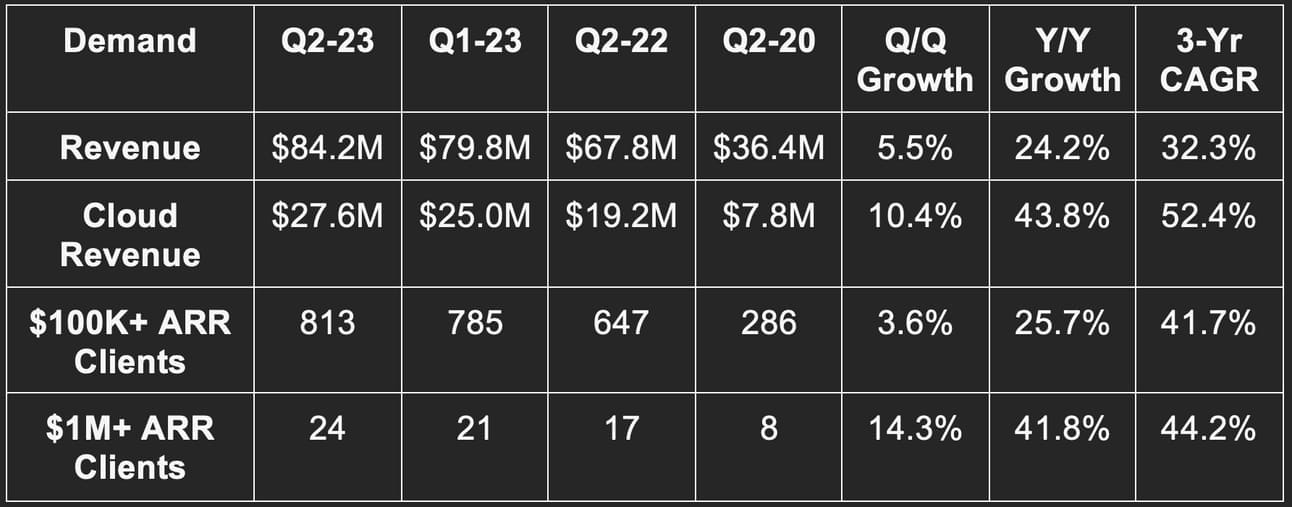
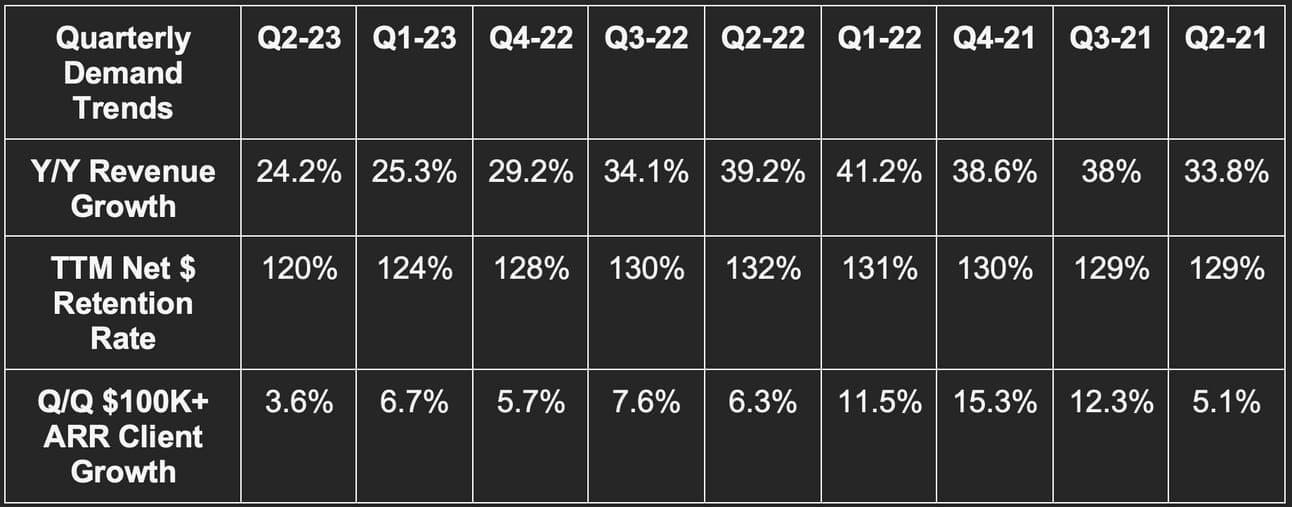
32.3% 3-yr revenue CAGR vs. 34.5% Q/Q & 35.5% 2 quarters ago.
Cloud revenue = 33% of total vs. 21% Q/Q and 28% Y/Y.
JFrog Platform Enterprise+ (full suite subscription) = 45% of revenue vs. 44% Q/Q and 36% Y/Y.
Gross retention is stable at 97%.
b. Margins
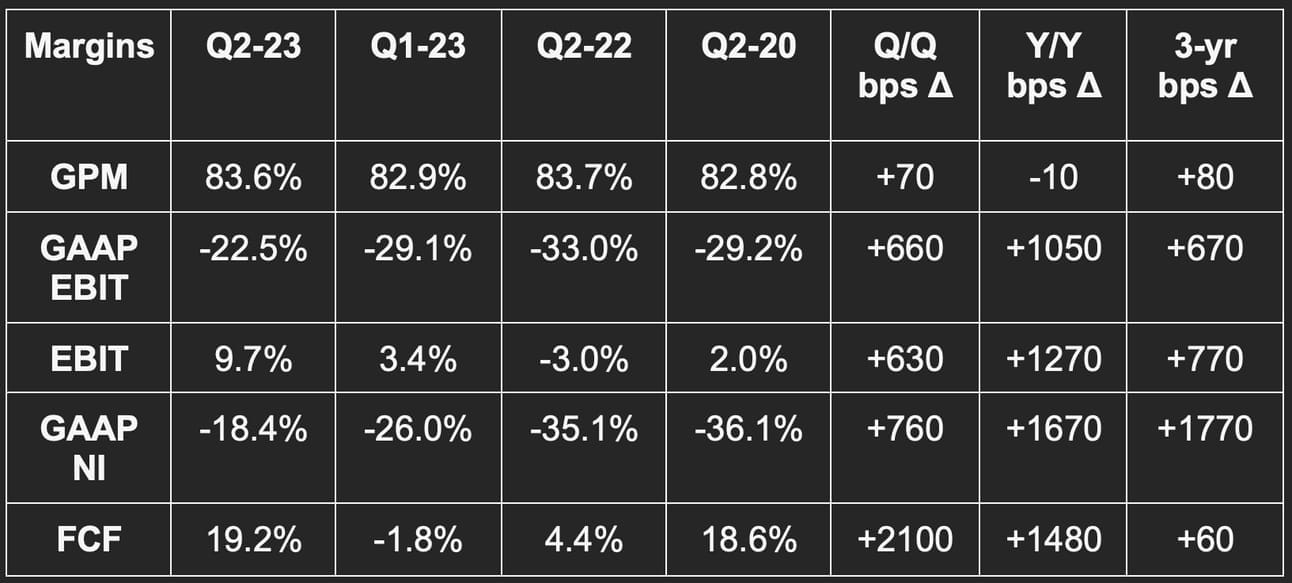
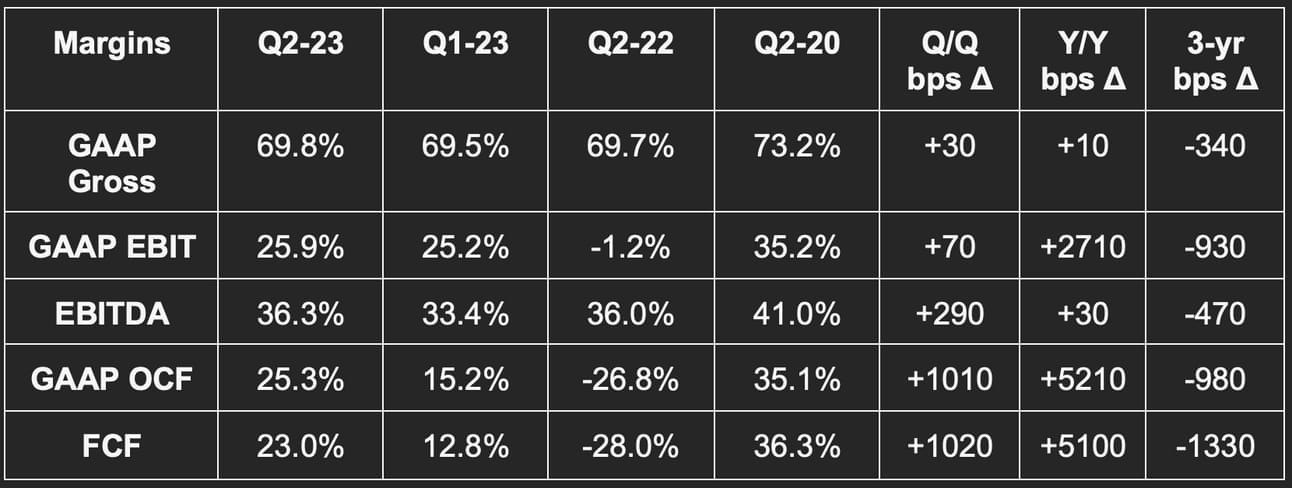
More than doubled EBIT estimates of $3.5 million.
More than doubled EPS estimates of $0.05.
Beat FCF estimates by 70.5%.
Margin context:
Gross margin is supposed to move towards 80% over time as its cloud business grows at slightly lower margins vs. on-premise.
EBIT margin was helped by moving some Q2 OpEx to Q3. Still, its large annual EBIT guidance raise points to this not being a matter of timing, but efficiency.
c. Guidance
Next Quarter:
Met revenue estimates.
Beat EBIT estimates by 22.6%.
Beat $0.04 EPS estimates by $0.045.
Strong cloud consumption trends continued through July.
Full year:
Raised revenue guidance by 0.3% & beat estimates by 0.3%.
Raised EBIT guidance by 25.6% & beat estimates by 26.2%.
Raised $0.20 EPS guidance by $0.12 & beat estimates by $0.11 or more than 50%.
Reiterated mid 40% cloud revenue growth Y/Y.
Reiterated low double digit FCF margin for the year.
d. Balance Sheet
$470M in cash & equivalents
Share count was up 3.5% Y/Y (being hit by some M&A).
No debt.
e. Call & Release Highlights
Security:
Since JFrog Advanced security was rolled out for hybrid deployment last quarter, momentum has been strong. It has already added dozens of notable up-sells to client subscriptions with a rich forward-looking pipeline. While X-ray brought software composition analysis to JFrog’s tool kit, newer services like contextual analysis/protection and code security have been popular selling points here… especially thanks to the native binary management tool (Artifactory) integration which allows JFrog to be a customer’s “single source of record.” Growth within this product bucket was cited as a central reason for the outperformance.
In other security news, JFrog recently launched JFrog curation. This is based on the reality that 90% of software packages now utilize open-source libraries of source code. This new tool allows customers to guard their software ecosystems against malicious open-source code (like Log4J). It seamlessly automates the scanning and authorization of open-source code before it even enters a company’s infrastructure to ensure no policy violations and proper hygiene. The product will be sold on a per-seat basis with a market essentially the size of all software developers and little competition today.
It’s now actively marketing these new tools to existing clients approaching renewal dates.
Interestingly, a security solution being managed on-premise is more common than its other product categories. So? JFrog sees this accelerating on-premise revenue growth from the 17% Y/Y figure it posted this quarter.
Cloud Consumption:
JFrog sees the wave of cloud usage optimization as largely behind it just like we heard from Amazon this week. Accelerating cloud consumption was the other notable driver of JFrog’s successful performance along with security proliferation.
“We are pleased with improving usage trends during the first half of 2023.” -- CFO Jacob Shulman
Client Wins:
A Fortune 100 and top 5 healthcare and retail company (CVS or Walgreens?) moved from Google Container Management and Sonatype’s Artifactory competitor to JFrog. It wrapped up a proof of concept which motivated them to add even more JFrog products.
A “leading biopharma” company is going with JFrog to overhaul its supply chain. It’s adopting the full platform.
Generative AI:
As the de facto binary repository for software packages, generative AI will be a large tailwind for JFrog’s business. Products like Copilot and CodeWhisperer are making code creation as easy as arithmetic. That will mean much more code creation and all of this code will be stored as binaries. Large Language Models (LLMs) are voracious consumers of data and code… JFrog will fully take advantage. All source code languages that will be used to write generative AI code are integrated into JFrog’s ecosystem.
f. Takeaway
Solid quarter. Security products are gaining rapid traction which offers JFrog yet another source of revenue expansion and demand runway. It’s trimming costs and seeing margins explode higher while not seeing much of an impact on demand. Churn is minimal, 3-year return on investment is over 400% and pricing power is real. This platform is mission critical and it showed this quarter. Some software names like Zoom Info blamed poor macro on poor results. JFrog cited improving macro as a boost to its own results.
3. Lemonade (LMND) -- Q2 Earnings Review
a. Demand
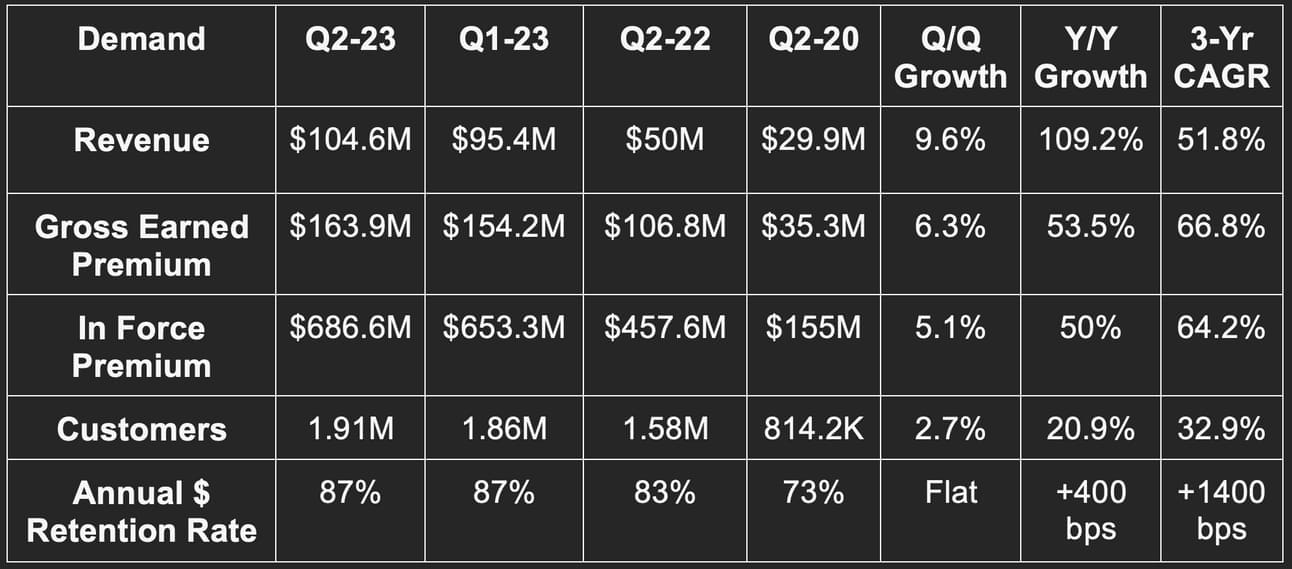
Beat in force premium (IFP) guidance by 3%.
Beat gross earned premium (GEP) guidance by 4.4%.
Beat revenue estimates by 7.2% and beat guidance by 7.8%.
Demand Context:
Q3 2022 inorganic contribution from Metromile M&A. Organic growth was 28% Y/Y.
Premium per customer up 24% Y/Y.
Ceded 53% of premiums to reinsurers vs. 71% Y/Y.
b. Profitability
Beat EBITDA estimates by 5.6% & beat guidance by 6.7%.
Beat GAAP EBIT estimates by 6.1%.
Beat -$1.02 GAAP EPS estimates by $0.05.
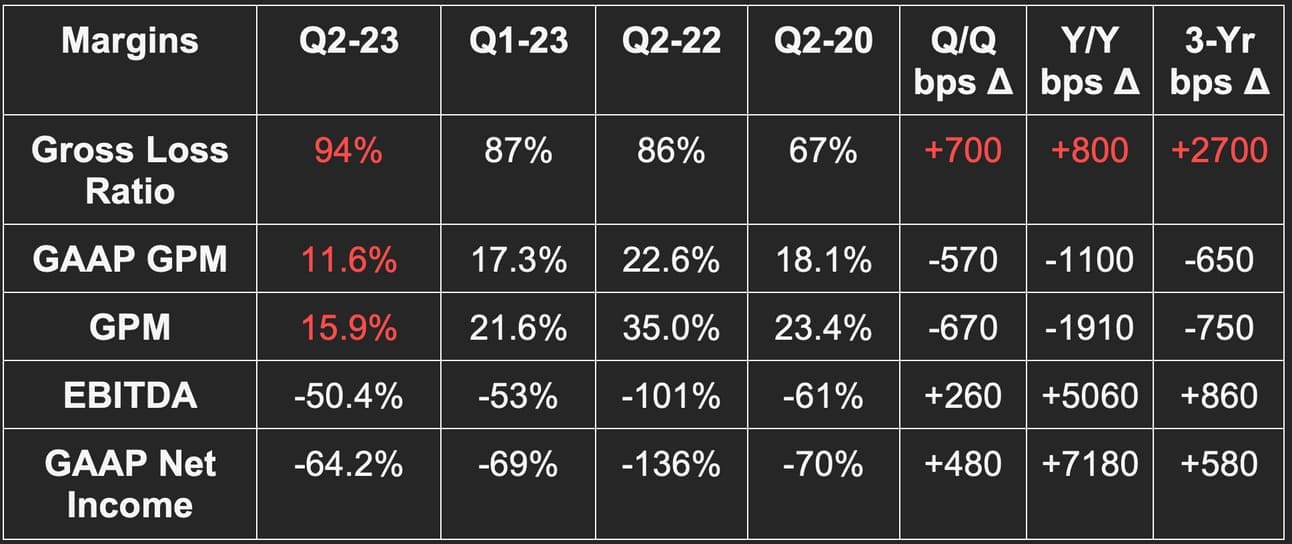
Margin Context:
OpEx rose just 8.9% Y/Y and was driven by adding Metromile’s cost base.
c. Guidance
Next Quarter:
Revenue beat estimates by 0.6%.
EBITDA beat estimates by 11%.
Full year:
Raised IFP guidance by 1.4%.
Raised GEP guidance by 1.3%.
Beat revenue estimates by 1.5% & raised guidance by 2.8%.
Beat EBITDA estimates by 4.3% & raised guidance by 2.5%.
Raised stock compensation guidance from $60 million to $62 million but reiterated share count guidance.
Interestingly, the new guidance does not contemplate more favorable rate approvals for hiking premiums or its new synthetic agent program (both discussed below). These could provide more upside.
d. Balance Sheet
$942 million in cash & equivalents.
Share count up 12.5% Y/Y due to purchasing Metromile.
No debt.
Headcount has been flat for 3 quarters.
e. Call & Letter Highlights
Reinsurance:
Lemonade extensively talked about its new reinsurance contract. As a reminder, its quota share level under the recently renewed agreement will stay at 55% while the deal was met with “oversubscribed demand.” This is despite 2023 being one of the most difficult reinsurance markets in decades. There were a few tweaks to the new contract that hint at Lemonade needing to make a few concessions to get this done. Well, concessions would be the glass half empty view. The glass half full view would be its growing scale making it comfortable retaining slightly more risk. As of the new deal, named hurricanes are now excluded from the contract and Lemonade set a $5 million cap per catastrophic event. It thinks these are “risks it can comfortably bear.” Finally, the new agreement features a sliding scale commission vs. fixed commission under the old arrangement.
“From a capital perspective, the agreements mean we’re set to grow and go the distance.” -- CFO Tim Bixby
Inflation:
While the reinsurance uncertainty has been resolved, inflation and rate change filings are still holding back Lemonade’s financials. As a refresher, claims float freely with inflation but premiums do not. So? As price increases lead to more expensive claims, loss ratios rise. The way to remedy this is via rate change filings with regulators. Unfortunately, as always, regulators move very slowly to approve. Lemonade is enjoying a faster rate of approvals vs. its larger competition because of its automated application processes & responses.
Regardless, as of now, just 50% of its approved rate hikes have been implemented. Encouragingly, California (where it does a ton of business) just approved 30% and 23% spikes to home and pet premiums which is expected to significantly diminish loss rates and boost gross margin. It still takes time for all of these hikes to get implemented. Only when plans are renewed can pricing change; this takes a full year to fully cycle through. Car insurance allows for biannual rate updates, but no other product line does.
While this process is taking place, Lemonade loss ratios are suffering. That, paired with an abnormally tough quarter for natural disasters, was why the Lemonade loss ratio spiked (just like other insurers). Some argue that its AI should mean it’s immune from this. Two notes here. First, it’s not immune, just more resistant which will become truer with scale. Secondly, its AI algorithms are working perfectly with pricing plans. It really is just a matter of getting desired premium increases approved. Cooling inflation will help too.
Until filings are approved and implemented, Lemonade will continue to forgo some new policy growth. These policies will not be cash flow positive until premiums are pushed higher, and for now Lemonade is playing a waiting game and intentionally slowing down demand.
“We think we’ll be ready to accelerate growth in 2024.” -- CEO Daniel Schreiber
Loss Ratios:
While the overall loss ratio looked understandably ugly this quarter, per product loss ratios continue to look very promising. This was its first quarter with a sub 60% loss ratio in renters, a sub 80% in Pet and a sub 60% loss ratio in home when assuming a normal cadence of CAT events. Things are moving in the right direction and underwriting quality is where Lemonade wants it to be. Just need regulators to move more quickly.
CAT-related losses 4Xed Y/Y.
CAT raised its gross loss ratio by 21 points this quarter.
Synthetic Agents:
As previously announced, Lemonade struck a new arrangement with General Catalyst (an early investor) to finance up to 80% of its customer acquisition costs. This effectively solves for Lemonade’s working capital gap. Its growth spend comes with a very compelling 3x lifetime value to customer acquisition cost (LTV/CAC) ratio, but the payback period is 24 months. In today’s elevated cost of capital environment and with Lemonade’s still deep cash burn, it’s been forced to choose away from high quality growth to preserve its cash pile. As a reminder, it has committed to breakeven profits before any more capital raises.
The creative arrangement will raise Lemonade’s internal rate of return on CAC from 50% to 90% and will enable it to accelerate growth while preserving cash. That will lead to Lemonade raising its 20%-25% multi-year revenue CAGR and accelerating its path to profitability in the near future. Still, it will not fully utilize this new financing until regulatory filings are approved for premium hikes. That is simply imperative. Can’t be overstated.
When pairing this partnership with its Chewy pet insurance relationship, the team has shown a savvy ability to get more asset light and lean into growth without depleting cash.
It offered an example of CAC spend with and without these agents and the impact on cash flows. Looks good to us:
How this will work:
Lemonade gets up to 80% of CAC financed.
16% of premiums underwritten from these investments are repaid to General Catalyst until it’s paid in full and gets a 16% IRR (should take 2-3 years).
Lemonade keeps all premiums afterwards (unlike if it used traditional agents who get perpetual commissions).
If the premiums from the financed cohort don’t pay back General Catalyst in full, General Catalyst has no legal recourse.
All financed CAC is expensed as sales & marketing.
Cash paid to Lemonade will show up as a balance sheet liability. As it pays General Catalyst, that liability will be reduced and it will record the cost as interest expense.
Home:
Lemonade’s underwriting algorithms identified a chunk of older originated home loan policies that shouldn’t have been issued. It’s letting these policies expire which will hit retention and demand but improve loss ratios.
Car:
Metromile retention as it became Lemonade Car was better than expected.
This was the last post MILE quarter comping vs. a pre-purchase period. So? Growth will normalize in Q3 and will not be inorganically supported.
f. Takeaway
While Lemonade the stock sold off aggressively after the report, Lemonade the company continued to execute. I deeply support the synthetic financing arrangement and am encouraged by continued EBITDA outperformance despite what was a very tough quarter for the sector. This company is maturing before our eyes and doing so amid a chaotic backdrop. It’s exciting to think what results will look like in the future when headwinds begin to abate. Loss ratios are improving, demand remains very strong despite intentionally slowing down, and the company is gearing up to raise its long-term growth and profit forecasts. What else did you want from them this quarter?
That’s all I was hoping for, and I used the aggressive stock decline to add to my very small stake. Great performance from the team here and a falling share price will not change that opinion.
4. Progyny (PGNY) -- Q2 2023 Earnings Review
a. Demand
Beat revenue estimate by 6.6% & beat guide by 6.4%.
Demand Context:
Utilization rate drives Progyny’s revenue. This quarter represents a 2-yr record for the metric.
VERY easy 3-year comps due to the pandemic temporarily halting new treatment cycles in Q2 2020.
62.9% 3-yr revenue CAGR vs. 47.2% Q/Q & 48.8% 2 Qs ago.
Un-billed accounts receivable up just 6% year to date.
Female utilization also spiked higher Y/Y from 0.44% to 0.50%.
As of today, it has 390 clients.
90% ProgynyRx client attach rate vs. 84% Y/Y.
Assisted Reproductive Treatment (ART) cycles rose 42% Y/Y.
b. Profitability
Beat EBITDA estimate by 6% & beat guide by 6.1%.
Beat $0.10 GAAP EPS estimate by $0.05 or 50%.
Margin Context:
17.3% incremental EBITDA margin vs. 21.7% Y/Y.
New Rx contracts changed the firm’s typical cash flow seasonality.
Sales & marketing was 5.5% of sales vs. 5.9% Y/Y.
General & administrative was 10.8% of revenue vs. 12.1% Y/Y.
c. Full Year Guidance
Raised 2023 revenue guide by 2.8% & beat estimate by 2.7%.
Raised 2023 EBITDA guide by 2.8% & beat estimate by 2.3%.
Raised 2023 $0.45 EPS guide by $.07 & beat estimate by $.07.
An incremental EBITDA margin of 20%+. This was wonderful to hear as this quarter’s incremental margin was softer than we’ve seen in recent quarters.
d. Balance Sheet
$282.5 million in cash & equivalents.
No debt.
Diluted share count rose 0.9% Y/Y.
e. Call & Release Highlights
Macro Tailwinds:
Remember when the Progyny bear case was the falling birth rate? Maybe people should have looked into WHY that rate was falling. It’s mainly a matter of better career opportunities for women and so later pregnancies. That’s why the birth rate for women over 35 keeps rising and why treatment cycle growth accelerated from 10.5% annually over the last decade to 11.8% over the last 2 years despite the pandemic. 2.3% of babies were conceived from assisted reproductive treatment vs. 2% Y/Y which was the “largest Y/Y increase ever.” Macro tailwinds are raging, and this company’s outcome and cost leads let it take full advantage.
Selling Season:
The company is on track to add more members and covered lives in 2024 than it will this year. Its pipeline growth is strong, early commitment growth is strong with a few bellwether wins, renewal rates are strong, expansion rates are strong. It’s all strong.
ProgynyRx:
Progyny renewed and updated contracts with its Rx partners this quarter. These updates were all favorable in terms of take rate and shrank the cash collection cycle from 150 days to 90 days. This led to higher cash collection this quarter which helped OCF margin. But this is not just a one-off event. The more favorable arrangement means lower working capital needs, lower accounts receivable and should lead to EBITDA to cash flow conversion rising from about 65% to 75% starting in 2024.
The team was asked why a client would go with ProgynyRx over a player like Optum. It comes down to a few things: integrated fertility benefit service, faster med authorization (very time sensitive) and reduced waste (less over dispensing) by 13% are key selling points.
It’s seeing zero pressure from pharmacy benefit managers on rebate sharing. The renewed contracts at more favorable terms for Progyny serve as evidence.
Gross Margin:
Gross margin fell intentionally. As previously explained, Progyny is deepening its large value leads over the competition by holding its costs flat Y/Y while medical service inflation remains sky high.
Outcomes:
For the 7th straight year, CDC outcome data shows Progyny growing its outcome leads across all key performance indicators (KPIs) vs. the industry. Better outcomes mean happier members and lower costs for clients due to less treatment and Neonatal ICU (NICU) needs.
Menopause:
Progyny expanded its services covered to Menopause this quarter with Gennev and Midi Health as partners. This is the fastest growing care support category among large employers with 40% of working women over the age of 45.
Utilization:
The company tried to tell us spiking utilization was due to pulling forward treatment before summer vacations… but the Y/Y spike is wildly encouraging and says otherwise.
f. Takeaway
What an easy company to own. A sector market share leader is also the cost leader… also the outcome leader… and also the profitability leader vs. all other carved out alternatives. Macro tailwinds are raging while the micro investment case continues to be very compelling. There’s nothing bad to pick on here… only positives to celebrate. I passionately defended this company following multiple short reports. I was right to do so.
5. Earnings Roundup
Here, we will cover notable earnings reports from non-holdings. As we had 18 of these to cover in total this week (and the collective “we”, meaning “me” on the research and writing side), we/me were not able to read through every call in detail.
a. Apple (AAPL)
Results:
Met revenue estimate.
Beat EBIT estimate by 1.3%.
Beat 44.3% GPM estimate by 20 basis points.
Beat $1.19 GAAP EPS estimate by $0.08.
Balance Sheet:
$166B in cash & equivalents.
$98.1B in long term debt.
Returned $67B in shareholders YTD vs. $76.1B.
Year to date operating cash flow of $88.9 billion vs. $98 billion Y/Y.
Context:
Subscriptions crossed 1 billion with record quarterly service revenue.
Install base at record highs in all geographies.
Revenue rose Y/Y for services and wearables and fell for iPad, Mac and iPhone.
Fx neutral revenues rose about 3% Y/Y.
Apple’s high yield savings product crossed $10 billion in deposits.
b. AMD (AMD)
Semiconductors are inherently tied to economic cycles. Demand explodes when times are good and tanks when they’re bad.
Results:
Beat revenue estimates by 0.8% & beat guidance by 1.1%.
Roughly met gross margin (GPM) estimates & guidance.
Missed EBIT estimate by 0.5% but beat EBIT guidance by 1.7%.
Met GAAP & non-GAAP earnings per share (EPS) estimates.
Demand Context:
40.6% 3-yr revenue CAGR vs. 44% Q/Q & 38% 2 Qs ago.
Data center revenue fell 11% Y/Y, Client revenue fell 54% Y/Y as PC demand was weak and inventory gluts were worked through. Gaming revenue fell 4% Y/Y via graphics weakness, but Embedded revenue rose 16% Y/Y as sectors like Healthcare and Industrials were both strong.
“AI engagements” (whatever that means) rose 7x Y/Y and it is on track to launch its latest instincts accelerator for AI workloads this year.
Azure is using AMD’s latest high performance computing platform to 5x performance vs. the old generation. AMD also doubled Azure’s cloud app performance with its Bergamo product. Meta will use this for its data centers as well.
Weak enterprise demand is hitting many of its revenue buckets. Semiconductors are notoriously cyclical, and this is a tougher part of the current cycle.
Margin Context:
Xilinx amortization hitting GAAP margins last Q & this Q. It took a $693 million hit for amortizing acquired intangibles which shaved a full $0.42 (or $693 million) off of its GAAP net income. This is why there’s such a large difference between GAAP EPS at $0.02 and adjusted EPS at $0.58.
Gross margin was impacted by its higher margin client revenue weakness while embedded strength helped offset a bit of the weakness.
Data center EBIT margin was 11% vs. 32% Y/Y; Client EBIT margin was -7% vs. 32% Y/Y; Gaming EBIT margin was 14% vs. 11% Y/Y (thanks to strong semi-custom revenue to offset graphics weakness); Embedded EBIT margin was 52% vs. 51% Y/Y.
Forward Guidance:
Missed revenue estimates by 2.1%-2.6% depending on which data source you use.
Data Center and Client buckets to grow 10%+ Q/Q while Gaming and Embedded revenue will decline Q/Q.
Met GPM estimates.
Inventory up 21% year to date and rose 8% Q/Q to “support continued ramp of advanced technology products.”
Vague annual guidance was largely reiterated. It did change OpEx growth guidance from flat until demand improves to slightly up Y/Y in a hint that demand could actually be improving.
Balance Sheet:
$6.29B in cash & equivalents.
$1.7B in long term debt and another $750M in current debt.
c. MercadoLibre (MELI)
Results:
Beat revenue estimate by 4.6%.
Beat EBIT estimate by 47%.
Beat $4.28 GAAP EPS estimate by $0.88.
A 57.3% 3-yr revenue CAGR this quarter compares to 67.1% last quarter and 64.5% 2 quarters ago.
Balance Sheet:
$4.7B in cash & equivalents.
$2.1B in net debt.
90-day non-performing loan rate is stable.
Context:
Record for same and next day deliveries with 56% of shipments under that window.
Fulfillment by MELI reached 46% marketplace penetration.
Unique fintech users of 45.3 million vs. 38.2 million Y/Y.
Interest margin after losses (IMAL) was 36.8% vs. 30.6% Q/Q and 29.8% Y/Y.
3.25 million credit products issued vs. 2.69 million Y/Y.
Bad debt decreased via lower risk originations.
90-day nonperforming loan rate of 9.9% vs. 9.5% Q/Q and 13.2% Y/Y.
90+ day nonperforming loan rate of 25.1% vs. 28.2% Q/Q and 18.2% Y/Y.
d. Cloudflare (NET)
Results:
Beat revenue estimate by 0.9% & beat guide by 1%.
Beat EBIT estimate by 39% & beat guide by 40%.
Beat EPS estimate by $0.03 & beat guide by $0.03.
Met GPM estimate.
Dollar based net retention rate was 115% vs. 122% Y/Y.
Gross margin of 77.7% vs. 78.9% Y/Y was roughly in line with estimates.
The 45.7% 3-yr revenue CAGR compares to 47% Q/Q & 48.4% 2 quarters ago.
Next Quarter Guidance:
Revenue slightly beat estimates.
EBIT beat estimates by 8.4%.
Full Year Guidance:
Raised revenue guidance by 0.2%.
Raised EBIT guidance by 10.7%.
Raised EPS guidance from $0.34 to $0.37.
Balance Sheet:
$1.58B in cash & equivalents.
$1.28B in convertible notes.
Share count rose 2.2% Y/Y.
Context:
Sales cycle elongation is normalizing. The macro environment has stabilized for Cloudflare.
Better sales execution following the firing of underperforming employees last quarter.
Competitive pressures are stable, churn is very low.
Demand pipeline is very strong.
e. DraftKings (DKNG)
Results:
Crushed revenue estimate by 14.7%.
Crushed $19M EBITDA estimate by $54M
Halved GAAP EBIT loss estimate.
Crushed -$0.14 EPS by $0.28.
Balance Sheet:
$1.11 billion in cash and equivalents.
$1.25 billion in convertible senior notes.
Stock comp dollars down 36% Y/Y so far in 2023.
f. Block (SQ)
Results:
Beat revenue estimate by 8.4%.
Beat EBITDA estimate by 30.2%.
Missed GAAP EBIT estimate by 9.2%.
Slightly missed -$0.20 GAAP EPS estimate by a penny.
Monthly users rose 15% Y/Y.
Balance Sheet:
$5.8B in cash & equivalents.
$4.1B in debt.
Shares up 4.3% Y/Y.
f. Fortinet
Results:
Missed revenue estimate by 0.6% & missed guide by 0.6%.
30% 3-yr revenue CAGR vs. 29.8% Q/Q & 27.8% 2 Qs ago.
134 $1M+ deals vs. 124 Q/Q & 122 Y/Y.
Missed billings guide by 2.5%.
Beat EBIT estimate by 6.5% & beat guide by 7.1%.
Beat $0.34 EPS estimate & guide both by $0.04.
Guidance:
Lowered 2023 revenue guide by 1% & missed estimate by 1.3%.
Lowered billings guide by 3.5%.
Raised margin guide but missed EBIT $ estimate via revenue miss.
Raised $1.46 EPS guide by $0.08 & beat estimate by $0.07.
Balance Sheet:
$3.32B in cash & equivalents.
$990M in long term debt
6. Portfolio
I added to Lemonade this week.
News of the Week (July 31 - August 4)
I do a stock newsletter as well and find your analysis invaluable. Thanks so much for putting in the hours and hours of effort you obviously do. I have loved getting all the information to process.
Thank you for your work, really appreciate it as its easier to navigate through earnings season !