

Table of Contents
Over the next several weeks, subscribers will get 40+ earnings reviews, ongoing fundamental news coverage and real-time updates of my own portfolio/performance.
Other reviews sent so far include SoFi, Lemonade, Alphabet, ServiceNow, Taiwan Semi, Netflix and more!
We are running an annual plan discount to give you access to all of this for less. Lock in your lower rate below:
a. Key Points
- Margins were pressured by one-time expenses.
- AI continues to support strong healthy business trends.
- Daily active users returned to sequential growth.
- 28% revenue growth at massive scale.
b. Demand
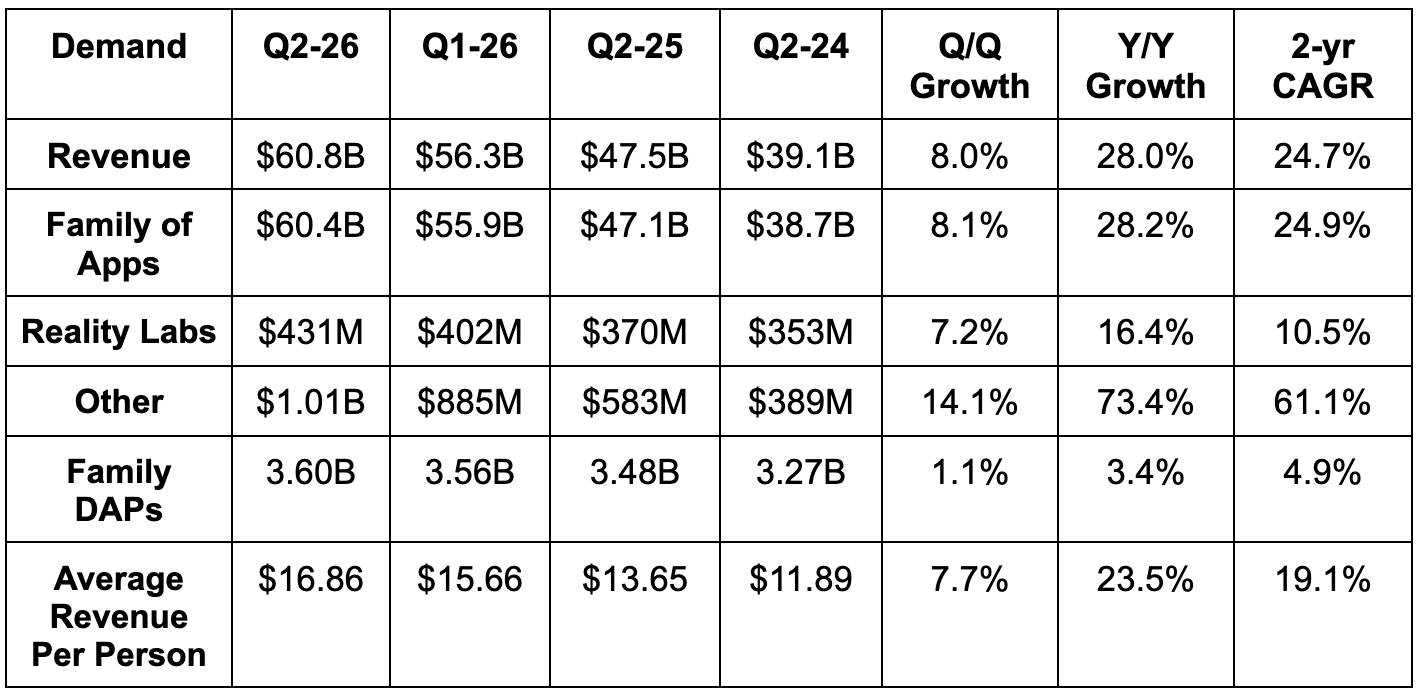
- Beat revenue estimate by 0.8% & beat guidance by 2.2%. Foreign exchange boosted revenue growth by 1 point instead of 2 points of help assumed in Meta’s guidance from last quarter.
- Asia Pacific revenue missed estimates by 11%. U.S. + Canada (UCAN) revenue beat estimates by 4%. Europe missed by 3%. Rest of World beat by 4.4%.
- Family of Apps (FOA) revenue beat estimates by 0.9%; reality labs revenue met estimates.
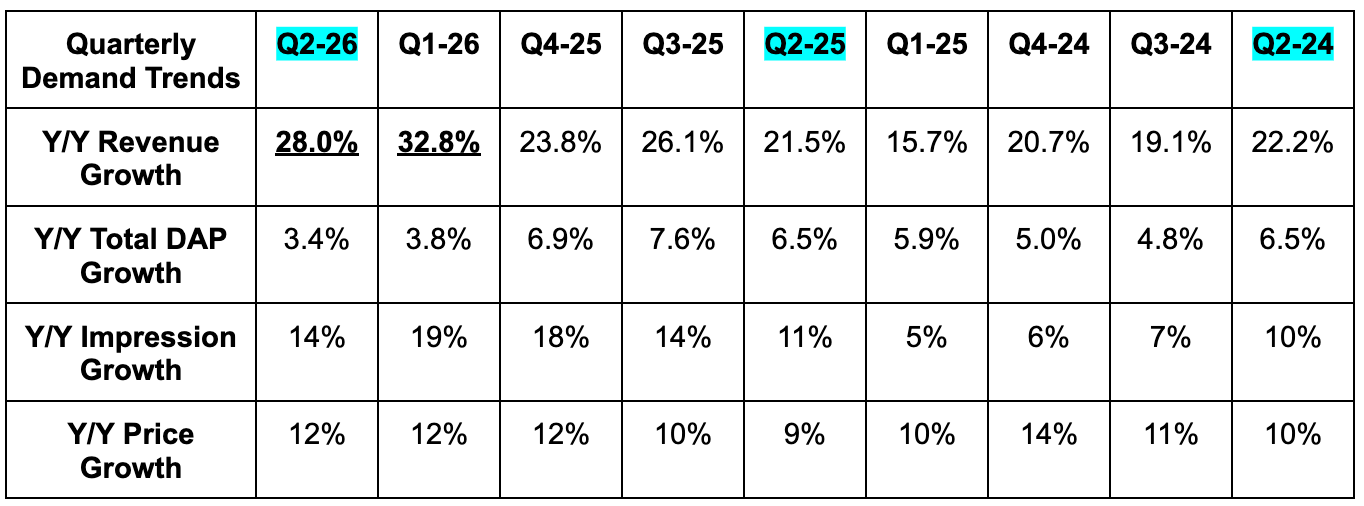
- Y/Y growth slowed by 5 points compared to last quarter, but the Y/Y growth comp also got 6 points more difficult compared to last quarter, marking a modest acceleration on a two-year stacked basis.
- Family daily active people (DAP) met estimates. Good to see this resume sequential growth following the global war-related decline.
- Threads crossed 500 million monthly actives in less time than it took X or any other conversation app.
- Instagram crossed 2 billion daily active users.
- WhatsApp crossed 30 million messages per second for the first time ever during the World Cup final.
- Having built-in distribution to 3.6 billion people makes scaling distribution for everything else Meta does so much easier.
- 14% Y/Y ad impression growth missed 14.6% estimates.
- 12% Y/Y price per ad growth beat 11.7% estimates.
- WhatsApp paid messaging and subscriptions carried other business above $1B in quarterly revenue for the first time.
c. Profits & Margins
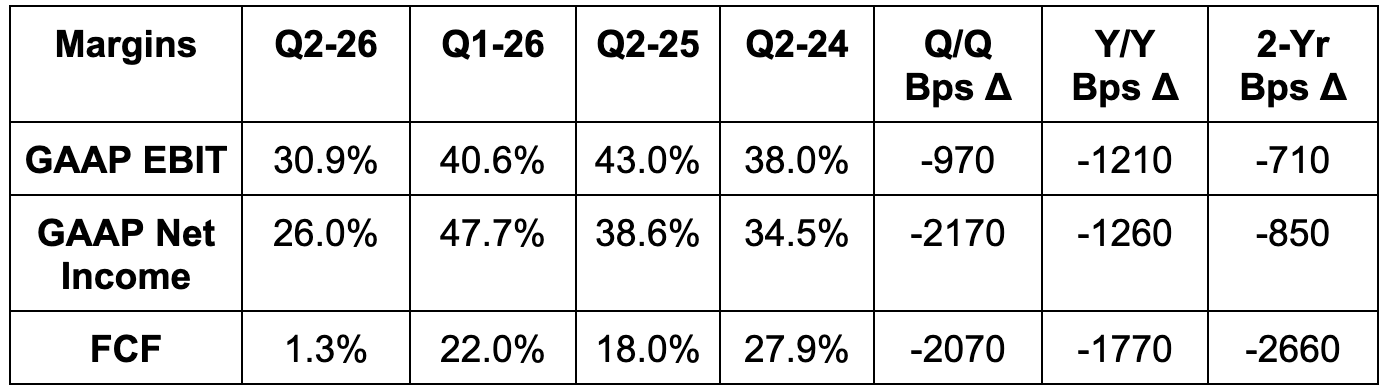
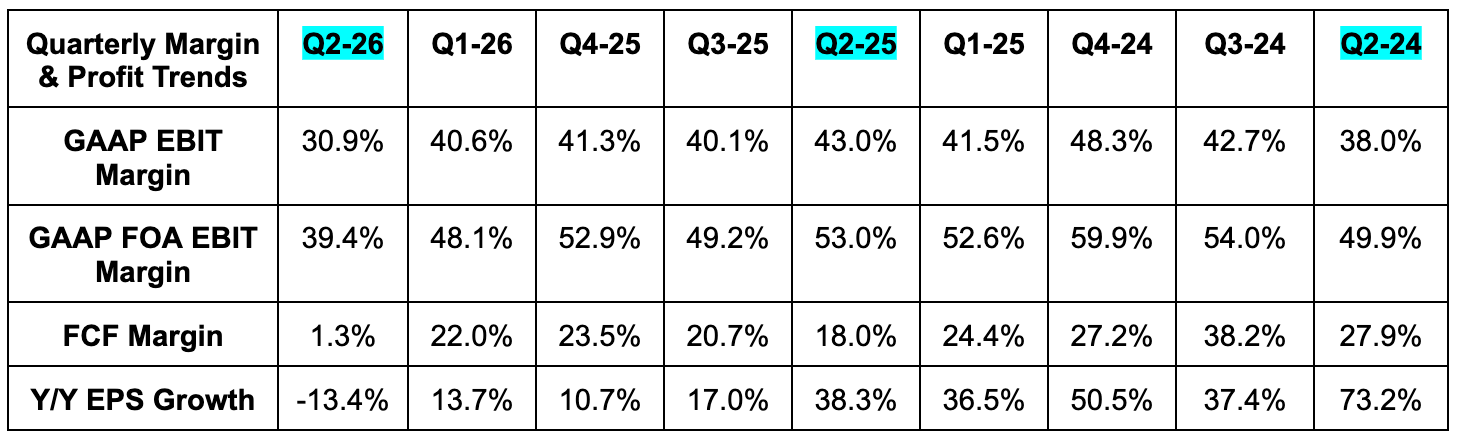
- Missed EBIT estimates by 12.5%. This includes $3.6B in total legal and severance fees (May layoffs). EBIT would have been 4% ahead of estimates excluding these one-off items.
- These costs led to 55% Y/Y operating expense growth. Excluding the two items, cost growth would have been about 41% Y/Y. 3rd-party AI token costs, AI talent and infrastructure depreciation were the other main sources of cost growth.
- Headcount fell by 3% Q/Q, which reflects part of its recent layoffs.
- EBIT rose 9% Y/Y ex-legal and severance charges.
- Missed $7.22 EPS estimate by $1.04. This was tied to the same costs as noted above.
- Beat -$1.2B FCF estimates by about $2B. This was likely cost recognition timing-related, although that wasn't mentioned on the call.
- CapEx rose by 83% Y/Y to $31.1B.
d. Balance Sheet
- $90B in cash & equivalents.
- $30B in investments.
- $83B in total debt.
- Diluted share count slightly fell Y/Y. Basic share count rose by 1% Y/Y.