

News of the Week (October 30 - November 3)
News of the Week (October 30 - November 3)
Pinterest; Match; Lemonade; Mercado Libre; Disney; Amazon; Meta; AMD; JFrog; Block; Fortinet; DraftKings; Macro; Portfolio

Crazy 5 days. In case you missed it, I published the following pieces during the week:
1. Pinterest (PINS) – Earnings Review
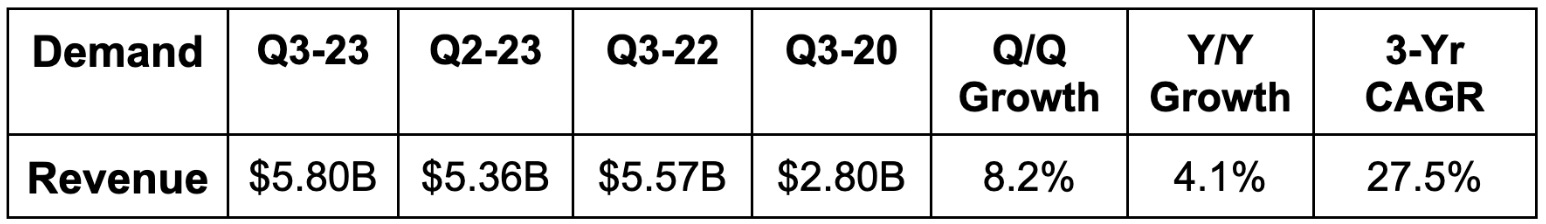
a. Demand
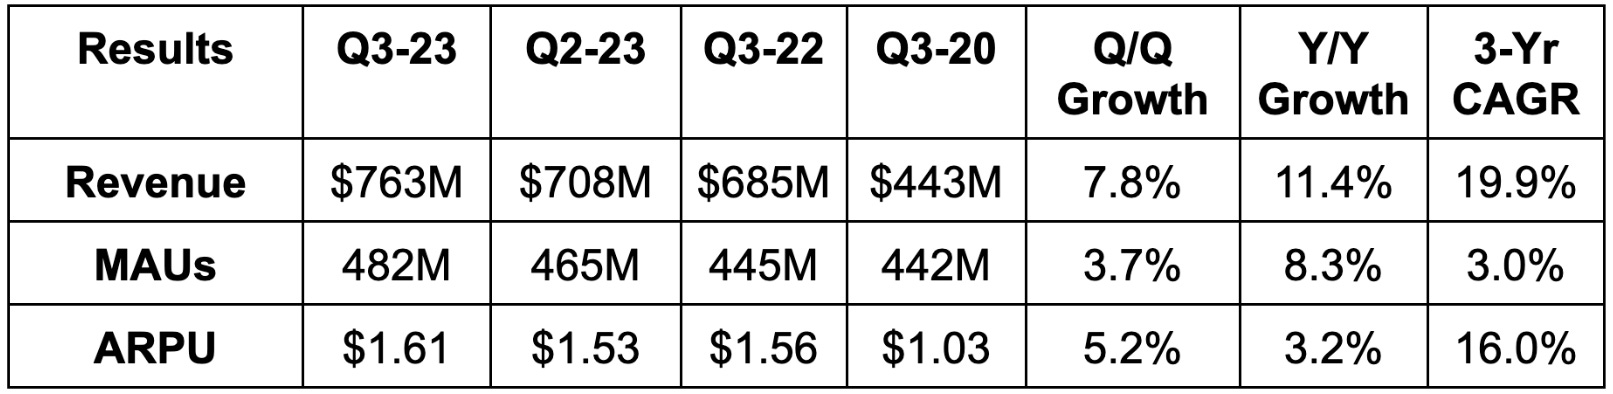
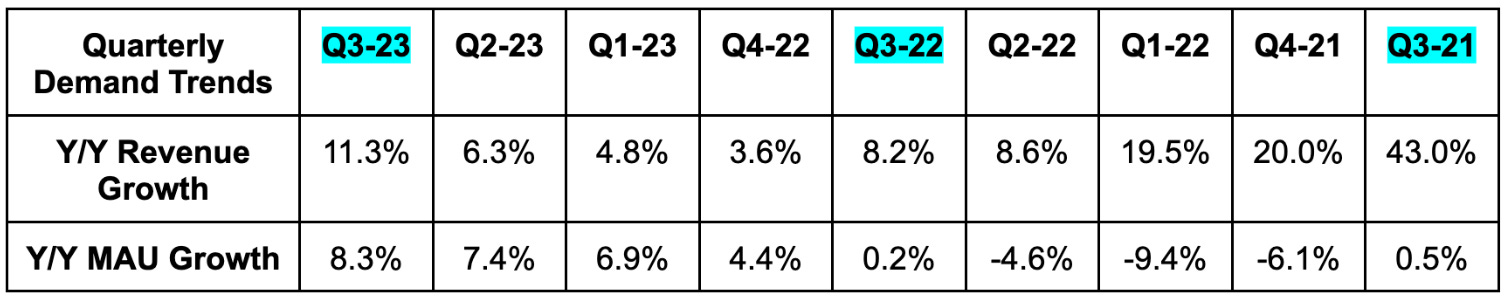
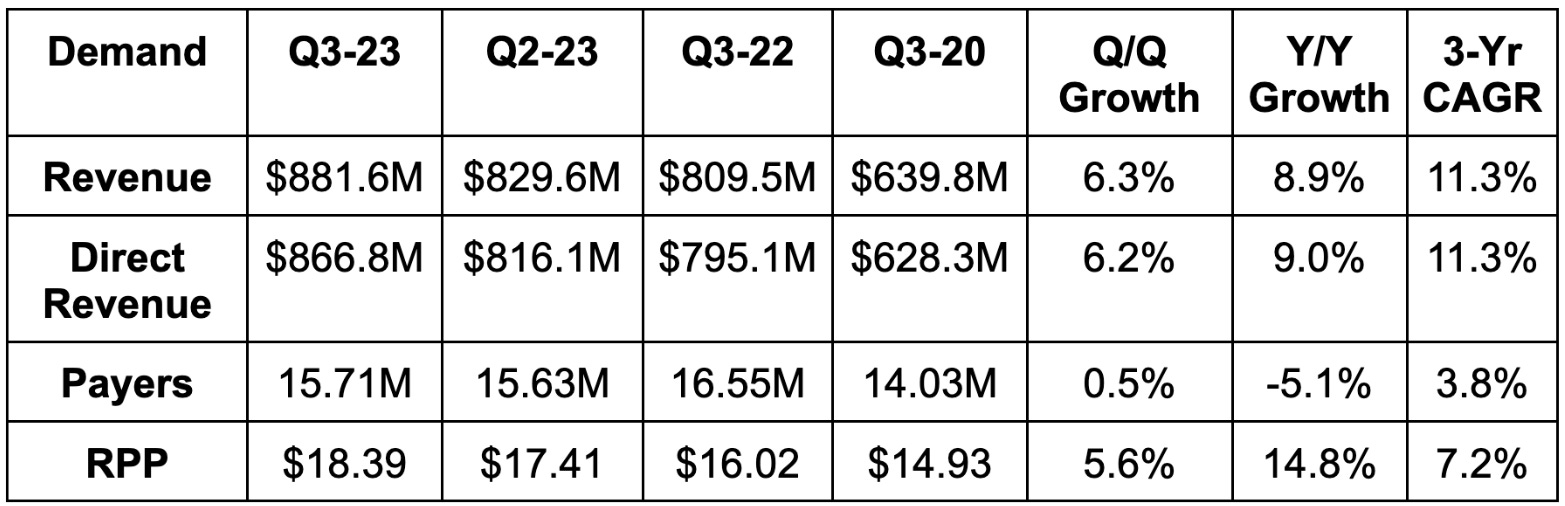
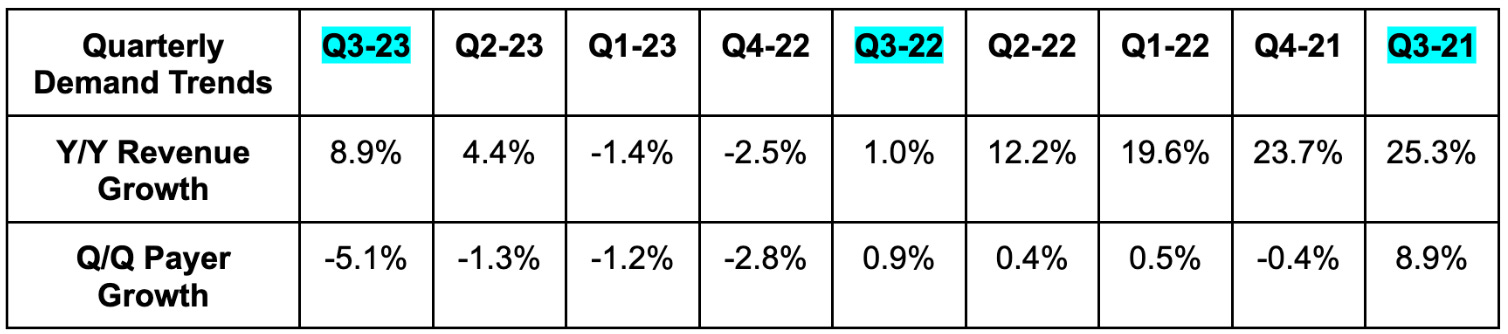
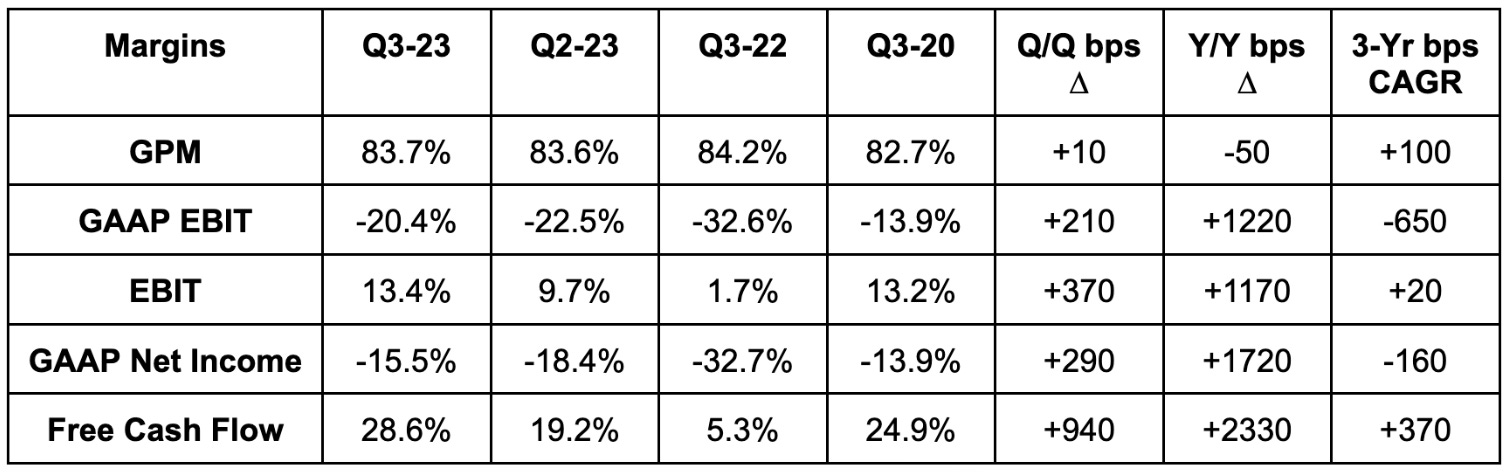
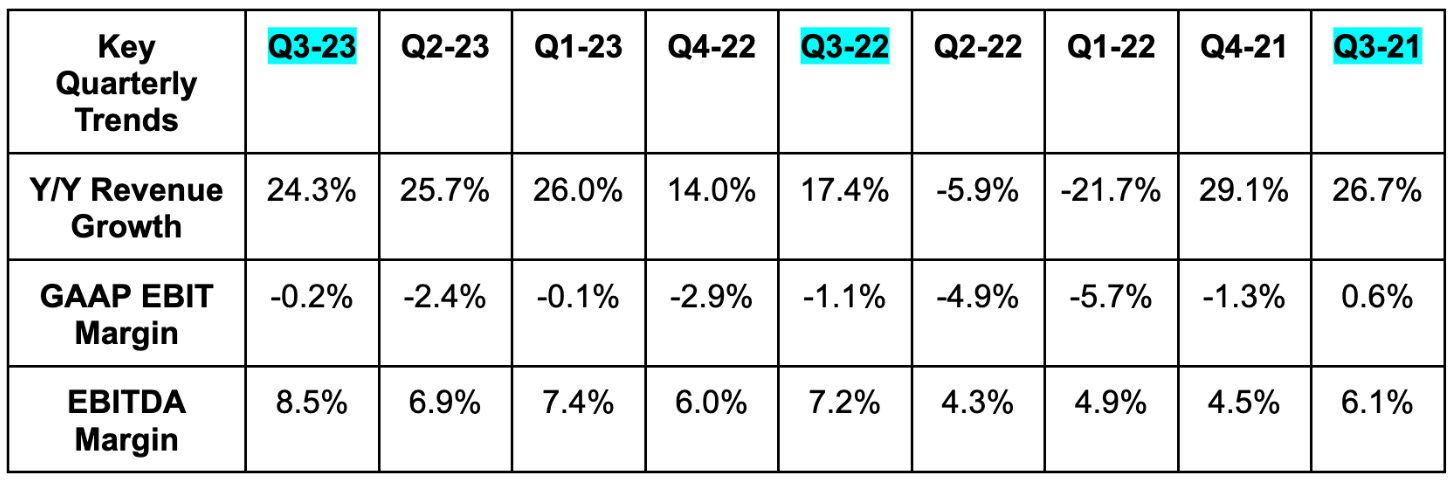
Pinterest beat revenue estimates by 2.7%. Its 11%+ Y/Y revenue growth also beat loose guidance of 7.5% growth.
19.9% 3-yr revenue compounded annual growth rate (CAGR) compares to 37.5% Q/Q & 30.4% 2 quarters ago.
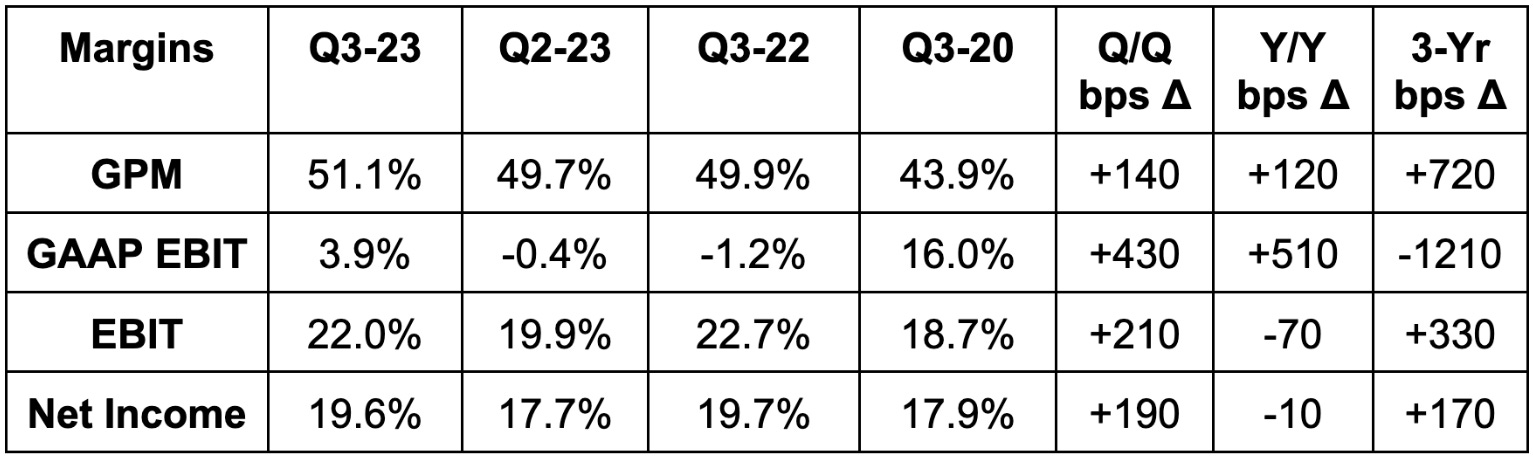
b. Profitability
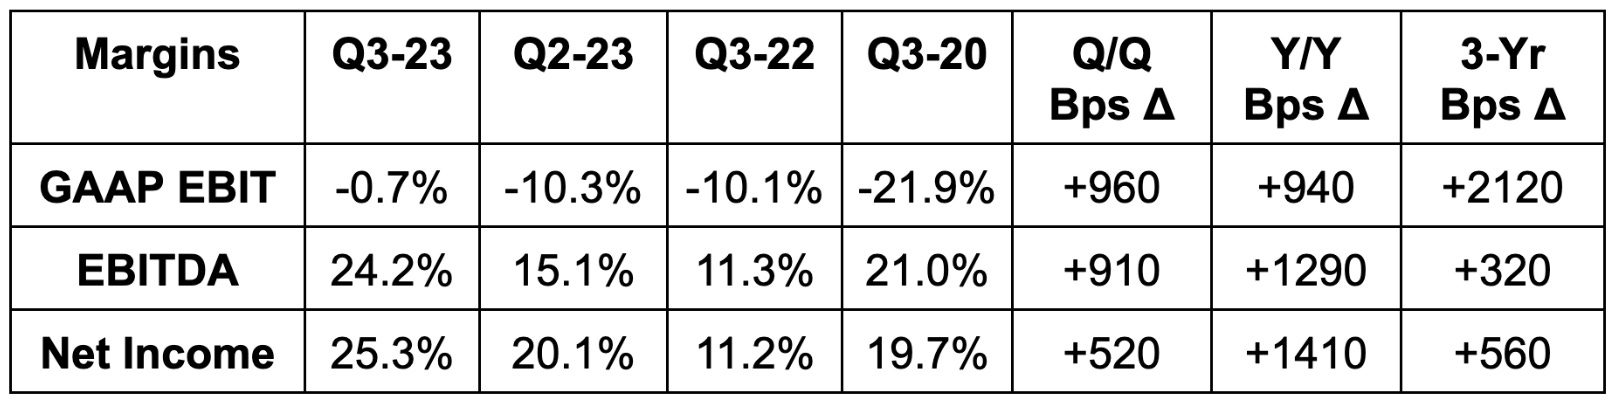
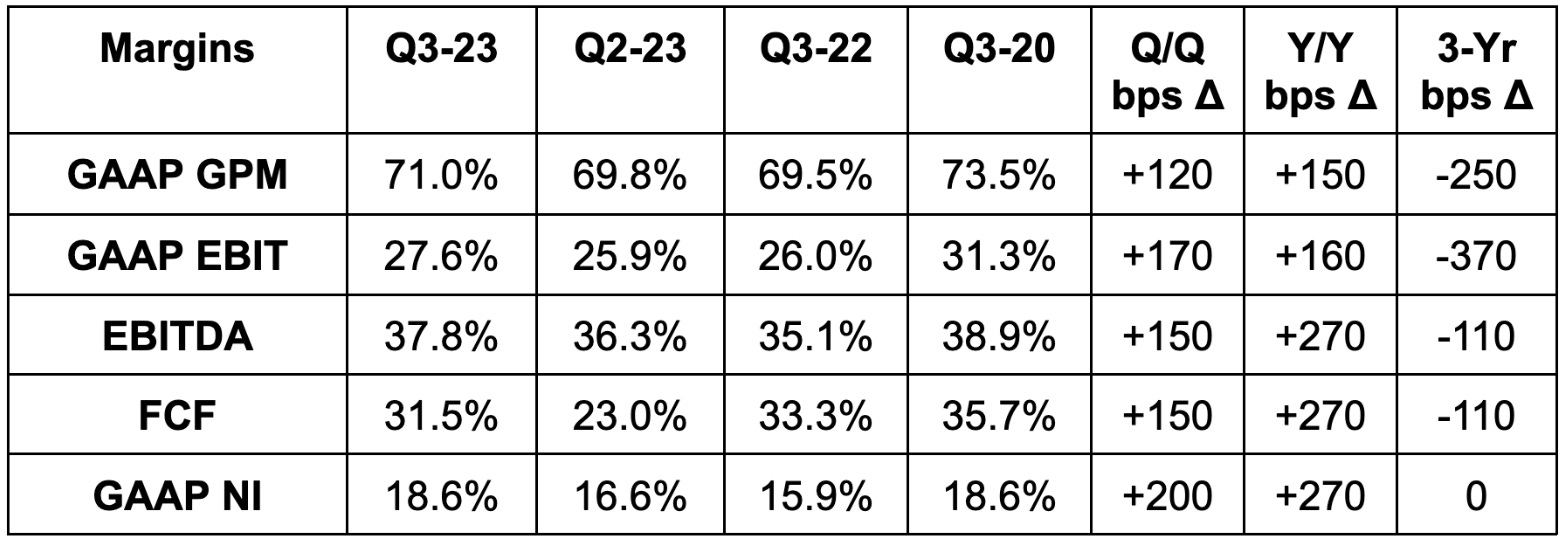
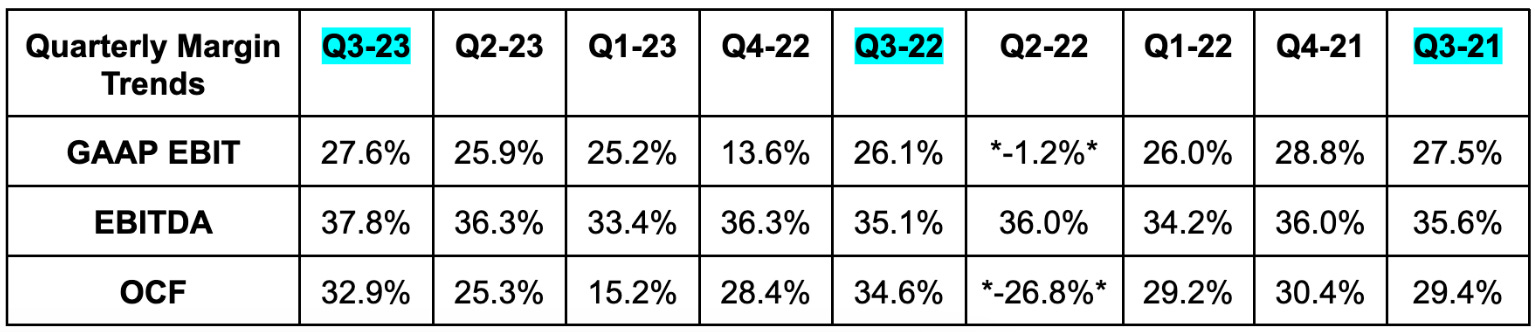
Pinterest beat EBITDA estimates by 42.4%. It also beat $0.20 earnings per share (EPS) estimates by $0.08. Its $0.01 in GAAP EPS beat estimates of -$0.03 by $0.04.
Please note that EBITDA is often higher than net income because of the firm’s strong balance sheet and the coinciding interest income.
c. Guidance
Pinterest’s revenue guidance beat estimates by about 1% at the midpoint.
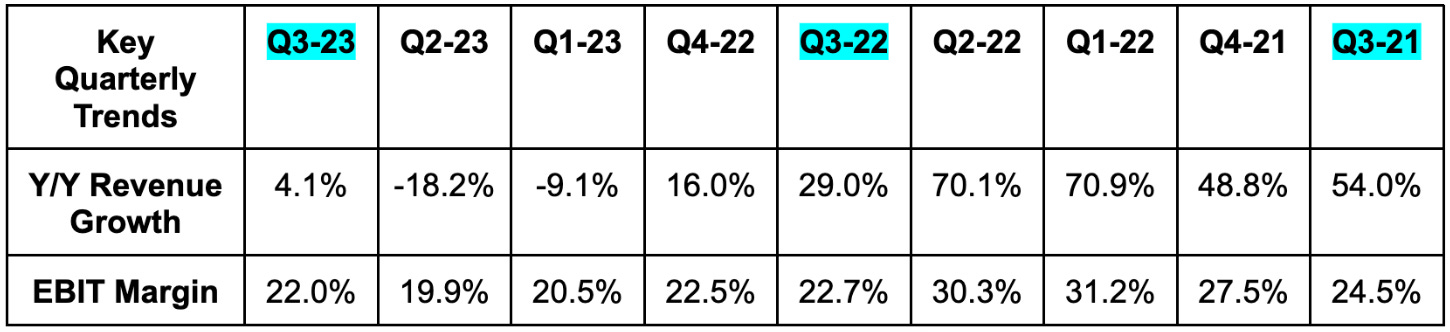
It now sees 600 bps in EBITDA leverage for the year vs. 400 bps as of last quarter & 200 bps at the start of 2023.
It also reiterated the long term targets offered at its Investor Day last month. These include mid-to-high teens revenue growth and reaching a 30% EBITDA margin over the next 3-5 years.
d. Balance Sheet
$2.3 billion in cash & equivalents.
Diluted share count rose 2.7% Y/Y but basic share count was flat Y/Y. It bought back $500 million in stock for the quarter.
e. Call & Release
Succeeding:
Pinterest strength was broad-based and structural in nature. Growth was faster than it’s been in over a year as comps got easier and engagement outperformed. New cohorts are saving 100% more content in their first year on the app vs. older cohorts. More content saving means more time spent. Leadership thinks it has struck the best “product market fit in years” with results being the effect.
Encouragingly, its strongest engagement by age demographic is with GenZ. That’s its fastest growing cohort in terms of MAUs as well as time spent.
Consumer-Facing Product Innovation:
Pinterest launched its “more ideas tab” on the home feed this quarter. The tool works conceptually similarly to content pinning on other social media sites. It allows users to select themes and “quickly refocus” on the content categories that speak to them. Pinterest exists to “save and curate ideas to make, do or buy in the future.” This release directly creates more relevant and engaging feeds to motivate saving. It should theoretically be an engagement tailwind if done correctly.
Along similar smart discovery lines, Pinterest debuted another tool this quarter. It scrapes the search history of users to display more interesting content as they scroll. It can use this data to “resurface relevant pins” as well. Non-follower content discovery is among the most impactful boosts to Meta’s engagement at the moment. Pinterest is sort of emulating that here. It calls this “guided browsing” and expanded the successful pilot project across North America this quarter.
It also debuted its “Shop the Look” module to help users quickly enter commerce mode and engage with shoppable links. This likely won’t be a direct engagement booster, but could help with ARPU. That’s the aim of this specific release. Shopping is actively becoming a more central piece of the user experience.
Advertising Innovation:
Pinterest revealed “mobile deep links” (MDL) earlier in the year. These links take app users right to a merchant’s mobile app with a single click. Since being released, MDL has boosted conversion for ad buyers by 235% while lowering cost by 35%. Now, it’s borrowing MDL’s success to debut a related product called Direct Links. Direct Links take clickers right to a merchant’s webpage (vs. mobile app for MDL). Both of these products remove steps/clicks in the shopping process to juice conversion. That juicing directly props up the value of Pinterest’s ad impressions.
Advertisers can easily create links and run cost per click campaigns through Pins’s platform. To date, 60% of its lower funnel (closest to conversion) revenue is through Direct Links. That represents 40% of overall revenue generation. It will roll out the tool to the rest of its lower funnel use cases like video ads by the first half of next year. So far, Direct Links deliver an 88% higher click through rate at 39% lower cost per click vs. its predecessors.
Premiere Spotlight (video ad format displayed at the top of pages) expanded from just the search tab to the home tab as well this quarter. For Maybelline in Canada, this product doubled its video completion rate vs. other campaign types.
Application Programming Interface (API) for Conversion is its tool to allow advertisers to add their old campaigns and conversion data to their Pins campaigns. The company added Adobe’s Commerce suite and Salesforce Commerce Cloud this quarter to bolster data usability for ad buyers. For PacSun specifically (a Salesforce customer), this news allowed it to accelerate Pinterest marketing campaigns. On Pinterest, with direct access to its 1st party data, it enjoyed a 700% boost to attributed conversion.
This API solution touches 28% of total Pinterest revenue as of August 2023 vs. 14% at the end of 2022. Along similar data leveraging lines, Pinterest extended its consumer data history profile to include older conversions and search activity. This is lowering cost per impression thanks to the added data infusion.
“By utilizing AI and large language models, we were able to more precisely link product metadata to user queries to show ads that are more relevant.” – CEO Bill Reddy
The firm now allows Amazon to display sponsored listings from its marketplace right on Pinterest as part of a 3rd party ad partnership. This is “off to a great start” per leadership. The most noticeable boost to revenue from this new Amazon partnership (and related relationships) will be in the first half of 2024. According to CEO Bill Reddy, the “upfront work to integrate 3rd party demand” is done. This has freed them to embrace many more 3rd party data source integrations to bolster targeting and interoperability.
Generally speaking, it continues to open up larger portions of its pages to ad placements. Growing ad load, all else equal, will also help with monetization. This led to 26% Y/Y ad impression growth.
Macro:
Ad pricing remains pressured by macro. Still, it’s showing “signs of stabilization” as pricing fell 12% Y/Y vs. a 20% Y/Y decline last quarter. This trend and commentary closely echo what Meta told us this quarter. Consumer packaged goods, retail and surprisingly financial services were the ad demand standouts this quarter.
Important Metrics:
Revenue rose by 8% Y/Y in North America, 33% Y/Y in Europe and 29% Y/Y in the Rest of the World.
MAUs rose by 1% Y/Y in North America, 7% Y/Y in Europe and 12% Y/Y in the Rest of the World.
Operating costs shrank across all key buckets while revenue growth accelerated. Good combination. Specifically:
Research & Development (R&D) fell 8% Y/Y.
Sales & Marketing (S&M) fell 2% Y/Y.
General & Administrative (G&A) fell 3% Y/Y.
f. Take
Billy Reddy has righted this ship. This was the best quarter Pinterest has reported in a while; forward commentary points to this becoming a new trend. User growth and engagement are very promising, especially with it being powered by GenZ. The sharpened focus on ad-tech investments and commerce leaves a lot of upside for ARPU. These investments are taking place while margins explode higher. That’ll work.
2. Match Group (MTCH) – Earnings Review
a. Demand
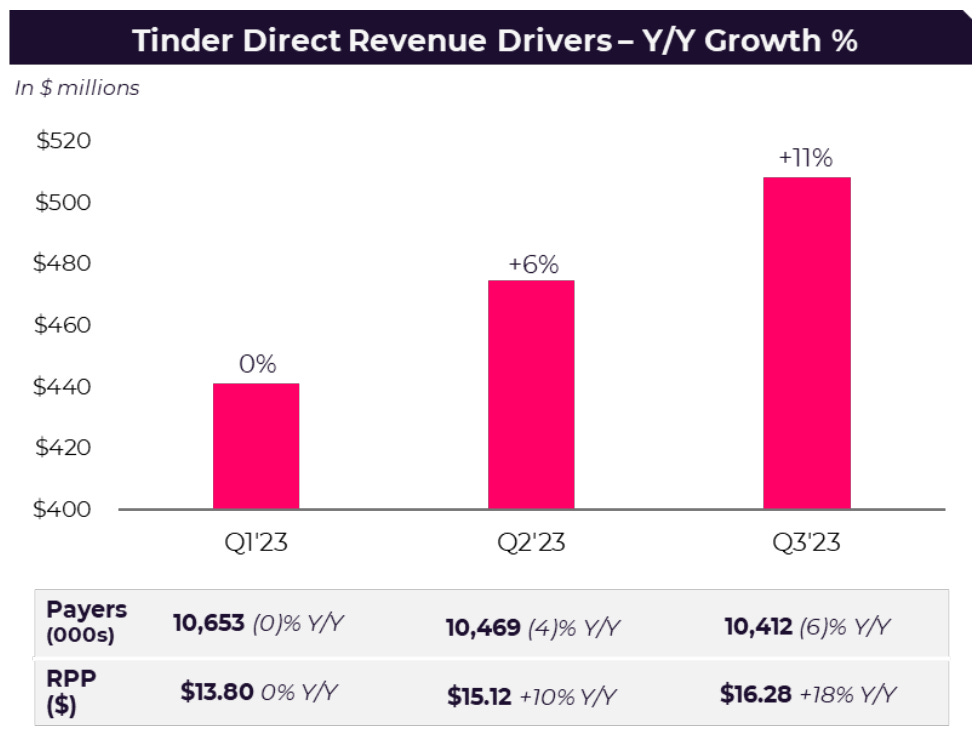
Match beat revenue estimates and its guide by a very slim margin. This was despite $10 million more in FX headwinds than expected. Tinder grew 11% Y/Y while Hinge grew 44% Y/Y. Payer growth was worse than expected.
b. Profitability
Match beat EBITDA estimates by 0.6% and beat its EBITDA guidance by 3.3%. Its gross margin came in slightly ahead of expectations as well.
c. Balance Sheet
$713 million in cash & equivalents.
$3.8 billion in total debt.
Share count fell 2.2% Y/Y.
Match Group has a 3.0x net leverage target. It’s safely below that at 2.7x, but may look to push it down further in today’s elevated cost of capital environment. Still, this is not stopping its rapid buybacks. The company has a goal of returning 50%+ of free cash to shareholders. It has already repurchased $445 million this year with expected free cash flow (FCF) of $800 million. Despite already exceeding that, it’s a “target not a limit.” Match expects to keep buying back more shares while also driving down its leverage. FCF is set to grow further in 2024, which should lead to more buybacks in the future. For now, it has $667 million left on the current plan.
d. Guidance
Match Group missed Q4 revenue estimates by 3.8%. This was related to two factors. First, foreign exchange headwinds removed $27 million from the guidance. It also took out a chunk of the expected $7 million in Israel revenue due to the ongoing war. Macro related advertising headwinds took another $3 million off of the guide. Without these headwinds, revenue guidance would have been just ahead of estimates. The guidance “reflects the risk of business deterioration due to weakening macro as well.” It seems to be quite conservative. The company reiterated its goal of 2023 EBITDA margin leverage.
The FX related weakness and geopolitical issues don’t bother me. The commentary around poor macro and ad demand hurting its business did bother me a lot. We’ve heard countless other consumer-facing companies fare far better this quarter. Match could just be blaming exogenous factors to its fundamental struggles.
For 2024, Match preliminarily guided to 8%-9% Y/Y revenue growth. This is worse than the 10.5% Y/Y growth expected, but includes a 200 bps foreign exchange headwind. It sees payer growth improving all year and Hinge growth remaining very lofty. It guided to “at least stable” EBITDA margin which is slightly worse than the 70 bps of EBITDA margin leverage analysts expected. It now expects Tinder’s return to double digit growth to only last 3 quarters before falling back below 10%. Really not good. The 2024 guidance also bothered me quite a bit.
e. Call & Letter Highlights
One Year into Kim’s Tenure:
Bernard Kim took over with the goal of vastly accelerating and improving product execution and innovation. He set the target of re-accelerating Tinder to 10%+ Y/Y growth by Q4. He hit that goal a quarter early… although in a temporary fashion. Marketing initiatives continue to gain traction and, when paired with product releases, set Tinder up for a strong 2024 per the team.
He set the ambition of making Hinge a globally known name through international expansion. Fast forward to today and it ranks #1 in new downloads across key markets like the U.K., Australia, Sweden and Ireland. It’s top 3 in 12 countries already while the app set new download records this quarter. Within Match Group Asia, he set out to turn the Azar app around. The app delivered 20%+ Y/Y growth for the second straight quarter. Finally, he worked to trim redundant costs and consolidate the tech stacks of its evergreen apps into one. This has already led to material cost savings to re-allocate to higher priority apps.
Weekly Subscriptions & Top of Funnel at Tinder:
As expected, payer growth remained negative Y/Y, but actually modestly rose Q/Q. This is the result of price hikes that are still being implemented throughout North America. This is why revenue per payer (RPP) rose by a brisk 18% Y/Y for the app.
Payer growth is supposed to be worse in Q4 and to improve throughout 2024. This is partially because Tinder enjoyed a payer boost in Q2 and Q3 from debuting weekly subscriptions across North America and Europe. This tailwind quickly normalized as these types of subscribers churn more readily. It will not enjoy the same pent up demand from weekly sub launches in Q4, but will deal with the elevated churn. This factor will subtract 200,000 payers from Tinder’s base Q/Q. It remains adamant that weekly subscribers are a good idea and thinks the added payer volatility will normalize by 2024.
Tinder restarted college campus marketing after a 3 year break. It ran a “Swipe Off Challenge” which awarded the most engaged university (Arizona State) with a free concert. This campaign raised swipe volume by 10%+ across the 20 most active schools. It pulled back on the “It Starts with a Swipe” campaign to allocate more dollars here. This was another source of Payer weakness.
Pulling back on a successful marketing campaign mid quarter was confusing and frustrating to me. Match was supposed to be cutting costs elsewhere to be able to liberally spend on Tinder. The pause led to increasingly weak user trends throughout the summer and fostered the negative Q4 payer commentary. Importantly, there was no decline for 18-29 year old women. This is its most important demographic for improving ecosystem health.
So far, 60% of Tinder’s payers have seen their prices hiked. Continued rollouts will keep hitting payer growth, but these new headwinds are concerning. It hints at the team just offering an endless series of excuses for why its most important app is in decline. Yes, the app is accelerating growth, but that’s due to easier comps. All of these excuses and the guidance point to the acceleration being short-lived.
Other Apps:
Hinge payers rose 33% Y/Y to 1.3 million with RPP up 8% Y/Y to $27.
Match Group Asia revenue fell 5% Y/Y as Hakuna and Pairs weakness offset Azar’s recovery. Azar will expand to Europe and the U.S. over the next year.
Emerging and Evergreen (E&E) fell 3% Y/Y overall while Emerging brands rose 40% Y/Y. Cost controls continue to be priority one for its legacy brands.
The initial reception to Archer (gay dating app) was very strong. It’s now #2 in the U.S. gay dating category and quickly catching up to #1. Archer downloads are already over half of Grindr’s despite it just being released (with little marketing spend).
Expense Discipline:
Operating expenses as a percent of revenue fell 200 bps Y/Y. By specific bucket, S&M intensity rose 100 bps Y/Y, G&A intensity fell 200 bps Y/Y and R&D was flat Y/Y.
Google Settlement:
Google and Match settled their lawsuit stemming from in app payments. As part of the agreement, the $40 million Match left in an escrow fund will be returned to it. Match will implement Google’s User Choice Billings by March 2024. It will pay the standard 15% subscription and 30% a la carte take rates to Google when Google’s payment processing is utilized. It will pay 11% and 26% for subscriptions and a la carte when it isn’t. This is not expected to lead to input cost relief for Match as it will pay incremental costs under the deal. Still, a “value exchange agreement” will allow it to recover all of those incremental costs from Google. This is essentially a wash, but makes that mega cap tech player less of an enemy.
f. Take
This quarter was bad. It materially diminishes my confidence in the new team turning this company around and leaves me quite underwhelmed. Blaming exogenous headwinds on poor guidance does not work when others are offering more upbeat forward prospects. That points to Match’s issues being specific to Match and not truly via macro. Old excuses are being replaced with new excuses. Too many excuses.
Geopolitics and a strong dollar are out of Match’s control. I don’t blame them for these headwinds leading to the light Q4. Still, the commentary on hefty weekly subscriber churn, top of funnel weakness and no signs of a Japan recovery is concerning. The talk about advertising weakness is also concerning considering we’ve consistently heard others call the environment “stable.” Just not great all-around. Somewhat understandable, but still irksome. I was expecting the FX issues, but not the others that surfaced.
This position is already full for me, so I could not add even if I wanted to. Thankfully, I don’t want to. Payer growth needs to return to positive territory like it’s supposed to and the Tinder turnaround needs to continue to gain steam. If the team is still making excuses for why it’s struggling after the first half of 2024, I will likely exit. I’m still considering exiting earlier than that after this poor showing.
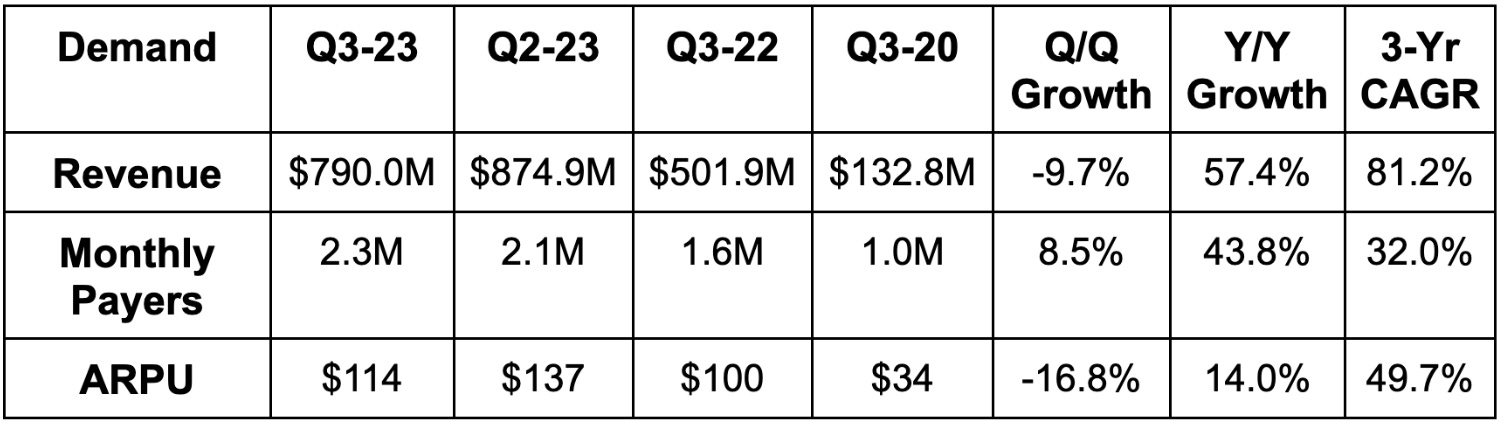
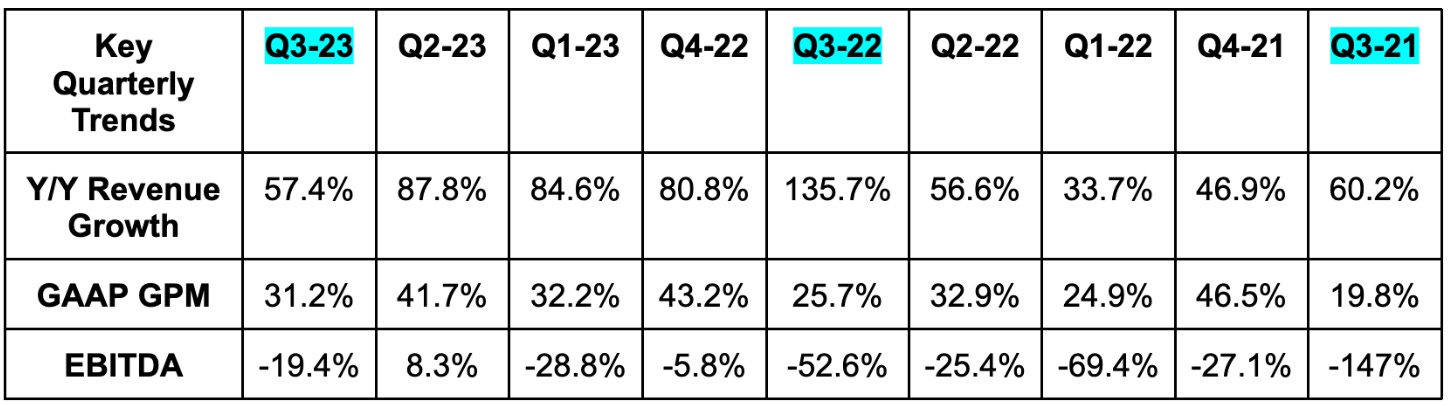
3. Lemonade (LMND) – Earnings Review
a. Demand
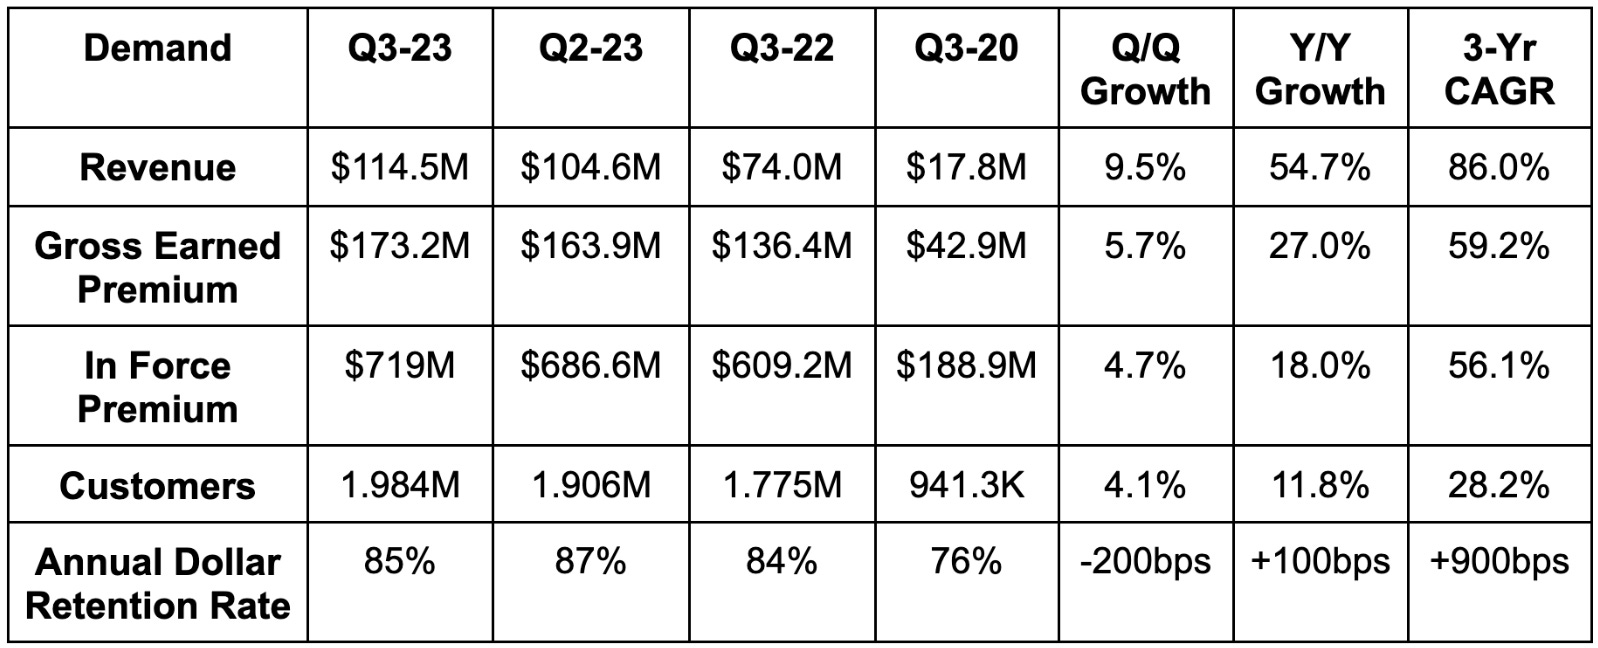
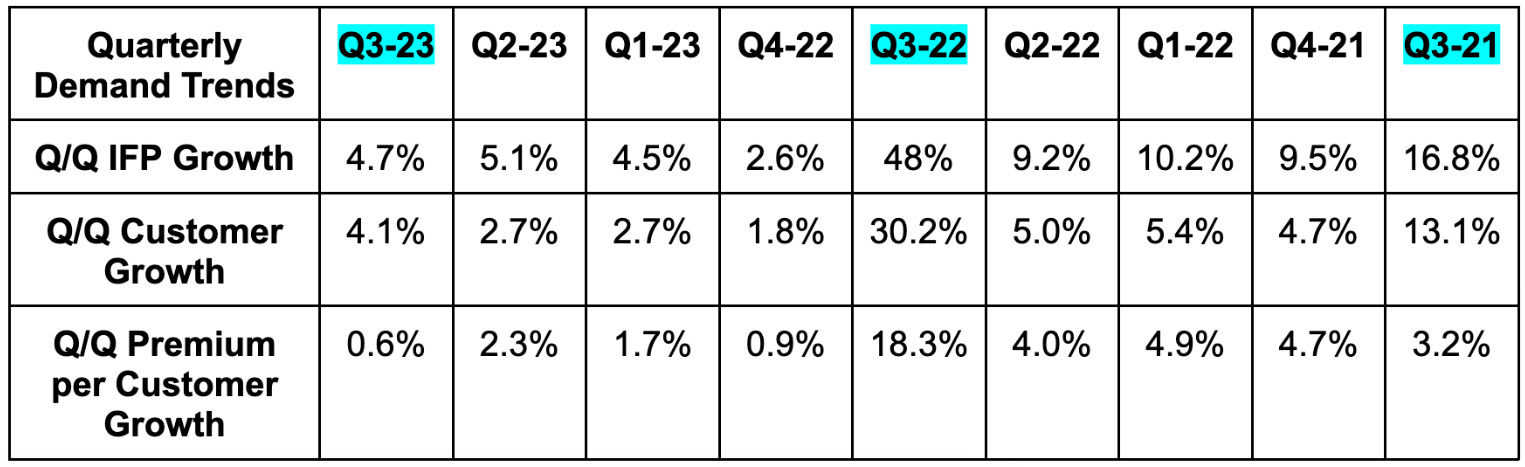
Beat revenue estimates by 9.3% and beat guidance by 11.2%. Its 86% 3-year revenue CAGR compares to 51.8% Q/Q and 53.7% 2 quarters ago.
Revenue growth was aided by 169% Y/Y growth in investment income and a lower ceded premium rate.
It ceded 50% of premiums to reinsurers vs. 63% Y/Y.
Beat in force premium (IFP) guidance by 2.0% and beat gross earned premium (GEP) guidance by 3.7%.
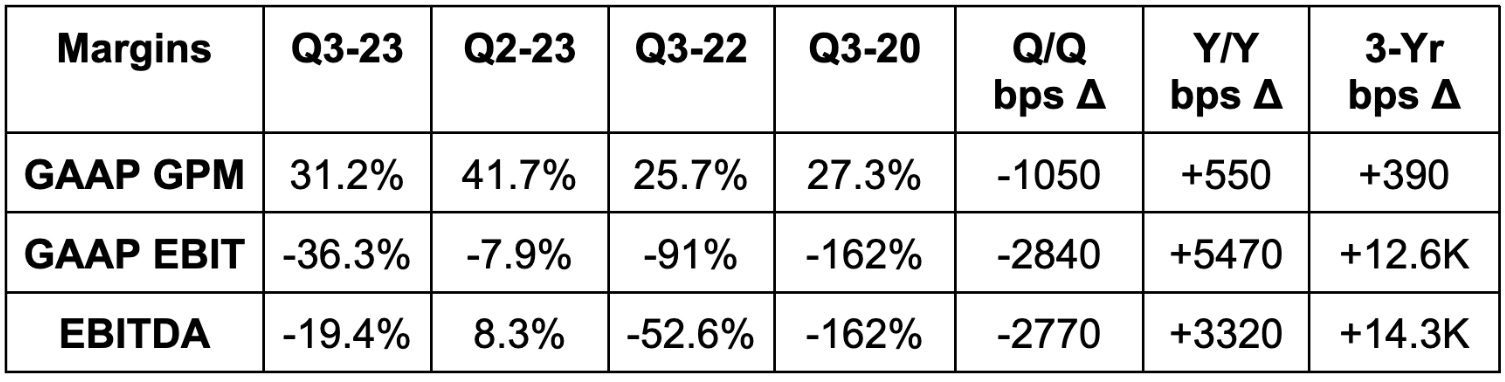
b. Profitability
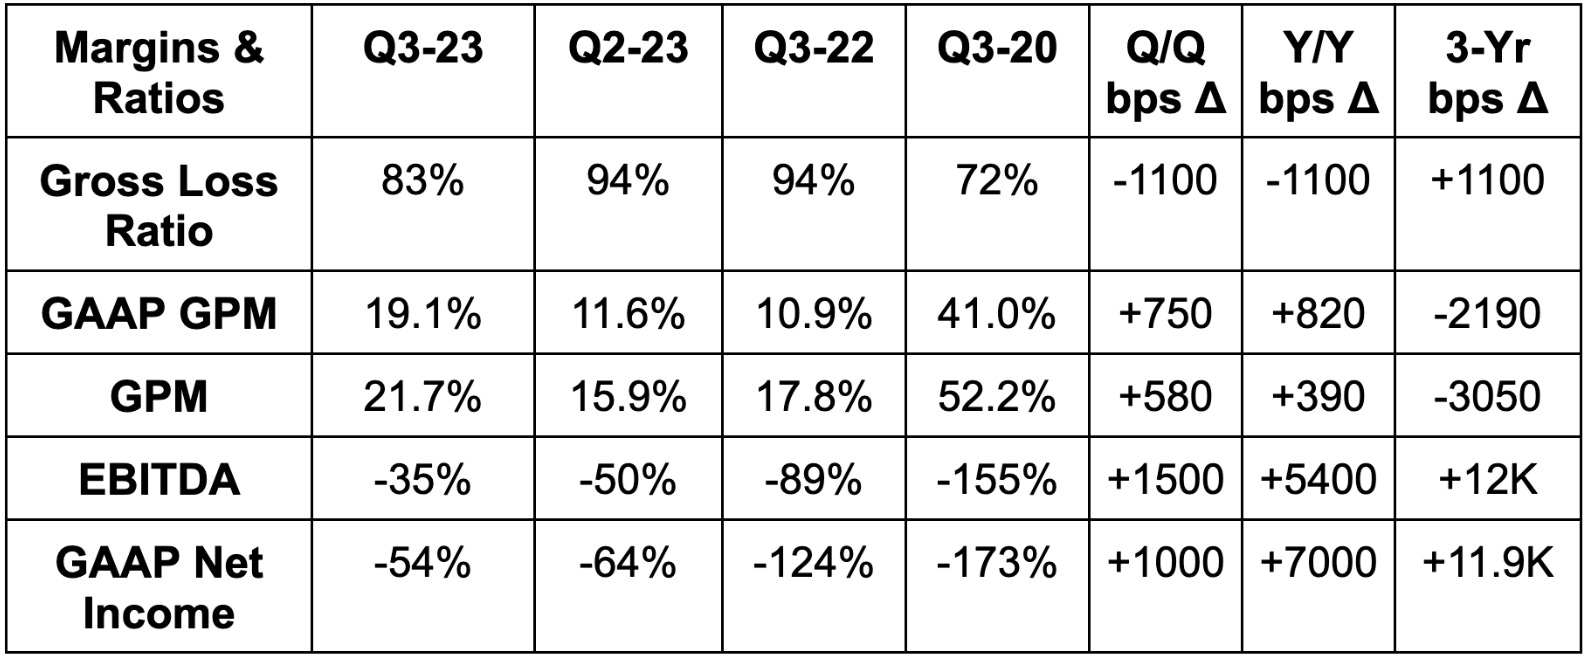
Beat EBITDA estimates by 19.0% & beat EBITDA guidance by 19.6%.
Beat GAAP EBIT estimates by 8.0%.
Beat -$0.94 GAAP EPS estimates by $0.06 representing a 6.4% net income beat.
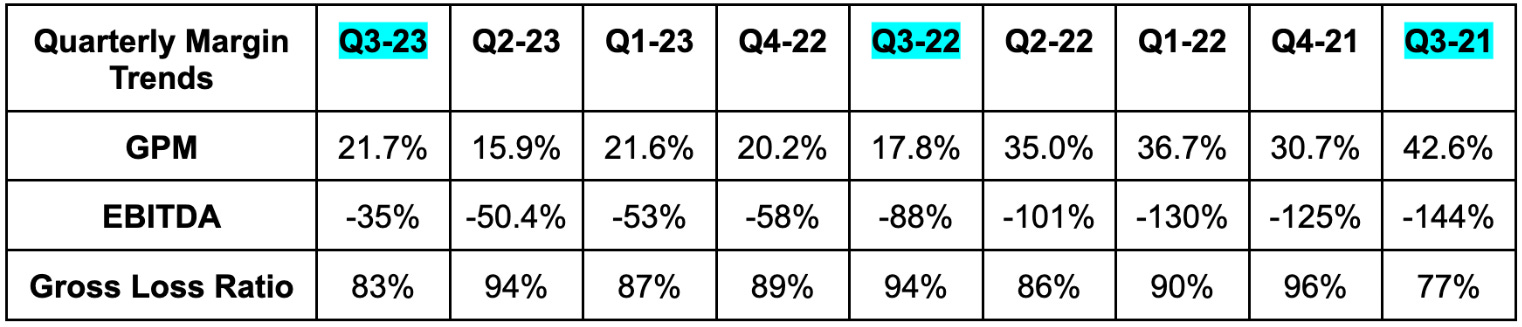
Please note that lower gross loss ratio is a good thing & vice versa. Also note that the sharp 3-year decline in gross margin is related to ceding a lower proportion of its premiums to reinsurers.
c. Q4 Guidance
Lemonade beat revenue estimates by 1.0% & beat EBITDA estimates by 1.2%.
As part of the call, Lemonade revisited previously issued financial targets from its investor day 12 months ago. The team now expects to turn free cash flow positive in 2025 vs. 2026 previously. It expects to reach this milestone with “hundreds of millions in unrestricted cash” vs. $100 million previously. It’s finally showing clear signs of future profitable compounding. Over the last 2 years, GEP has increased by more than 100% with operating expenses (OpEx) up 19% during that time. This quarter, OpEx kept falling with -11% Y/Y growth.
As it enjoys more rate filing approvals (covered below), it’s also ready to lean back into faster growth. Along those lines, it sees 18% Y/Y premium growth accelerating back to 25% next year.
d. Balance Sheet
$945 million in cash and equivalents.
$109 million carried by insurance subsidiaries as policy reserves.
No debt.
Share count rose by 4% Y/Y. This must slow like it’s expected to.
e. Call & Release Highlights
How Lemonade Wins:
Like at last year’s investor day, a big piece of this call was dedicated to spelling out Lemonade’s technological edge. It was born as a digital, AI-first company. It’s not trying to retrofit an antiquated tech stack amid the new GenAI wave; it has been a GenAI company since its founding. The vertical integration, superior automation and sky-high customer delight are byproducts of its “origin story.” Competition trying to piece models together just can’t move at the same speed or with the same efficacy that Lemonade can.
Its models collect and scrape insight from more data than even the largest carriers in the world can. This is obviously not because it has more data. It’s because the systems are natively in place to better utilize that data across their constantly evolving AI models. The latest upgrade was a customer service model that raised proportion of fully automated inquiries from 33% to 40%. Another new visual GenAI model can automate home inspections with a camera to gauge construction quality. More automation means lower costs. These advantages also show up in quicker application and claim processes overall.
The team is seeing signs of this tech edge starting to show up in underwriting. The book of business is maturing, its rate filings amid elevated inflation are being approved and Lemonade may be growing up.
This takes us back to Lemonade’s “predicted loss ratio” piece of last year’s investor day. There, it spelled out how elevated loss ratios are mainly due to rapid customer growth (and now inflation). Customers start at peak loss ratios and improve thereafter. Still, predicted loss ratio is sort of like using adjusted EBITDA instead of GAAP net income. It’s not common, it’s somewhat subjective and it’s consistently laughed off by incumbents. Maybe they shouldn’t be laughing.
Since launching its 6th customer lifetime value model at that investor day, we’ve had a full year to see how those predictions are coming to fruition. For the first two cohorts, actual loss ratios have been consistently at or below predicted levels. The models are working… but they also keep getting better. It has released 3 subsequent models since then all with incremental underwriting precision. Specifically, the latest boasts a lifetime value to customer acquisition cost (LTV/CAC) ratio over 4x. At Lemonade’s IPO, it was barely over 2x. 2x is good, 4x is excellent.
I understand those who roll their eyes at “predicted loss ratio.” They should not be rolling their eyes as these predictions prove to be accurate amid a tough backdrop.
Inflation & Loss Ratios:
As a reminder, claims float freely with inflation but premiums do not. So? Inflation means less profitable existing books of business. It pushes all carriers to seek rate change approvals from slowly-moving regulators. Lemonade has intentionally pulled back on growth spend while these approvals flow in as it will only pursue acceptably profitable growth.
Luckily, and as another sign of its superior automation and more nimble business, its approvals are coming more quickly than for others. It now has $165 million from its pool of premiums with approved rate changes. The team expects another $100 million in 2024. Still, these cycles take time to bear fruit. Not only are regulators slow, but rate changes only go live when a plan is annually renewed. Rapid progress is being made, but that progress will take a few quarters to fully show up in lower loss ratios.
“The book has some catching up to do, but I’m comfortable that the new business is high quality and profitable.” – CEO Dan Schreiber
Car loss ratios are improving more slowly than strong Pet, Home and Renters progress. That will soon change as it just got a 51% premium hike approved in California where half of its car business presides.
Margins:
$6.7 million in added operating costs via subletting part of its real estate footprint and adding reserves to its car business.
Total growth spend was $12.6 million vs. $23 million Y/Y and was 15% more efficient Y/Y.
The newly implemented synthetic agent system financed 50% of its growth spend during the quarter.
Lemonade has been surgeon-like on its path to profits. It called out its peak loss quarter years in advance and has done nothing but move up the schedule to profitability since then. It gets a bad rep because of its VC-funded nature and deep cash burn. But that cash burn is needed to build enough scale to cover fixed costs and make this a viable business. Insurers need scale. It has shown that it can closely control cash burn and revenue growth better than any other small cap that I follow.
f. Take
This was a great quarter. Not a good one, a great one. It adds credibility to the idea that this can be a profitable, rapid compounder for a long time. It has its P&L on a puppet-like string with daunting macro headwinds beginning to fade away. That should mean accelerating growth while it maintains rapid operating leverage. Still, the path to positive profits is about 2 years away, which continues to make this investment case highly speculative.
4. MercadoLibre (MELI) – Earnings Review
a. Results
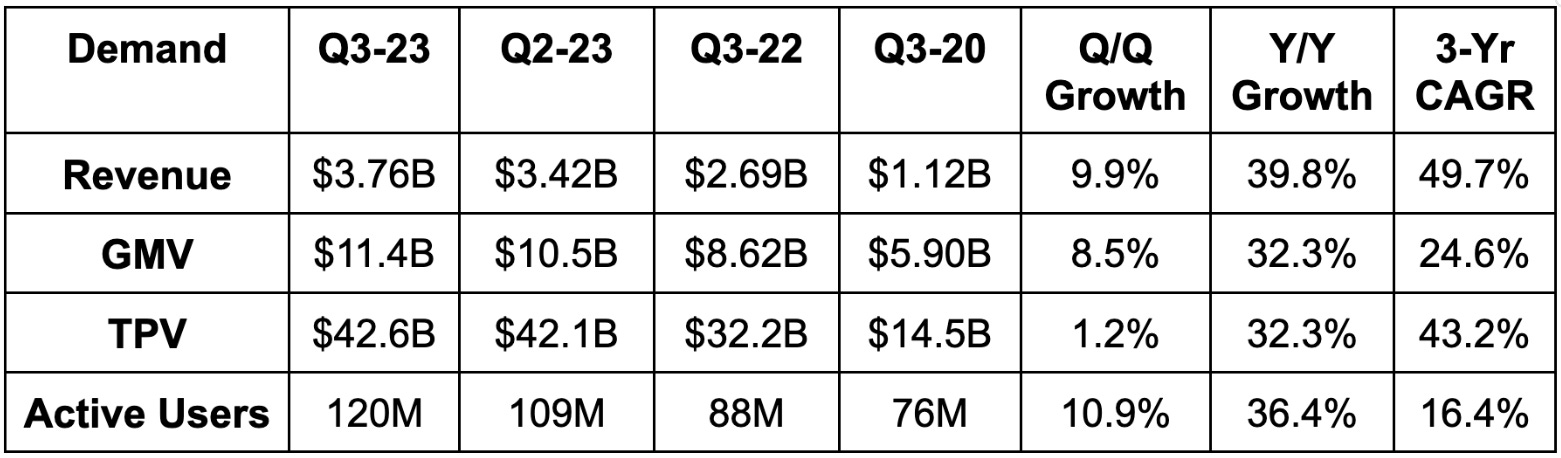
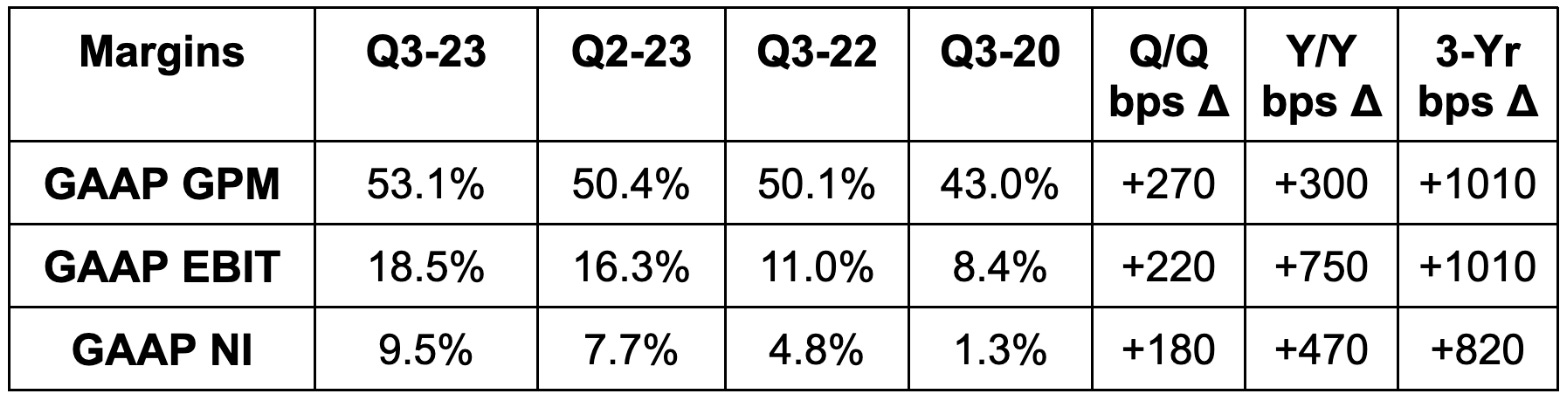
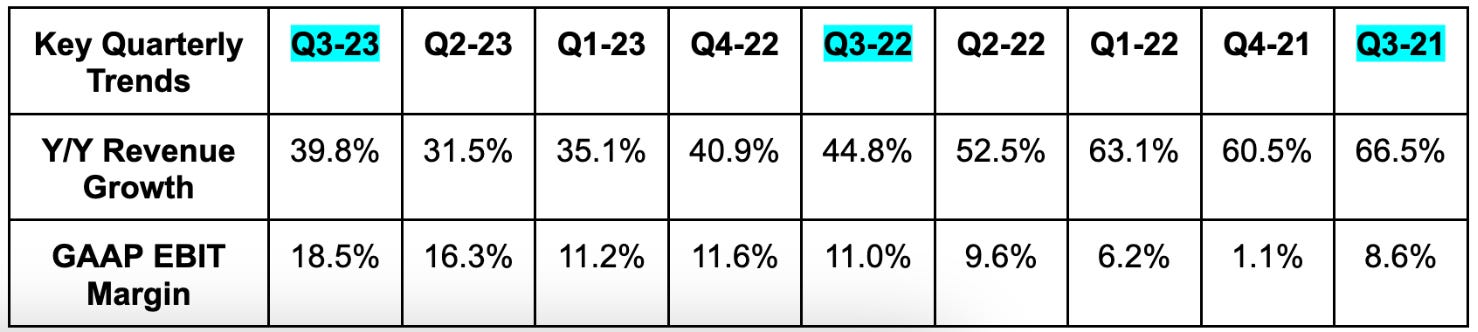
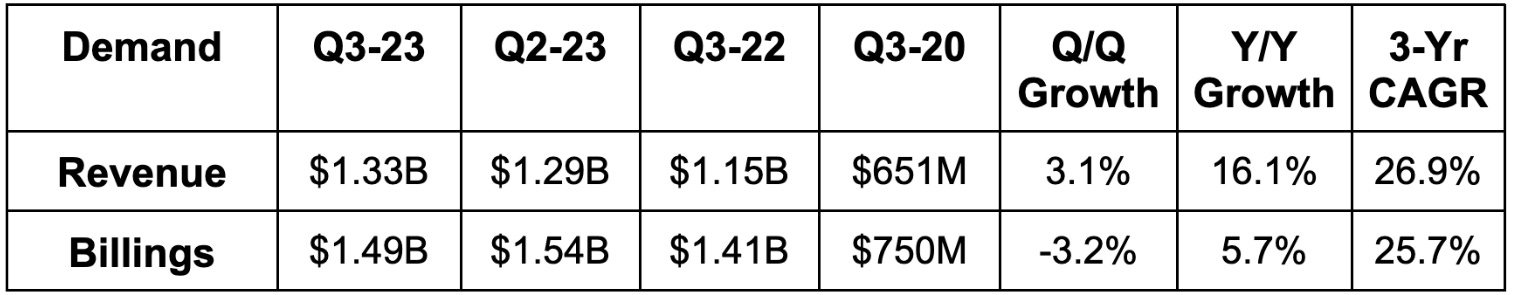
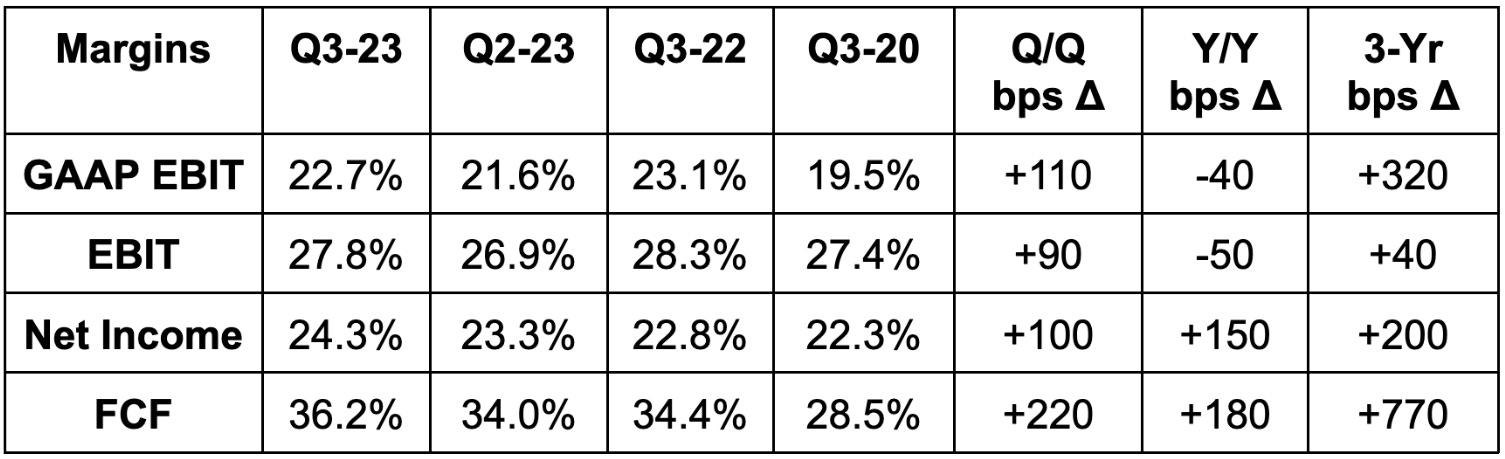
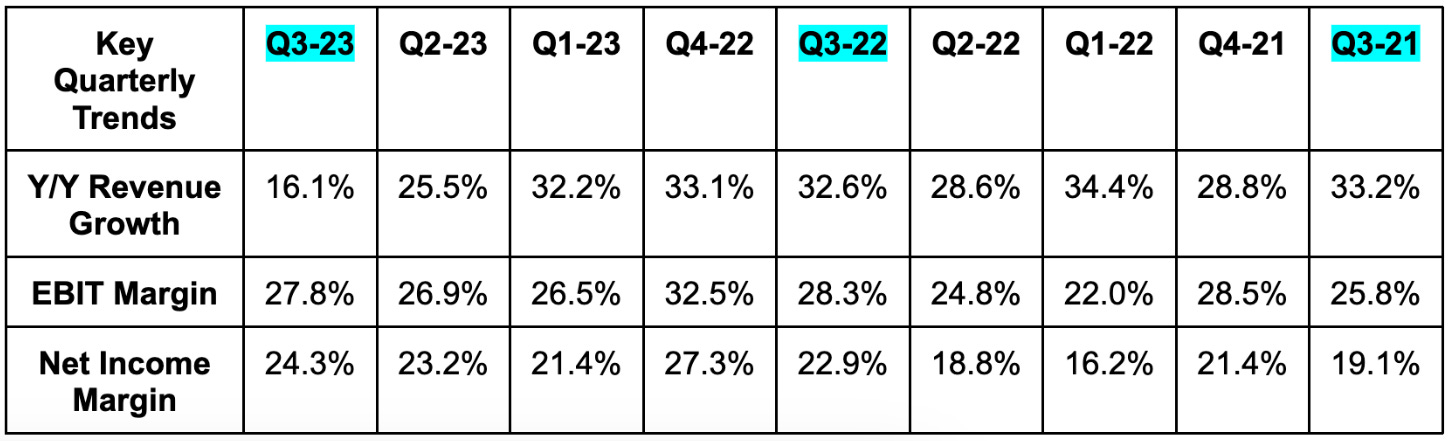
Beat revenue estimates by 5.9%. Its 49.7% 3-year revenue CAGR compares to 57.3% Q/Q & 67.1% 2 Qs ago.
Beat EBITDA estimates by 35%.
Crushed $5.83 GAAP EPS estimates by $1.33.
b. Balance Sheet
$5.5 billion in cash & equivalents.
$5.2 billion in debt.
Share count fell 2.2% Y/Y.
c. Letter & Call Highlights
Demand:
Y/Y volume growth continued to accelerate to 59% FX neutral vs. 47% last quarter and 32% 2 quarters ago. Items sold growth (not impacted by FX volatility) also continued that same acceleration trend. Acceleration came in its 4 largest markets with growth higher in Mexico than it has been in over 2 years. Mexico was called out as the demand standout this quarter with 66% Y/Y volume growth. Unique buyers continued to briskly rise by 5.9% Q/Q and 18.6% Y/Y while order engagement for these buyers keeps ticking up.
Logistics:
The company reached a 48% shipment rate for its marketplace vs. 40% Y/Y. This means that just 52% of its orders are now shipped by independent third parties. Same day shipment fell a bit Y/Y due to faster growth in regions further away from its distribution centers. Buyers are also just choosing cheaper, slower shipment options. Still, customer satisfaction set a new record. Shipment rate within two days reached a new record of 80% and it now also handles 50%+ of returns through Meli Places.
It opened a new center in Rio de Janeiro with another facility being built in Northeastern Brazil as we speak. It also expanded its Sao Paulo facility in that country while it added new capacity in Mexico to keep up with rapid volume growth. Despite all of these projects, net shipping costs as a percent of volume were flat Y/Y.
FinTech:
Total payment volume (TPV) rose 47% Y/Y FX neutral growth this quarter. Both acquiring TPV and digital account TPV rose by 80%+ Y/Y. This was explained as marketing campaigns and product investments bearing more fruit. Unique actives and wallet payers both maintained expeditious growth too.
Credit:
Meli thinks its sharpened underwriting models will allow it to accelerate card issuance without deteriorating credit performance. That played out in Brazil this quarter as it greatly boosted credit card acceptance rates while non-performing loan rates held steady. Bad debt expense crept up a bit, but by a reasonable amount.
Overall, net interest margin after losses rose to 37.4% vs. 36.8% Q/Q and 29.7% Y/Y as its credit book continues to perform well. Its percent of credit over 90 days past due fell sharply due to writing off a chunk of loans over 270 days past due. The percentage of loans under 30 days past due fell from 13.1% to 10.6% Y/Y as it continues to prove to be a responsible issuer. It launched a small business credit card in Brazil during the quarter and some merchant tools like custom coupons.
The credit portfolio rose 23% Y/Y to reach $3.4 billion.
Loyalty Program:
The company relaunched its Meli+ loyalty program. It added more perks like Disney+ and Star+ subscriptions, more free shipping and unique discounts. It jumpstarted marketing campaigns in Brazil and Mexico during the quarter and is “pleased with initial results.”
d. Take
This was an elite quarter. Enough said.
5. Disney (DIS) – Hulu
The News:
As broadly expected, Disney will buy the remaining 33% equity stake in Hulu from NBC Universal. When the two structured their agreement, they agreed on a minimum floor value of $27.5 billion. Considering this, Disney will pay at least $8.3 billion. This represents 33% of the floor value minus capital call contributions. Capital call contributions simply refer to the payments NBCU owes Disney for Hulu operating expenses. The two will work through an appraisal process to determine the fair value of Hulu. If it’s at or below $27.5 billion, $8.3 billion will be the price tag. That floor being realized or breached is very possible considering when this partnership was struck and how much macro has changed since then.
Asset Shuffling:
Hulu has compounded subscribers at a solid 11% clip since 2020. This is even more impressive considering the demand pull forward that streamers enjoyed at that time. ARPU sits at $12.39 (much higher with live sports). Considering this, estimates say that Hulu generated nearly $11 billion in 2022 revenue for roughly 12% Y/Y growth. Hulu is also Disney’s most profitable streaming asset. Assuming a modest 10% EBIT margin, this price tag would represent a 25x EBIT multiple. Considering the high quality nature of the asset and its growth prospects, this feels very reasonable.
Still, this deal only makes sense to me if a few other high probability items come to fruition. $8.3 billion is a hefty cash outflow for a company with $11.5 billion in total & equivalents. What would make it much more manageable is selling off its lower quality assets. There are rumored bids for ABC and its domestic linear assets in the ballpark of $10 billion. There are more advanced rumors about it selling a majority stake in its India business for several billion more in cash. ABC is in a terminal decline while India loses money for Disney overall.
Buying Hulu needs to represent an asset reshuffling to higher quality properties rather than a move to lever up the balance sheet further. That reshuffling seems to be taking place and is something I wholeheartedly support. Invest in domestic streaming, invest in your parks, invest in high quality films… get rid of the rest.
One more note on this. Hulu is firmly entrenched in the “general entertainment” category that Disney is moving away from. This type of entertainment doesn’t highlight its iconic brands and doesn’t support the omni-channel flywheel that these brands foster. So? I’d love to see Hulu lean VERY heavily on content licensing from other creators rather than populating the content itself. Hulu was born as a location for legacy media players to partake in streaming as that revolution began. There’s no reason to deviate from this original niche. Take advantage of the growth as profitably and efficiently as you can.
6. Amazon (AMZN) – Graphics Processing Units (GPUs)
GPUs are a massive piece of the Generative AI wave. They power vital machine learning model training and inference functions. Considering this, GPU demand has skyrocketed in 2023 with Nvidia’s H100 chip being the most popular example. Supply shortages have begun to creep up as a result of this spike.
Knowing this, Amazon debuted “Elastic Compute Cloud (EC2) Capacity Blocks for ML.” This is a new program that allows GPU cluster booking for a finite period of time. It frees customers from hefty up-front investments while adding more supply flexibility at a time when that’s dearly needed. The service offers Amazon’s Trainium and Inferentia chipsets as well as Nvidia’s H100 among others.
7. Meta Platforms (META) – Europe
In line with rumors that I’ve covered recently, Meta will debut an ad free paid subscription in the EU. This is in response to legislation like the Digital Services Act and General Data Protection Regulation; both make ad targeting tougher. At the very least, the new rules force Meta to secure an opt-in from users to show personal ads. It used to be an opt-out structure. The worst case scenario, which is becoming more likely, is targeted ads in that region eventually being banned altogether. That doesn’t really make any sense, but policy makers often don’t make much sense.
Meta is not sitting back and waiting to see what happens. Instead, it’s tweaking its business model to minimize or eliminate the potential impact. The subscriptions will be priced in a way that should be revenue neutral for those picking that option. This revenue will also likely be smoother and less volatile than advertising revenue across macro cycles. It’s a big change in the business model, but shouldn’t be a big change to financials.
8. Earnings Round-Up
a. AMD (AMD) – Earnings Snapshot
Results:
AMD beat revenue estimates by 1.9% & beat its guidance by 1.8%. Its 27.5% 3-year revenue CAGR compares to 40.6% Q/Q & 44.0% 2 quarters ago. It met gross margin estimates and slightly beat EBIT estimates (with the same guide).
Importantly, its MI 300 chip (which competes with Nvidia’s H100) seems to be gaining traction. It signed large deals with several hyperscalers to deploy these chips and its associated software suite (called ROCm). MI300 is on track to be the firm’s fastest chipset to reach $1 billion in total revenue. Data center revenue was flat Y/Y, client revenue was up 42% Y/Y, gaming was down 8% Y/Y and embedded revenue was down 5% Y/Y. Demand remains challenged across many AMD use cases.
Outlook:
AMD missed next quarter revenue estimates by 4.5% and missed next quarter EBIT estimates by 15%.
Balance Sheet:
$5.7 billion in cash & equivalents.
$2.4 billion in debt.
Inventory fell slightly sequentially and is up year to date.
Share count is flat Y/Y.
b. JFrog (FROG)
Results:
Beat revenue estimates by 1.1% & beat guidance by 1.3%.
Beat EBIT estimates by 86% & beat guidance by 86%.
Beat $0.08 EPS estimates by $0.07 & beat guidance by $0.07.
Fourth Quarter Outlook:
Revenue guidance met expectations.
EBIT guidance was 50% ahead of expectations.
EPS guidance of $0.125 was $0.045 ahead of expectations.
Balance Sheet:
$500 million in cash & equivalents.
No debt.
Basic share count up 4.6% Y/Y and diluted share count up 4.7% Y/Y. Needs to slow.
Updated Plan:
Two things are true about this quarter. First, the results were very good and far exceeded the performance of countless other software names. Secondly, it does not change the fact that geopolitical risk is too elevated and uncertain for me to own this name today. The financial track record leaves me with two thumbs firmly pointed up. Frustratingly, I simply cannot get comfortable with the type of risk facing this company. Fantastic and admirable quarter, nonetheless.
c. Block (SQ)
Results:
Beat revenue estimates by 3.5%.
Beat -$77 million GAAP EBIT estimates by $68 million. Really good.
Beat EBITDA estimates by 26%.
Beat $0.46 EPS estimates by $0.09.
Outlook:
Block raised its full year EBITDA guide by 11.3% which beat consensus by 9%. This was not solely driven by Q3 outperformance as Q4 EBITDA guidance was also 12.2% ahead of expectations. It also raised adjusted operating income guidance from $25 million to $215 million. There are no consensus non-GAAP EBIT estimates on Block for me to use here, but strong raise.
It guided to 18.5% Y/Y revenue growth for next quarter which was 1.5% lower than expectations.
Balance Sheet:
$6.2 billion in cash & equivalents. $8.1 billion in available liquidity including restricted cash.
$4 billion in debt.
Share count rose 3% Y/Y, but it introduced a new $1 billion buyback which should help slow dilution in the future.
Key Notes:
Focus:
Well… Jack Dorsey is certainly listening to shareholder qualms. The theme of his letter was getting more efficient and executing better. The company is tweaking its profit disclosures with an added emphasis on controlling stock based compensation. It’s even reinstating a fixed cap on its employee base at 12,000 for the foreseeable future. It has a new goal to reach an EBIT rule of 40 score (revenue growth rate + EBIT margin) by 2026. The firm has identified “structural duplication” fostering redundant costs that it’s now actively taking out of the business.
The change in philosophy started to shine through this quarter as S&M fell Y/Y. Sharper focus… better execution… that was the theme. I’m not a fan of Dorsey and his antics, but this was my favorite shareholder letter that I’ve ever read from him.
Integrate:
The company is looking to more intuitively integrate Cash App (consumer facing) and Square (merchant facing) product suites. It has a “line of sight to see more of Square within Cash App.” This could mean things like special merchant promotions, targeted advertising tools and more. It mimics what Shopify is trying to do with Shop App or what PayPal does with its digital wallet. For Square specifically, it wants to make its banking products a heavier focus. It will morph Square into a “cohesive cash flow home” by conjoining the somewhat siloed products offered there today.
Cash App & Square:
For Cash App specifically, it also sees room for better product organization. It will look to better combine its peer-to-peer, financial services and commerce functions. Doing so within commerce specifically will make Cash App more ripe for Square product integration. Cash App crossed 22 million monthly vs. 18 million Y/Y while inflows rose 21% Y/Y. It’s finding success with shorter-term credit products while maintaining strong loss rates as these tools grow. Dorsey hinted at adding direct deposit functionality in the near future. Its checkout accelerator, Cash App Pay, enjoyed strong growth and profitability as well.
Square Go is its consumer app that provides booking and business management tools for sellers. The company is enjoying strong week over week growth within beauty and personal care sellers, which was its first pursued vertical. It will expand to more verticals in the near future.
It’s changing its go to market approach for larger, more complex sellers. While the company has prided itself on not locking smaller merchants into long term contracts, many larger companies want those longer term contracts. Block just has not been willing to offer them, but that’s now changing. This will give it more capacity to structure volume-based discounts while making revenue generation more visible. 41% of its sellers are medium or large businesses vs. 37% Y/Y and it wants that to tick higher.
d. Fortinet (FTNT)
Results:
Missed revenue estimate by 1.5% & missed guide by 1.1%.
Missed billings estimate by 6.3%.
Beat EBIT estimate by 9.9% & beat guide by 10.4%.
Beat $0.36 EPS estimate by $0.05 & beat its same guidance.
Outlook:
Q4 guidance was 5.4% below consensus for revenue. Conversely, the company met EPS expectations and beat EBIT estimates by 3.8%.
Balance Sheet:
$2.2 billion in cash & equivalents.
$1.0 billion in debt.
Share count is down 0.7% Y/Y.
e. DraftKings (DKNG)
Results:
Beat revenue estimate by 12.9%.
Beat EBITDA estimate by 26.4%; Beat GAAP EBIT estimate by 17.5%.
Beat -$0.70 GAAP EPS estimate by $0.09.
Outlook:
DraftKings raised its full year revenue outlook by 5.6% which beat expectations by 4.7%. It also raised full year EBITDA estimates by a healthy 46% which beat similar consensus estimates by 46%.
But wait… it gets better.
The company introduced 2024 revenue and EBITDA guidance. Revenue was 8.6% better than expected and EBITDA was 44% better than expected.
Balance Sheet:
$1.1 billion in cash & equivalents.
$1.25 billion in convertible senior notes.
Share count is up 4.3% Y/Y. Needs to slow.
Key Notes Call Notes:
DraftKings continues to rapidly gain market share. It owns 33% of the gambling market vs. 21% a little over a year ago. This continued with its launch in Kentucky this quarter; it already has 5% of the entire population as customers several weeks in. Maine and North Carolina will come online next with Vermont and Puerto Rico expected to follow. 12 additional states representing 24% of the U.S. have proposals or regulatory momentum in place to legalize next year.
While the growth has been great, the efficiency has perhaps been more encouraging. Despite negative marketing cost growth, its churn, retention and engagement continue to outperform. Considering how low the switching costs are in gambling and how competitive the landscape is, I find this to be surprising and impressive. Its old states now have the cash flow to self-fund new states while new states approach profitability more quickly than predecessors.
Finally, the vertical integration of its back-end technology in 2020 is working like a charm. It has accelerated product innovation and was credited as the reason for the company’s outperformance and “best in class” product.
Another great quarter.
f. Bill.com (BILL) & Revolve (RVLV)
I simply did not have enough hours in the week to get to these reports. I will cover them next week.
9. Macro
a. Powell Meeting
The Federal Reserve held its rate steady at 5.25% to 5.50%. The Powell presser was very uneventful without much learned. There’s no change to its 2% inflation target. Inflation is moderating, including within stickier buckets like wages. He spoke optimistically about labor supply imbalance normalizing (partially helped by more immigration) with more progress needed.
He lamented on how far the Fed has come in terms of hikes and quantitative tightening (QT) over the last year +. Again he reiterated that the Fed will consider the cumulative and lagging impact of hikes. These hikes generally take 12-18 months to fully cycle through the system. Monetary policy was called restrictive, but more restriction is possible if data warrants it. In the meantime, QT will continue at the same pace. Rates are weighing heavily on the cost of capital sensitive sectors like solar energy, real estate and fixed business investment overall.
Robust economic activity could lead to another hike, although the data we got this week (shown below) makes that less likely. Finally, he hinted at recent bond market activity doing some of the work for the Fed as many have called out. Again, not much new here.
“The risks of doing too much vs. too little are clearly becoming more balanced.” – Powell
b. Data
This week showed cracks in employment health, continued downward pressure on inflation, and economic growth that looks more fragile, but still relatively healthy.
Inflation:
ISM Manufacturing Prices for October came in at 45.1 vs. 45 expected and 43.8 last month.
Unit Labor costs Q/Q for Q3 fell by 0.8% vs. expectations of 0.7% growth and 3.2% growth last quarter.
Average Hourly Earnings M/M for October rose 0.2% vs. 0.3% expected and 0.3% last month.
ISM Non-Manufacturing Price Index was 58.6 vs. 56.6 expected and 58.9 last month.
Output:
The Chicago Purchasing Managers Index (PMI) for October was 44 vs. 45 expected and 44.1 last month.
Manufacturing PMI for October was 50 vs. 50 expected and 49.8 last month.
Institute of Supply Management (ISM) PMI was 46.7 vs. 49 expected and 49 last month.
Non-farm Productivity Q/Q for Q3 was 4.7% vs. 4.1% expected and 3.6% last quarter.
S&P Global Composite PMI for October was 50.7 vs. 51 expected and 50.2 last month.
Services PMI for October was 50.6 vs. 50.9 expected and 50.1 last month.
ISM Non-Manufacturing PMI for October was 51.8 vs. 53 expected and 53.6 last month.
Consumer/Employment:
The Unemployment Rate for October was 3.9% vs. 3.8% expected and 3.8% last month.
Conference Board Consumer Confidence was 102.6 for October vs. 100 expected and 104.3 last month.
ADP Non-farm Employment Change was 113,000 for October vs. 150,000 expected and 89,000 last month.
Initial Jobless Claims were 217,000 vs. 210,000 expected and 212,000 last report.
Non-farm Payrolls for October rose by 150,000 vs. 180,000 expected and 297,000 last month.
Labor Force Participation Rate for October was 62.7% vs. 62.8% expected and 62.8% last month.
Private Non-farm Payrolls for October rose by 99,000 vs. 158,000 expected and 246,000 last month.
10. Portfolio
No transactions this week.
Great information as always.Would love to see a bit more detail on your portfolio such as purchase cost,date and profit/loss percentage
Thanks for the newsletter Brad. This is the best one out there. Looking forward to it every week!