- For a quick overview of Lemonade's business, click here.
- For a detailed review of its latest investor day, click here.
Other recent earnings reviews:
Table of Contents
a. Key Points
- 10th straight quarter of accelerating top-line growth.
- Underwriting trends continue to look good.
b. Demand
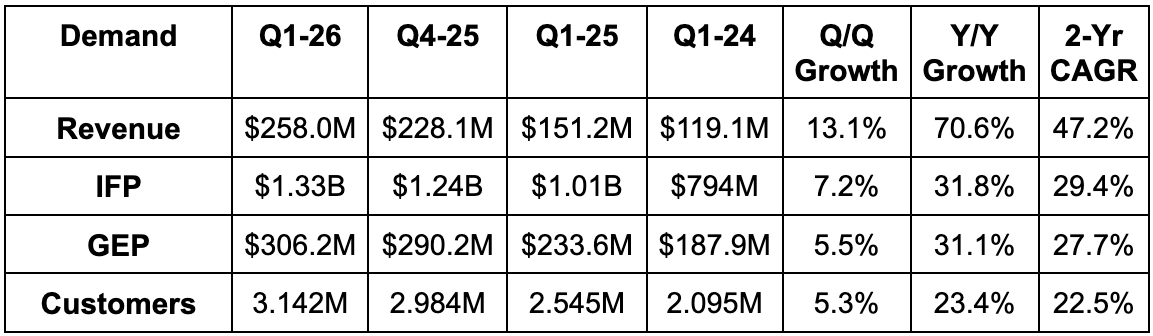
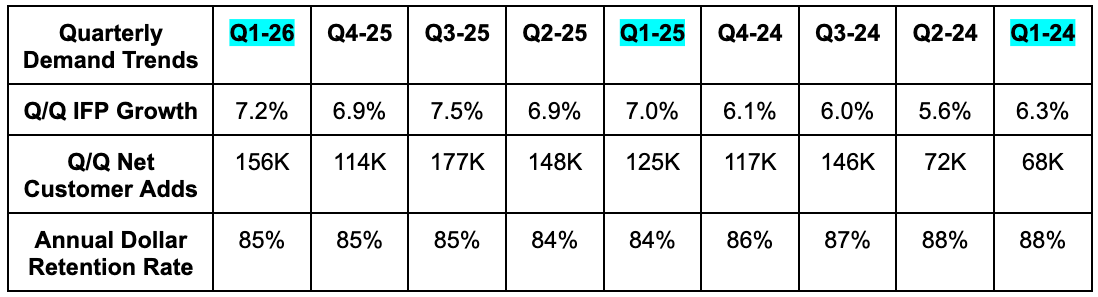
- Beat In Force Premium (IFP) estimate by 0.6% & beat guidance by 0.7%.
- Beat Gross Earned Premium (GEP) estimate by 0.7% & beat guidance by 1.9%.
- Beat revenue estimate by 2.2%.
Note that a lower rate of ceded premiums to reinsurers is currently propping up revenue growth. Lemonade’s rising confidence in their underwriting, profitability and liquidity all gave it the confidence to keep a larger portion of their overall demand. This means more revenue on the same base of premiums and, if done well in terms of pricing risk, should be a profit dollar accelerant as well. IFP and GEP growth both were strong and offer a better sense of demand right now, as both exclude that noise. This pattern of revenue growth greatly leading IFP and GEP growth will continue for one more quarter. The rate of premiums ceded will reach 20% at that point, but they hinted at the rate maybe falling a little more when the contract renews in July. There could be another revenue growth accelerant coming.
c. Profits
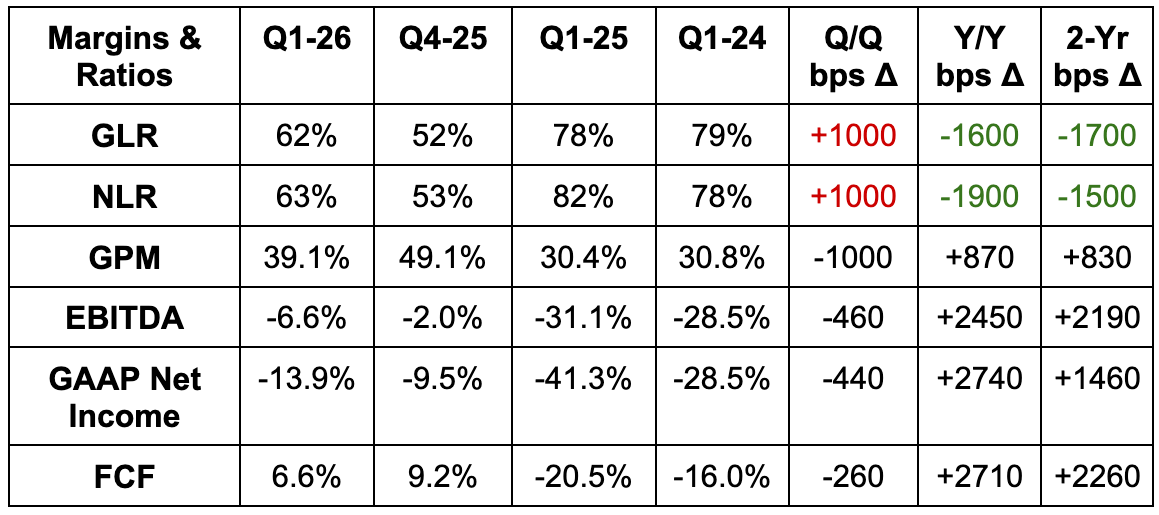
- Beat 37.5% GPM estimate by 160 basis points (bps; 1 basis point = 0.01%).
- Gross profit rose by 160% Y/Y thanks to better loss ratios and the lower Y/Y rate of ceded premiums. EBITDA loss shrank by 64% Y/Y while net loss shrank by 43% Y/Y.
- Beat EBITDA estimate by 27% & beat guidance by 24%.
- OpEx excluding loss adjustment expense (LAE; cost to handle claims) rose by 25% Y/Y.
- Other insurance expenses rose by 8% Y/Y or by 26% excluding the California Fair Access to Insurance Requirements (FAIR) Plan expense from last year.
- Sales & marketing including growth spend rose by 43% Y/Y.
- Technology development expense rose by 22% Y/Y.
- Headcount rose by 2% Y/Y.
- The company expects most of its expense growth to come from variable and discretionary items rather than predominately more fixed costs.
- Beat -$0.57 GAAP EPS estimate by $0.10.
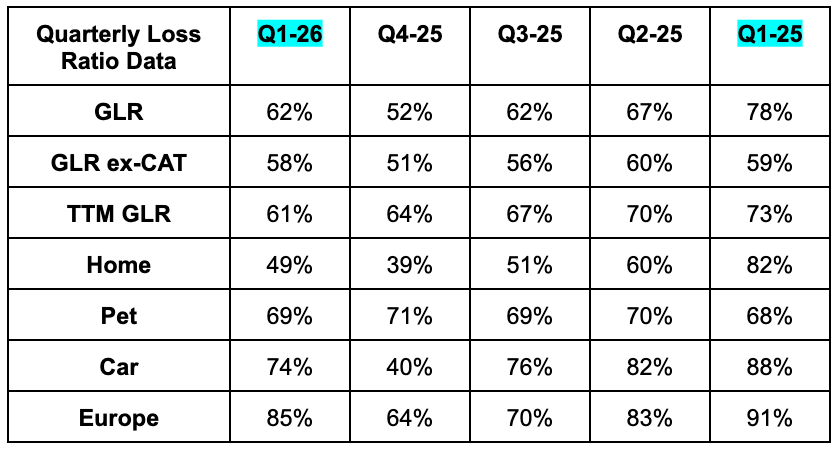
- Beat 70% gross loss ratio estimates by 8 points and still by 5 points even without prior period development help (when actual losses from a previous period are better than expected)
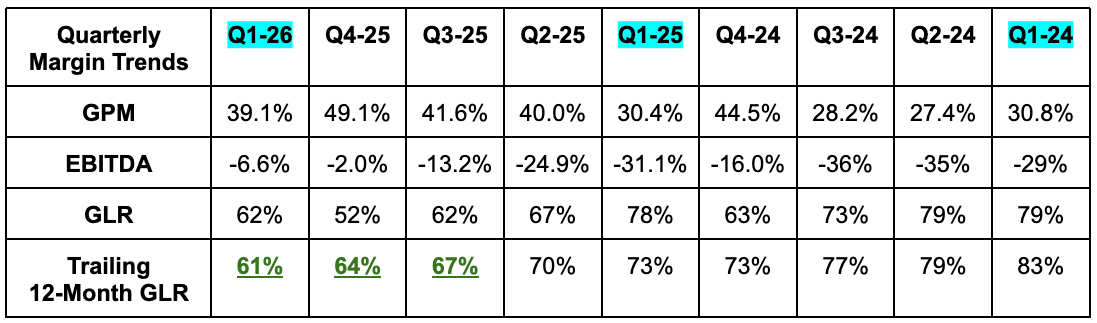
- Y/Y loss ratio improvements were helped a lot by lapping last year’s California Wildfires. Still, GLR excluding this item improved from 59% to 58% Y/Y.
FCF is noisy here. As a reminder, Lemonade uses something called synthetic agents. These synthetic agents effectively finance its growth spend, which means the cash drain other companies would incur from spending this money isn't immediately incurred by Lemonade. Instead, they pay an interest expense gradually over time. That makes Lemonade's FCF metric different from how most other companies calculate it, and makes it a bit noisy. For this reason, I like to focus on income statement profitability, which also looks inevitable at this point. It felt inevitable a few years ago, but now that once polarizing take seems like it's the consensus view.