

Over the next several weeks, subscribers will get 40+ earnings reviews, ongoing fundamental news coverage and real-time updates of my own portfolio/performance.
Other reviews sent so far include, AMD, Coupang, SoFi, Reddit, Amazon Lemonade, Meta, Alphabet, ServiceNow, Taiwan Semi, Netflix and more!
Axon, Shopify and Mercado Libre are all coming soon.
Join now to get access to all of this, my portfolio/performance and the Discord room.
a. Demand
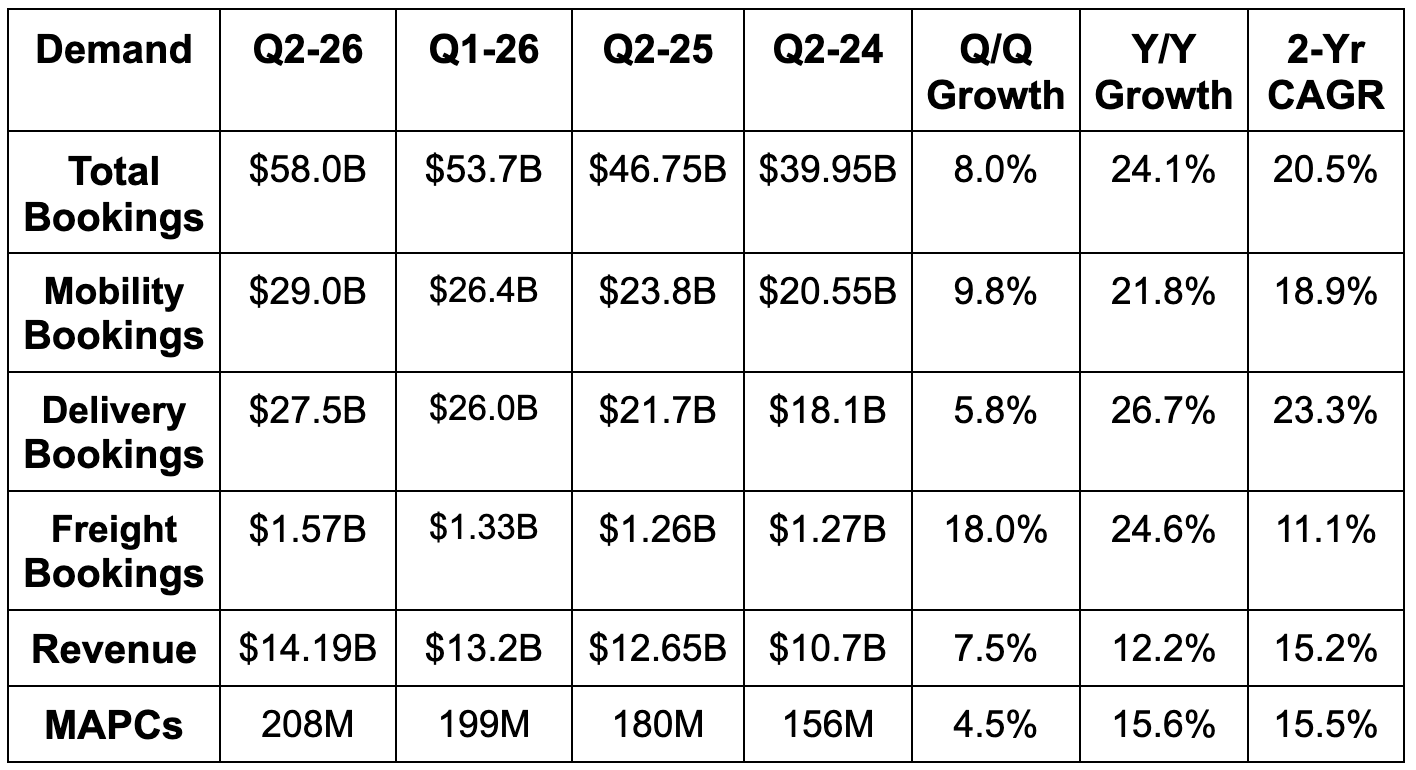
- Beat bookings estimate by 1.4% & beat guidance by 1.7%.
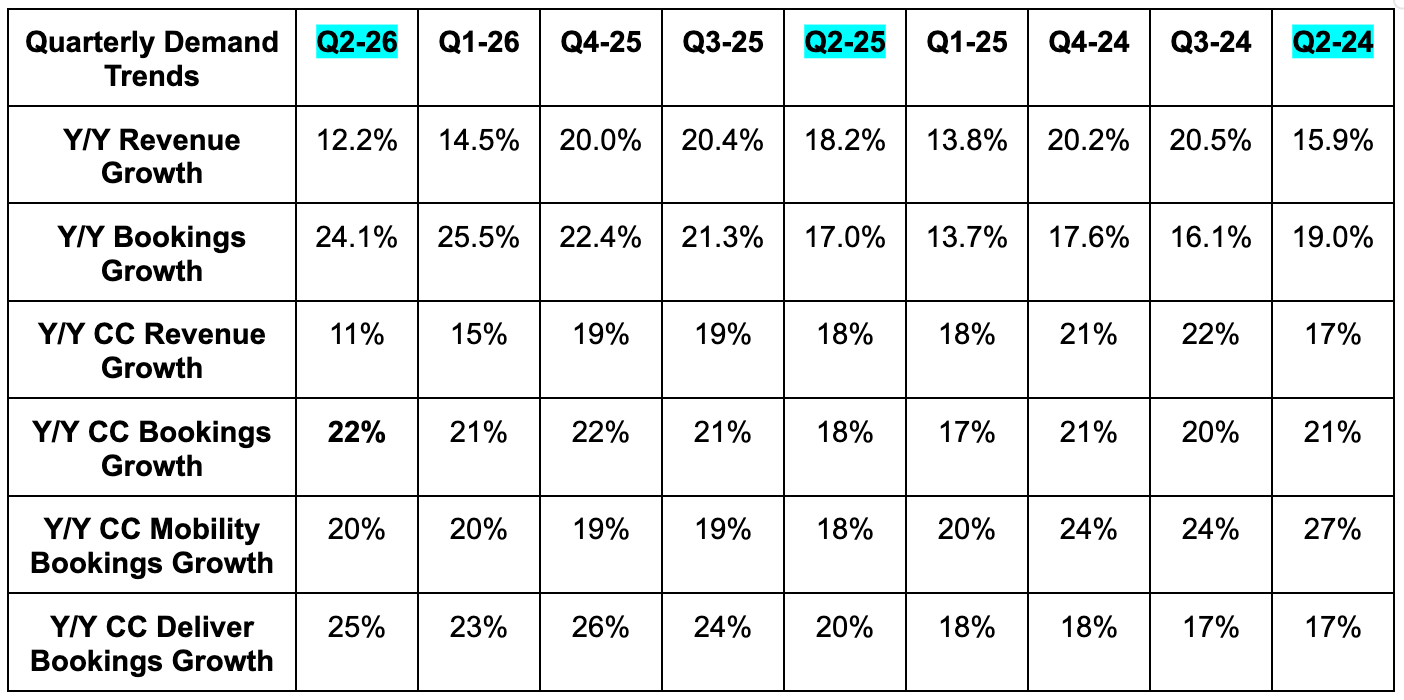
- Great to see 22% constant currency (CC) bookings growth accelerate sequentially and on a Y/Y basis despite modestly more difficult comparisons.
- Mobility bookings slightly beat estimate.
- Delivery bookings beat estimate by 2%.
- Freight bookings beat estimate by 20%.
- Roughly met revenue estimate.
- Please note that a UK tax law led to them classifying driver payments as contra-revenue instead of cost of revenue. This lowered mobility revenue as a percentage of mobility bookings by 4 points. The headwind will be in place for all of 2026 until comps normalize. Excluding this, revenue growth would have been around 20% Y/Y.
- Advertising revenue rose by 50% Y/Y to reach $2.5B annualized.
- Beat monthly active platform consumer (MAPC) estimate by 1M. Uber added more new users over the last 12 months than in any other 12-month period over the last 5 years.
- Trips growth was 18% Y/Y compared to 20% Y/Y last quarter and 18% Y/Y last year. The 2-point sequential deceleration was related to a temporary headwind in Brazil. More on this later.
- Price per trip did actually rise a bit Q/Q despite ongoing goals to control customer fees. It’s not related to meaningful price hikes. It was due to premium product growth, delivery segment growth, and U.S. market growth all surpassing the overall business. These reporting segments have higher average pricing.
The acceleration in underlying CC growth was driven by the USA more than anything else. The World Cup did help things a bit. Elsewhere, ongoing customer cost relief from insurance savings, rapid growth across higher end products like Uber for Business (U4B; 40% Y/Y growth) and strong traction in suburban markets all helped a lot more. It was good to hear that these three items had a materially larger influence on U.S. market success.
b. Profits
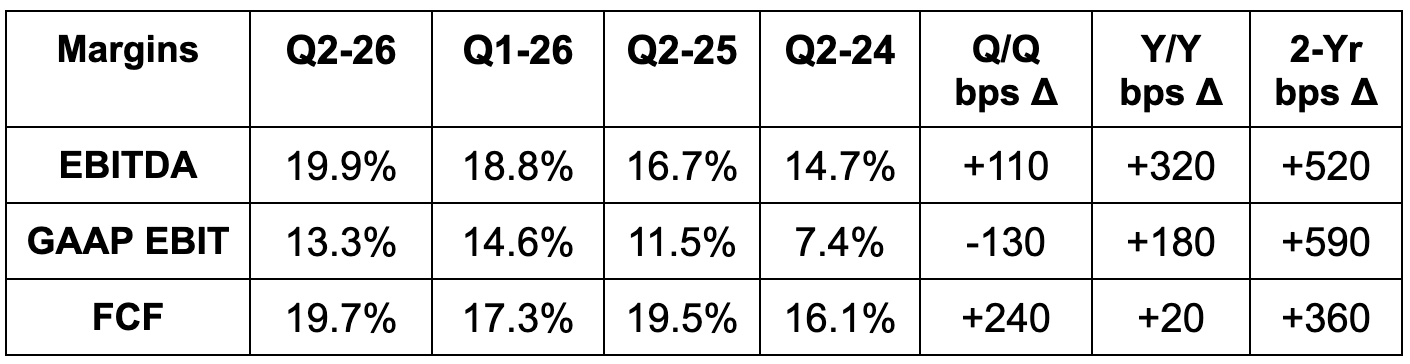
- Beat EBITDA estimate by 1.3% & beat guidance by 1.7%.
- Beat EBIT estimates by 4.3%.
- Mobility EBIT beat estimates by 3.5%. Mobility EBIT margin was 30% vs. 24% Y/Y (lower revenue from UK accounting change helps margins via lower denominator!)
- Delivery EBIT met estimates. Delivery EBIT margin was 20% vs. 19% Y/Y.
- Freight EBIT met estimates. Freight EBIT margin was -1.5% vs. -2.1% Y/Y.
- Beat $0.80 EPS estimate by $0.01 and beat guidance by $0.01.
- Net income margin was 11.6% vs. 9.3% Q/Q and 10.1% Y/Y.
- GAAP EPS includes a large equity gain. It is not a great metric for this company.
- EPS rose by 35% Y/Y.
- Missed FCF estimate by 13%.
- FCF rose by 13% Y/Y.
Uber is enjoying operating efficiencies from implementing AI technology. This is allowing it to reduce hiring plans for the year and streamline costs across several teams. And like everyone else, it's also getting a lot more aggressive in terms of using several different models for different needs based on optimal cost and performance. Dara is not interested in using just one. Very few large enterprise CEOs are. After all, would you want to commit to one model for everything even if it meant higher costs and/or lower performance?

c. Balance Sheet
- $5.4B cash & equivalents.
- $12.5B investments.
- $12.7B debt.
- -3.6% Y/Y diluted share count growth.